https://doi.org/10.1007/s10967-020-07245-y
Preparation, characterization and comparative ionizing
electromagnetic radiation performances: part I—metal oxide
reinforced polymeric composites
E. Eren Belgin1 · G. A. Aycik1
Received: 20 March 2020 / Published online: 15 June 2020 © Akadémiai Kiadó, Budapest, Hungary 2020
Abstract
Isophthalic polyester resin was reinforced by using different metal oxides (lead(II)oxide, tungsten(VI)oxide and ferric oxide) and different reinforcement ratios (10–50%). Ionizing electromagnetic radiation shielding performance of the composites were determined by gamma spectrometric techniques for three different ionizing electromagnetic radiation (IEMR) energy regions (60–392, 662–898, 1173–1836 keV). Density evaluation, FTIR analysis, SEM studies were carried out. The IEMR attenuation performances of the composites were determined with gamma spectroscopy and found to be satisfying. These composites give better performance with respect to reference lead, especially in the case of the applications that weight of IEMR shield is important.
Keywords Electromagnetic radiation shielding · Gamma shielding · Composite gamma shielding · Polymeric gamma shielding
Introduction
Massless and uncharged ionizing electromagnetic radiation (IEMR) has enough energy to ionize atoms of the interacting matter and it has harmful effects on human and environment. The ALARA (As Low As Reasonably Achievable) radiation safety principle is based on the minimization of radiation doses and limiting the release of radioactive materials into the environment by employing reasonable methods. IEMR must be shielded by using appropriate shielding materials according to ALARA principles. High density materials are used as IEMR shields to increase interaction between IEMR and matter for reducing its intensity and the exposure dose. At the present time, lead is the most used shielding material due to its low cost, high density and atomic number for wear-able, mobile and stationary shielding applications. Some other shielding materials are tungsten, copper, bismuth and steel, which are still in use but limited in use. However, lead shields has significant disadvantages that canalize scientist
for developing novel IEMR shielding materials as heaviness, low mechanic and chemical stability and toxicity.
Nowadays, composite materials are mostly studied because of their ability of combining different properties of the individual materials used for production of compos-ite material. Polymers are desired as matrix material for this manner because of their low weight, high mechanical/ chemical stability, cheapness, easy production methods and process ability. Different polymers can be chosen due to the application area of the shield providing needed properties as flexibility, UV stability, transparency etc. One of the most important points to be considered in the selection of polymer matrix is that the polymer used should not undergo degrada-tion on gamma radiadegrada-tion. IEMR shielding performance of the polymer based composite materials are mostly improved by using reinforcement materials with high density. Epoxy-limonite [1], polymer-bismuth [2], lead-natural rubber [3, 4], lead-unsaturated polyester [5], poly(hydroxylethyl
metacrylate)-tungsten(VI) oxide [6], hafnium/tungsten
trioxide-epoxy [7], poly(vinyl alcohol)-bismuth oxide [8], UHMWPE-nano Bi2O3 [9], isophthalic polymer-bismuth [10], boron carbide reinforced polymers [11], epoxy based [12] composites are some of studied polymer based compos-ites for radiation shielding.
* E. Eren Belgin [email protected]
1 Chemistry Department, Mugla Sitki Koçman University, Kotekli Campus, 48000 Muğla, Turkey
In the present study, isophthalic unsaturated polyester (PES) was reinforced with three different metal oxide (lead (II) oxide, tungsten (VI) oxide and ferric oxide) and five different reinforcement ratios between 10 and 50%. PES was chosen as composite matrix for providing load-stress transfer while decreasing composite weight and composite raw material and processing cost. Formation of secondary radiation was also set down to minimum due to the hydrogen content of PES by generating many interaction points in the polymer and due to the lack of heavier atoms than carbon in the PES in contrast with lead. The function of metal oxide reinforcements increased IEMR shielding performance of the composites due to higher densities and atomic numbers than PES.
IEMR shielding performances were determined by gamma spectrometric methods at three different IEMR energy regions. These energy intervals were selected by considering the predominant IEMR-matter interaction mech-anisms differing mainly according to IEMR energies that affects shielding performance of the composites, Table 1.
Studying at different energy regions also permit suggest-ing different composites for different application areas that radiation sources with different energies are used. Obtained results were compared for different composites and different reinforcement loading ratios.
Several characterization studies were also carried out for prepared composites. After density evaluation was done FTIR analysis were held for understanding nature of interac-tion between reinforcements and matrix of the composite. SEM studies were also carried out for morphological exami-nation of composites.
Experimental
Constituents of the composites
Composite matrix PES (1.15 g cm−3) with low volumetric
shrinkage is a thermoset resin in styrene monomer. Styrene
decreases viscosity of the resin and allows preparation of a homogeneous composite mixture including reinforcement materials, catalyst and initiator. The PES resin, the initia-tor (MEKP: methyl ethyl ketone peroxide) and the catalyst (Coct: cobalt octoate) used for composite production were procured commercially.
Three different reinforcement materials were used for composites. Their properties are given in Table 2.
Preparation of the composites
Formation of crosslinks within PES resin was performed with free-radical polymerization process by using methyl ethyl ketone peroxide as the radical source and cobalt octo-ate (Coct) catalyst. Thus crosslinks that would led a rigid three dimensional lattice of the PES thermoset were formed. Resin mixtures were prepared by using five different filler loadings between 10 and 50%. Reinforcement materials were oven dried to the constant weight at 110 °C temperature before weighing. Reinforcements and resin were weighed with a calibrated (10−3 g) electrical balance and
reinforce-ment particles were mechanically dispersed (120 rpm) into the resin. Then 0.75% Coct and 1.25% MEKP were added to the resin and crosslinking process was started. In this step it was observed that if mixture is immediately poured into the mold the heavy reinforcement particles starts to precipitate at the bottom of the mold due to gravity. Thus mechanically mixing was continued until gelation point of the resin where viscosity of the mixture was increased due to crosslinking. Thus precipitation of the reinforcement particles was pre-vented. Then composite mixture was placed into a closed steel mold by overflowing. The composites were cured in the mold for 24 h at room temperature and eight hours at 80 °C constant temperature for completion of the polymerization. Characterization of composites
Density evaluation and structural characterization of the composites
An Archimedes’ density measurement equipment was used for evaluation of experimental densities of the composites. Theoretical values of the bulk densities of the composites were also calculated and compared with the experimental
Table 1 Predominant IEMR-matter interaction mechanisms at differ-ent IEMR energies
IEMR energy Predominant
inter-action mechanism Relationship with atomic number (Z) of absorber material
Low (especially for ener-gies < 400 keV)
Photoelectric effect Z5 Intermediate Compton scattering Z High (especially
for ener-gies > 1.02 MeV)
Pair production Z2
Table 2 Chemical properties of the used reinforcements
Reinforcement Molecular weight Density Crystal structure PbO (BDH) 223.20 g mol−1 9.53 g cm−3 Orthorhombic WO3 (Sigma
Aldrich) 231.84 g mol
−1 7.16 g cm−3 Monoclinic Fe3O4 (BDH) 231.533 g mol−1 5 g cm−3 Rhombohedral
values. Details of the experimental and theoretical density evaluation methods are previously described [13]. Nature of interaction between PES and reinforcements is examined by Fourier transform infrared spectrophotometer (FTIR-Thermo Scientific-Nicolet-1510) analysis. Morphological examination of composites was carried out by using scan-ning electron microscope (SEM-Jeol-JSM-7600F) for both fractured and polished surfaces of the composites. Dispers-ibility of reinforcement particles with PES, microstructure of the composites and binding behavior between reinforcement and matrix were examined by using SEM micrographs. IEMR attenuation performance measurements
IEMR attenuation performances of the composites were determined via gamma spectrometric measurements by
using a 110 cm3 well-type HPGe detector coupled with
a 64 k channel analyzer. The system had a resolution of 3.78 keV at 1.33 MeV gamma-ray peak of Co-60. The detec-tor was housed in a lead shielding 10 cm thick lined with 1.5 mm thick tin and 1.0 mm thick copper in order to reduce the X-ray interferences. Performance measurements were held for low (0–500 keV), intermediate (500–1100 keV) and high (> 1100 keV) IEMR energy regions for determi-nation of usability of composites for shielding of different IEMR sources used in different application areas. A disc shaped standard mixed point gamma source (Eckert &
Ziegler-Mixed nuclide point source-QCRB1186) containing several radionuclides having photopeak energies between 60 and 1836 keV was used for measurements in this manner. Radionuclide content (that have clear photopeaks) of the source, photopeak energies and activities of the radionu-clides are given in Table 3.
IEMR attenuation performance calculations were done relatively by comparing inlet and outlet radiation intensity of photopeaks to avoid any efficiency calibration errors. Inlet radiation intensity was measured by a blank measurement (measurement for only source without placing any other material between the source and detector) since knowing the gamma radiation intensity directly coming from the source would led to calculate attenuation ratio of the materials. The geometrical arrangement of the measurement system is given in Fig. 1.
The data acquisitions were performed for a period of 1500 s that gives < 1% count error. The spectra were evalu-ated by using the Maestro-ORTEC software program. All the measurements were held three times and the mean values were used for the calculations.
After measurements were completed, percentage attenu-ation performances (F%), half value layers (HVL), linear (µL) and mass (µM) attenuation coefficients of the composites were calculated as it was given detailed in previous articles [13–15].
Results and discussion
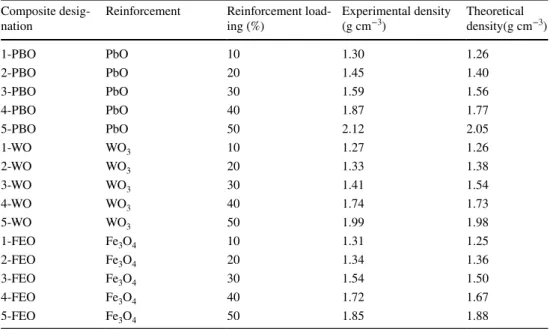
Density and microstructure of the composites The composite designations, reinforcement loading percent-ages and densities of the prepared composites are summa-rized in Table 4.
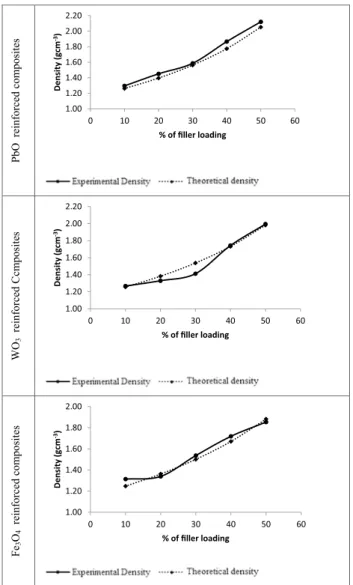
Composite density was increased with increase reinforce-ment ratio for all reinforcereinforce-ment types. This is an expected result since density of the reinforcements (PbO: 9.53 g cm−3;
WO3: 7.16 g cm−3; Fe3O4: 5.00 gcm−3) are higher than
den-sity of PES (1.15 g cm−3) (see Fig. 2).
The experimental and theoretical densities of the compos-ites were compatible with each other. Maximum deviation
Table 3 Mixed point source radionuclide content, their photopeak energies and activities considered in performance calculations Radionuclide Photopeak
energy (keV) Activity (kBq) Overall uncertainty (%) Am-241 60 3 3 Co-57 122 0.6 2.5 Ce-139 166 0.7 2.5 Hg-203 27 2.1 2.5 Sn-113 392 2.8 5 Cs-137 662 2.6 2.5 Y-88 898, 1836 5.9 4 Co-60 1173, 1332 3.0 1
was observed for 3-WO composite with approximately 8% difference between the values. These acceptable differences were thought to arise from weighing errors made dur-ing preparation of the composites and density evaluation experiments.
The maximum filler loading of 50% caused an increment in the density of the composite matrix (PES) approximately 84%, 73% and 61% for PbO, WO3 and Fe3O4 reinforcements, respectively. Increment in experimental densities was also showed that critical reinforcement loading is not exceed for composites. Because if critical loading value was exceeded, there couldn’t be enough PES resin to surround surfaces of all reinforcement particles. This would cause formation of gaps in the structure that decreases density of the compos-ites [5].
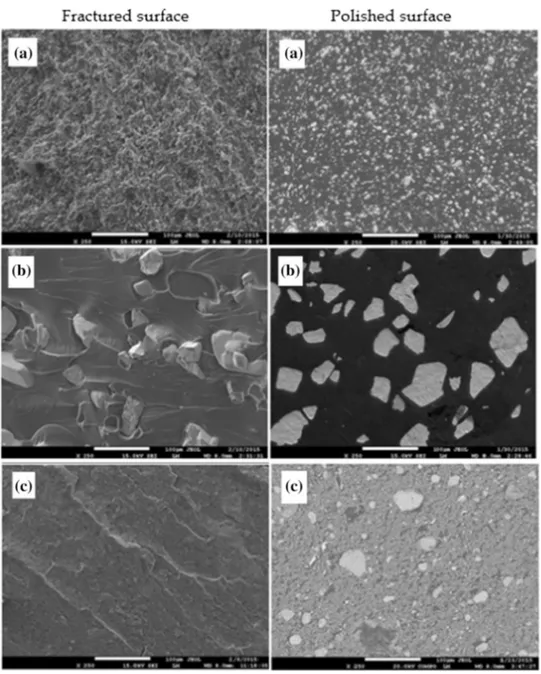
The micrographs determined by SEM studies for the pol-ished and fractured surfaces of the 50% reinforced compos-ites are shown in Fig. 3.
Reinforcement and PES were easily distinguished at the polished surfaces and phase separation at the reinforcement-PES interface was not observed. Homogeneous dispersion of reinforcement particles was one of the most important requirement for accurate results of the study. SEM micro-graphs showed a good dispersibility of the reinforcement within PES matrix.
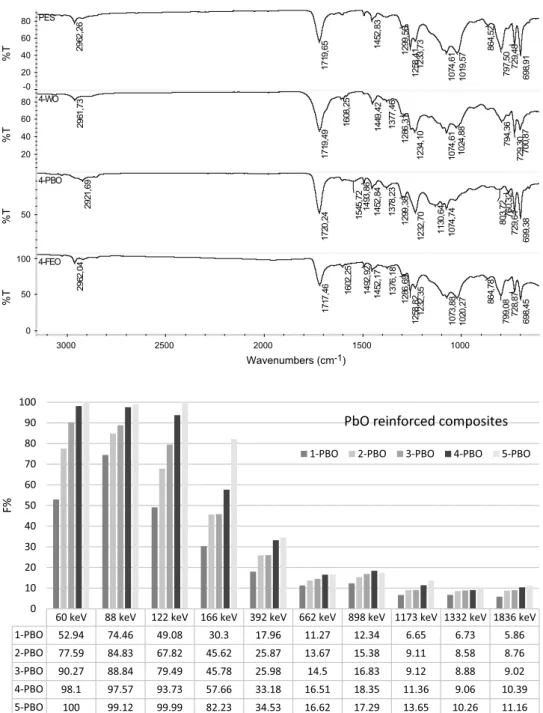
The FTIR spectra of the 50% reinforced composites and composite matrix PES are given in Fig. 4.
Characteristic transmission bands (approximately 1720,
1240, 1015, 790 cm−1) of PES are seen in FTIR spectrum
of PES in Fig. 4. The same positions of transmission band peaks were also represented by PES based composites are also seen at the FTIR spectra of all the composites. No significant difference in FTIR peak locations was found for
composites and pure PES. Percentage transmission value of these bands showed some differences due to possible bond density differences at the interested region of the analyzed sample. Thus FTIR studies indicated that there were no changes in chemical structure of polymer after addition of reinforcements.
IEMR attenuation performances of the composites Effect of reinforcement loading ratio on IEMR attenuation performances
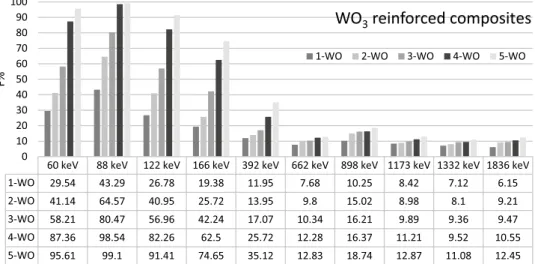
The determined F% values that represent percentage IEMR attenuation performances of the composites are given with respect to IEMR energy are given in Figs. 5, 6 and 7 for PbO, WO3 and Fe3O4 reinforced composites, respectively.
IEMR attenuation performances of all composites had an increasing tendency with increasing reinforcement loading ratio for all composites. The increment was due to increasing density of the composites. The sharpest increas-ing was observed between 0 and 500 keV IEMR energy that photoelectric effect is dominant interaction mecha-nism. Increasing behavior was continued as the IEMR energy increases but not as sharp as low energies. This was a compatible result because the predominant inter-action mechanisms of photoelectric effect (0–500 keV), Compton scattering (500 keV–10 MeV) and pair produc-tion (> 1.022 MeV) are proporproduc-tional with Z5, Z and Z2,
respectively. Thus increasing density of the composites causes sharp increasing at low energies while increasing is smoother at higher energies.
Table 4 Sample designations, reinforcement loading percentages and experimental/ theoretical densities of the prepared composites
Composite
desig-nation Reinforcement Reinforcement load-ing (%) Experimental density (g cm−3) Theoretical density(g cm−3)
1-PBO PbO 10 1.30 1.26 2-PBO PbO 20 1.45 1.40 3-PBO PbO 30 1.59 1.56 4-PBO PbO 40 1.87 1.77 5-PBO PbO 50 2.12 2.05 1-WO WO3 10 1.27 1.26 2-WO WO3 20 1.33 1.38 3-WO WO3 30 1.41 1.54 4-WO WO3 40 1.74 1.73 5-WO WO3 50 1.99 1.98 1-FEO Fe3O4 10 1.31 1.25 2-FEO Fe3O4 20 1.34 1.36 3-FEO Fe3O4 30 1.54 1.50 4-FEO Fe3O4 40 1.72 1.67 5-FEO Fe3O4 50 1.85 1.88
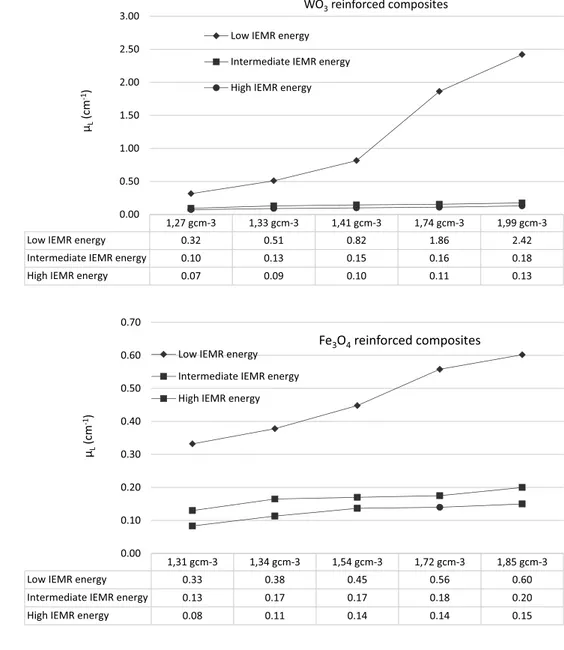
Effect of the composite density on linear attenuation coefficients
The µL values of the prepared composites showed a lin-ear dependence on densities. This dependence is shown in Figs. 8, 9 and 10 for PbO, WO3 and Fe3O4 reinforced
com-posites, respectively. Mean µL values for low (mean of 60,
88, 122, 166, 392 keV results), intermediate (mean of 662, 898 keV results) and high (mean of 1173, 1332, 1836 keV results) energy regions are plotted in the figures for a more comprehensible comparison.
The interaction mechanisms of IEMR with matter differs due to energy of the IEMR as it was mentioned for F% val-ues of the composites. The predominant interaction mecha-nisms differ due to IEMR energies and they are proportional with Z5 (low), Z (intermediate) and Z2 (high) at different
IEMR energy regions [16]. Thus as the energy increases
dependence of attenuation on Z of interacting material decreases as it is seen Figs. 8, 9 and 10. In the study, the µL values of the composites increased sharply with increasing density of the composites at low IEMR energy region, the density became ineffective on µL values for intermediate energy region and a slightly insignificant increasing behavior observed for high energy region as it was expected.
Effect of reinforcement type on linear attenuation coefficients
The absorber materials attenuate IEMR at different ratios according to their densities, molecular weights and crystal structures. The main factor for effective attenuation is that when IEMR passes through the material, it comes across the maximum number of atoms and atomic electrons. Thus, more energy is transferred to these atoms and IEMR exits from the material with low energy or attenuate totally. Thus as the reinforcement loading ratio increases (density increases) the probability of coming across of IEMR with an atom increases.
The crystal structure of the material is another property that effects this probability. If the crystal lattice structure of the material is close packed the IEMR attenuation probabil-ity increases. Crystal structures of all three reinforcements used in this study are the close packed lattice structures.
In Figs. 11, 12 and 13, the 50% reinforced composites’ (showing the highest performances) and lead’s µL values are compared for low, intermediate and high energy regions, respectively.
Lead is an excellent IEMR shielding material due to its high density and closed packed crystal structure beside its important disadvantages as toxicity. Thus as it was expected, lead had higher µL values, in other words higher attenuation
performance for unit thickness, for all energy regions. On the other hand, 5-PBO composite reached approximately 76% performance of lead at low energy region and it was supe-rior on lead with its approximately 5.5 times lower weight and non-toxic nature. The reinforcement PbO was still toxic but it was buried into PES thus composite was not toxic during utilization. If both of reinforcement and matrix is desired non-toxic, 5-WO could be proposed with its approxi-mately 5.7 times lower weight and performance reaching approximately 35% performance of lead. The composite per-formances were not showed significant performance differ-ences for intermediate and high energy regions as reason of it mentioned before. The composite with best performance was 5-FEO with its non-toxic nature and performance reach-ing approximately 21% and approximately 26% of lead per-formance, respectively at these regions. 5-FEO was also approximately 6 times lighter than lead and non-toxic that makes it advantageous.
PbO reinforced composites
WO 3 reinforced Ccmposite s Fe3 O4 reinforced composites 1.00 1.20 1.40 1.60 1.80 2.00 2.20 0 10 20 30 40 50 60 Density (gcm -3) % of filler loading 1.00 1.20 1.40 1.60 1.80 2.00 2.20 0 10 20 30 40 50 60 Densit y( gc m -3) % of filler loading 1.00 1.20 1.40 1.60 1.80 2.00 0 10 20 30 40 50 60 Densit y( gc m -3) % of filler loading
Fig. 2 Variation of the theoretical and experimental values of densi-ties with respect to filler loading
Effect of reinforcement type on mass attenuation coefficients
µM value that represent attenuation per gram of a shield-ing material is another important parameter especially when weight of the shield is important. In case of using shielding materials with high µM values, higher performances can be
achieved with a lighter shield. The determined µM values of the prepared composites, elemental lead and PES are given in Table 5.
According to results, the µM values of the composites
became independent from the type of used reinforcement for intermediate and high energy regions in accordance with the changing dominant interaction mechanisms in different energies regions. For the low energy region, composites with denser electron density have been found to have higher µM
values because of the photoelectric interaction. The µM
val-ues of the prepared composites and elemental lead are also compared by using mean µM values for low, intermediate and high IEMR energy regions in Fig. 14.
The heaviest composite produced in this study is approxi-mately 5.5 times lighter than lead. Thus although µL values
of lead was higher than the composites µM values of lead was lower than nearly all the composites.
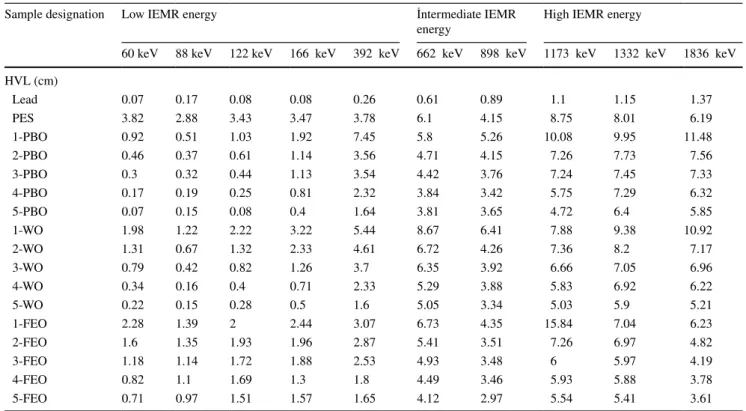
Half value layer (HVL) values of the composites
The determined HVL values, that is the thickness of the material at which the intensity of radiation entering is reduced by one half, are given for the prepared composites, elemental lead and PES in Table 6.
Fig. 3 SEM micrographs (× 250) of composite polished surfaces and fractured surfaces (a 5-PBO, b 5-WO, c 5-FEO)
Although high thickness is a disadvantage for wearable shields, produced composites were still lighter than lead for the same shielding performance. For low IEMR energy region 5-PBO composite reached approximately 84.6% per-formance of lead. According HVL values, a 5-PBO shield that is approximately 3.6 times thicker than lead shield would perform the same attenuation performance with lead shield, and its total mass would still be approximately 1.5 times less than lead shield even in this thickness. For intermediate and high energy regions 5-FEO composite reached approximately 29.8% and approximately 31.3% performance of lead, respectively. This composite would perform the same attenuation performance with lead shield
when it is approximately 4.7 times thicker (for intermediate energies) and approximately 4.00 times thicker (for high energies) than a lead shield. Although it is used thicker it would still be approximately 1.3 times lighter at low energy region and approximately 1.5 times lighter at high energy region.
Conclusions
In the study, all the reinforcement particles were observed to disperse uniformly in the PES matrix. Composites exhibited good IEMR shielding properties especially for high filler
Fig. 4 FTIR spectra of the PES and 50% reinforced composites
69 8, 91 72 9, 48 79 7, 50 86 4, 52 10 19 ,5 7 10 74 ,6 1 12 33 ,7 3 12 58 ,4 1 12 99 ,5 6 14 52 ,8 3 17 19 ,6 5 29 62 ,2 6 PES -0 20 40 60 80 %T 70 0, 87 729 ,3 0 79 4, 36 10 24 ,8 8 10 74 ,6 1 12 34 ,1 0 12 86 ,3 1 13 77 ,4 6 14 49 ,4 2 16 08 ,2 5 17 19 ,4 9 29 61 ,7 3 4-WO 20 40 60 80 %T 699 ,3 8 729 ,6 4 76 0, 32 80 3, 72 10 74 ,7 4 113 0, 64 12 32 ,7 0 12 99 ,3 8 137 8, 23 145 2, 84 14 93 ,8 6 15 45 ,7 2 172 0, 24 292 1, 69 4-PBO 50 %T 69 8, 45 72 8, 87 799 ,0 8 864 ,7 8 10 20 ,2 7 107 3, 88 12 32 ,3 5 125 8, 82 128 6, 69 137 6, 18 14 52 ,1 7 14 92 ,9 2 160 2, 25 17 17 ,4 6 296 2, 04 4-FEO 0 50 100 %T 1000 1500 2000 2500 3000 Wavenumbers (cm-1)
Fig. 5 F% values of PbO rein-forced composites at different IEMR energies
60 keV 88 keV 122 keV 166 keV 392 keV 662 keV 898 keV 1173 keV 1332 keV 1836 keV
1-PBO 52.94 74.46 49.08 30.3 17.96 11.27 12.34 6.65 6.73 5.86 2-PBO 77.59 84.83 67.82 45.62 25.87 13.67 15.38 9.11 8.58 8.76 3-PBO 90.27 88.84 79.49 45.78 25.98 14.5 16.83 9.12 8.88 9.02 4-PBO 98.1 97.57 93.73 57.66 33.18 16.51 18.35 11.36 9.06 10.39 5-PBO 100 99.12 99.99 82.23 34.53 16.62 17.29 13.65 10.26 11.16 0 10 20 30 40 50 60 70 80 90 100 F%
PbO reinforced composites
Fig. 6 F% values of WO3 rein-forced composites at different IEMR energies
60 keV 88 keV 122 keV 166 keV 392 keV 662 keV 898 keV 1173 keV 1332 keV 1836 keV
1-WO 29.54 43.29 26.78 19.38 11.95 7.68 10.25 8.42 7.12 6.15 2-WO 41.14 64.57 40.95 25.72 13.95 9.8 15.02 8.98 8.1 9.21 3-WO 58.21 80.47 56.96 42.24 17.07 10.34 16.21 9.89 9.36 9.47 4-WO 87.36 98.54 82.26 62.5 25.72 12.28 16.37 11.21 9.52 10.55 5-WO 95.61 99.1 91.41 74.65 35.12 12.83 18.74 12.87 11.08 12.45 0 10 20 30 40 50 60 70 80 90 100 F%
WO
3reinforced composites
1-WO 2-WO 3-WO 4-WO 5-WO
Fig. 7 F% values of Fe3O4
rein-forced composites at different IEMR energies
60 keV 88 keV 122 keV 166 keV 392 keV 662 keV 898 keV 1173 keV 1332 keV 1836 keV
1-FEO 26.26 39.3 29.24 24.76 20.22 9.78 14.73 4.28 9.37 10.53 2-FEO 35.23 40.05 30.21 29.84 21.48 12.02 17.9 9.11 9.47 13.4 3-FEO 44.3 45.5 33.2 30.86 23.99 13.13 18.07 10.9 10.96 15.23 4-FEO 56.91 46.76 33.67 41.28 31.89 14.31 18.17 11.04 11.11 16.77 5-FEO 62.51 50.96 36.84 35.68 34.33 15.49 20.79 11.76 12.03 17.46 0 10 20 30 40 50 60 70 80 90 100 F% Fe3O4reinforced composites
1-FEO 2-FEO 3-FEO 4-FEO 5-FEO
Fig. 8 Plot of linear dependence of µL values on density of PbO reinforced filled composites
1,3 gcm-3 1,45 gcm-3 1,59 gcm-3 1,87 gcm-3 2,12 gcm-3
Low IEMR energy 0.65 1.06 1.38 2.32 5.23
Intermediate IEMR energy 0.13 0.16 0.17 0.19 0.19
High IEMR energy 0.07 0.09 0.09 0.11 0.13
0.00 1.00 2.00 3.00 4.00 5.00 6.00 µL (c m -1)
PbO reinforced composites
Low IEMR energy Intermediate IEMR energy High IEMR energy
Fig. 9 Plot of linear dependence of µL values on density of WO3 reinforced filled composites
1,27 gcm-3 1,33 gcm-3 1,41 gcm-3 1,74 gcm-3 1,99 gcm-3
Low IEMR energy 0.32 0.51 0.82 1.86 2.42
Intermediate IEMR energy 0.10 0.13 0.15 0.16 0.18
High IEMR energy 0.07 0.09 0.10 0.11 0.13
0.00 0.50 1.00 1.50 2.00 2.50 3.00 µL (c m -1) WO3reinforced composites
Low IEMR energy Intermediate IEMR energy High IEMR energy
Fig. 10 Plot of linear depend-ence of µL values on density of Fe3O4 reinforced filled composites
1,31 gcm-3 1,34 gcm-3 1,54 gcm-3 1,72 gcm-3 1,85 gcm-3
Low IEMR energy 0.33 0.38 0.45 0.56 0.60
Intermediate IEMR energy 0.13 0.17 0.17 0.18 0.20
High IEMR energy 0.08 0.11 0.14 0.14 0.15
0.00 0.10 0.20 0.30 0.40 0.50 0.60 0.70 µL (c m -1) Fe3O4reinforced composites
Low IEMR energy Intermediate IEMR energy High IEMR energy
Lead, 6.89 5-PBO, 5.23 5-WO, 2.42 5-FEO, 0.60 0.00 1.00 2.00 3.00 4.00 5.00 6.00 7.00 8.00 µL(cm-1) Low IEMR energy
Fig. 11 µL values of composites and lead for low IEMR energy region
Lead, 0.96 5-PBO, 0.19 5-WO, 0.18 5-FEO, 0.20 0.00 0.20 0.40 0.60 0.80 1.00 µL(cm-1) Intermediate IEMR energy
Fig. 12 µL values of composites and lead for intermediate IEMR
loadings and low energies. The density of the composites influenced the IEMR shielding performances of the com-posites for low IEMR energies significantly but as the IEMR energy was raised the density effect on IEMR shielding per-formances became ineffective.
Thus especially when weight of IEMR shield is important these composites are superior to lead by virtue of their light weight. Their non-toxic nature is also another important advantage of them. Lead, 0.58 5-PBO, 0.13 5-WO, 0.13 5-FEO, 0.15 0.00 0.10 0.20 0.30 0.40 0.50 0.60 µL(cm-1) High IEMR energy
Fig. 13 µL values of composites and lead for high IEMR energy region
Table 5 Determined µM values of the prepared composites, elemental lead and PES
Sample designation Low IEMR energy İntermediate IEMR
energy High IEMR energy
60 keV 88 keV 122 keV 166 keV 392 keV 662 keV 898 keV 1173 keV 1332 keV 1836 keV µM (cm2g−1) Lead 0.90 0.36 0.80 0.75 0.23 0.10 0.07 0.06 0.05 0.04 1-PBO 0.58 1.05 0.52 0.28 0.07 0.09 0.10 0.05 0.05 0.05 2-PBO 1.03 1.30 0.78 0.42 0.13 0.10 0.12 0.07 0.06 0.06 3-PBO 1.47 1.38 1.00 0.39 0.12 0.10 0.12 0.06 0.06 0.06 4-PBO 2.12 1.99 1.48 0.46 0.16 0.10 0.11 0.06 0.05 0.06 5-PBO 4.81 2.23 4.29 0.81 0.20 0.09 0.09 0.07 0.05 0.06 1-WO 0.28 0.45 0.25 0.17 0.10 0.06 0.09 0.07 0.06 0.05 2-WO 0.40 0.78 0.40 0.22 0.11 0.08 0.12 0.07 0.06 0.07 3-WO 0.62 1.16 0.60 0.39 0.13 0.08 0.13 0.07 0.07 0.07 4-WO 1.19 2.43 0.99 0.56 0.17 0.08 0.10 0.07 0.06 0.06 5-WO 1.57 2.36 1.23 0.69 0.22 0.07 0.10 0.07 0.06 0.07 1-FEO 0.23 0.38 0.26 0.22 0.17 0.08 0.12 0.03 0.07 0.08 2-FEO 0.32 0.38 0.27 0.26 0.18 0.10 0.15 0.07 0.07 0.11 3-FEO 0.38 0.40 0.26 0.24 0.18 0.09 0.13 0.08 0.08 0.11 4-FEO 0.49 0.37 0.24 0.31 0.22 0.09 0.12 0.07 0.07 0.11 5-FEO 0.53 0.38 0.25 0.24 0.23 0.09 0.13 0.07 0.07 0.10 0.61 0.09 0.05 2.47 0.09 0.06 1.21 0.09 0.07 0.33 0.11 0.08 0.00 0.50 1.00 1.50 2.00 2.50 µM (c m 2g -1)
Low IEMR energy Intermediate IEMR energy High IEMR energy
Lead 5-PBO 5-WO 5-FEO
Acknowledgements The authors would like to acknowledge the finan-cial assistance of the Mugla Sitki Kocman University through the Grant 2014/003 February 2014.
References
1. El-Sayed Abdo A, El-Sarraf MA, Gaber FA (2003) Utilization of ilmenite/epoxy composite for neutrons and gamma rays attenua-tion. Ann Nucl Energy 30:175–187
2. Plionis AA, Garcia SR, Gonzales ER, Porterfield DR, Peterson DS (2009) Replacement of lead bricks with non-hazardous poly-mer-bishmuth for low-energy gamma shielding. J Radioanal Nucl Chem 282:239–242
3. Gwaily SE, Madani M (2002) Lead-natural rubber composites as gamma radiation shields. II: High concentration. Polym Compos 23:495–499
4. Mheemeed AK, Hasan HI, Al-Jomaily FM (2012) Gamma-ray absorption using rubber-lead mixtures as radiation protection shields. J Radioanal Nucl Chem 291:653–659
5. Harish V, Nagaiah N, Niranjana Prabhu T, Varughese KT (2009) Preparation and characterization of lead monoxide filled unsatu-rated polyester based polymer composites for gamma radiation shielding applications. J Appl Polym Sci 112:1508–1530 6. Korpinar B, Ozturk BC, Cam NF, Akat H (2020) Radiation
shield-ing properties of poly(hydroxylethyl metacrilate)/Tungsten(VI) oxide composites. Mater Chem Phys 239:121986
7. Higgins MCM, Radcliffe NA, Toro-Gonzales M, Rojas JV (2019) Gamma ray attenuation of hafnium and tungsten trioxide-epoxy resin composites. J Radioanal Nucl Chem 332:707–716
8. Muthamma MV, Bubbly SG, Gudennavar SB, Narendranath KCS (2019) Poly(vinyl alcohol)-bismuth oxide composites for X-ray and gammaray shielding applications. J Appl Polym Sci 136:47949
9. Abdalsalam AH, Sayyed MI, Hussein TA, Sakar E, Mhareb MHA, Sakar BC, Alim B, Kaky KM (2019) A study of gamma attenu-ation property of UHMWPE/Bi2O3 nanocomposites. Chem Phys 523:92–98
10. Tijani SA, Al-Hadeethi Y (2019) The use of isophthalic-bismuth polymer composites as radiation shielding barriers in nuclear medicine. Mater Res Express. 6:055323
11. Avcioglu S, Buldu M, Kaya F, Ustundag CB, Kam E, Mencelo-glu YZ, Kaptan HY, Kaya C (2020) Processing and properties of boron carbide (B4C) reinforced composites for radiation shielding. Ceram Int 46:343–352
12. Banerjee P, Bhattacharjee Y, Bose S (2020) Lightweight epoxy-based composites for EMI Shielding Applications. J Electron Mater 49:1702–1720
13. Eren Belgin E, Ayçık GA (2015) Preparation and radiation attenu-ation performances of metal oxide filled polyethylene based com-posites for ionizing electromagnetic radiation shielding applica-tions. J Radioanal Nucl Chem 306:107–117
14. Eren Belgin E, Aycik GA, Kalemtas A, Pelit A, Dilek DA, Kavak MT (2015) Preparation and characterization of a novel ionizing electromagnetic radiation shielding material; hematite filled poly-ester based composites. Radiat Phys Chem 115:43–48
15. Eren Belgin E, Aycik GA, Kalemtas A, Pelit A, Dilek DA, Kavak MT (2016) Usability of natural titanium-iron oxide as filler mate-rial for ionizing electromagnetic radiation shielding composites; preparation, characterization and performance. J Radioanal Nucl Chem 309:659–666
16. Friedlander G, Kennedy JW, Macias ES, Miller JM (1981) Nucl Radiochem, 3rd edn. Wiley, New York
Publisher’s Note Springer Nature remains neutral with regard to jurisdictional claims in published maps and institutional affiliations.
Table 6 Determined HVL values of the prepared composites, elemental lead and PES
Sample designation Low IEMR energy İntermediate IEMR
energy High IEMR energy
60 keV 88 keV 122 keV 166 keV 392 keV 662 keV 898 keV 1173 keV 1332 keV 1836 keV HVL (cm) Lead 0.07 0.17 0.08 0.08 0.26 0.61 0.89 1.1 1.15 1.37 PES 3.82 2.88 3.43 3.47 3.78 6.1 4.15 8.75 8.01 6.19 1-PBO 0.92 0.51 1.03 1.92 7.45 5.8 5.26 10.08 9.95 11.48 2-PBO 0.46 0.37 0.61 1.14 3.56 4.71 4.15 7.26 7.73 7.56 3-PBO 0.3 0.32 0.44 1.13 3.54 4.42 3.76 7.24 7.45 7.33 4-PBO 0.17 0.19 0.25 0.81 2.32 3.84 3.42 5.75 7.29 6.32 5-PBO 0.07 0.15 0.08 0.4 1.64 3.81 3.65 4.72 6.4 5.85 1-WO 1.98 1.22 2.22 3.22 5.44 8.67 6.41 7.88 9.38 10.92 2-WO 1.31 0.67 1.32 2.33 4.61 6.72 4.26 7.36 8.2 7.17 3-WO 0.79 0.42 0.82 1.26 3.7 6.35 3.92 6.66 7.05 6.96 4-WO 0.34 0.16 0.4 0.71 2.33 5.29 3.88 5.83 6.92 6.22 5-WO 0.22 0.15 0.28 0.5 1.6 5.05 3.34 5.03 5.9 5.21 1-FEO 2.28 1.39 2 2.44 3.07 6.73 4.35 15.84 7.04 6.23 2-FEO 1.6 1.35 1.93 1.96 2.87 5.41 3.51 7.26 6.97 4.82 3-FEO 1.18 1.14 1.72 1.88 2.53 4.93 3.48 6 5.97 4.19 4-FEO 0.82 1.1 1.69 1.3 1.8 4.49 3.46 5.93 5.88 3.78 5-FEO 0.71 0.97 1.51 1.57 1.65 4.12 2.97 5.54 5.41 3.61