Mercury Determination in Muscle Tissue of Fish Samples
Using Microwave Digestion and CVAAS Analysis
Huseyin Altundaga,*, Tulay Kupelia, Esra Altintiga, Ali Imran Vaizogullarb, Ibrahim Kulab, Mustafa Tuzenc, and Mustafa Imamoglua
a Sakarya University, Faculty of Arts and Sciences, Department of Chemistry, 54187 Sakarya, Turkey b Mugla Sıtkı Kocman University, Faculty of Sciences, 48000 Mugla, Turkey
c Gaziosmanpasa University, Faculty of Arts and Sciences, Department of Chemistry, 60250 Tokat, Turkey
INTRODUCTION
Fish meat is widely consumed and considered a main source of nutrition in many coastal communi- ties (1). It contributes to a healthy diet by providing high-value amino acids and nutrients (vitamins and minerals) and is an excellent source of essential omega-3 fatty acids associated with many health bene- fits (2). Although highly nutritious, high consumption of some fish meat can have significant adverse effects on human health due to the bioaccumulation of heavy metals in fish muscles from the surrounding aquatic environment (3).
In recent years, the marine envi- ronment has been extensively cont- aminated as a result of human activities. The danger of heavy metals contamination is further increased because they are neither chemically nor biologically degrad- able and can remain for hundreds of years (4). Bioaccumulation of metals in fish has been widely investigated and several compre- hensive studies focus on metal toxi- city in fish (5 - 7). Mercury (Hg) is one of the most toxic elements in our environment including in the lithosphere, hydrosphere, atmos- phere, and biosphere (8). Humans get mercury from food, environ- mental and industrial endeavors, and via amalgam compounds. There are two major types of Hg classified as inorganic and organic mercury. Some microorganisms transform mercury into methyl
Corresponding author. E-mail: [email protected] Tel: +90 264 295 6059 Fax: +90 264 295 5950
mercury, which is then consumed by fish (9). Mercury can cause seri- ous problems in a variety of ways. Breathing in of mercury vapor damages the developing nervous system of the fetus. Mercury values can also rise to dangerous levels in people who work or live near mer- cury-related industries such as in mercury waste-containing areas and thermal power plants (10 - 14). The discharge of Hg has resulted in ele- vated levels in the air and various types of water bodies including rivers, lakes, and coastal waters, as well as in soils and sediments. Of particular concern to public health is the Hg in fish which is
consid-ered the most important vector linking environmental Hg to humans (15, 16).
There are a number of analytical methods available for the determi- nation of low concentrations of mercury. The most commonly used are cold vapor atomic absorp- tion spectrometry (CVAAS) and cold vapor atomic fluorescence spectrometry (CVAFS) (11, 17). Because of simplicity, higher sensi- tivity, less time, and relatively free from interference, CVAAS is the preferred method (10).
In this study, the levels of Hg were measured by CVAAS in 16 dif- ferent fish species caught in the waters of the Sakarya River, Cark Stream, Sapanca Lake, and Western Black Sea during September and October 2012. Several microwave (MW) digestion techniques were studied for the preparation of the fish samples. The accuracy of these methods was checked by the analy- sis of the certified reference mater- ial DORM-3 Fish Protein for Trace Metals (National Research Council Canada). The results were com- pared with studies reported in the literature and using the standard values published by the World Health Organization (WHO) and the U.S. Food and Agriculture Organization (FAO) .
EXPERIMENTAL Instrumentation
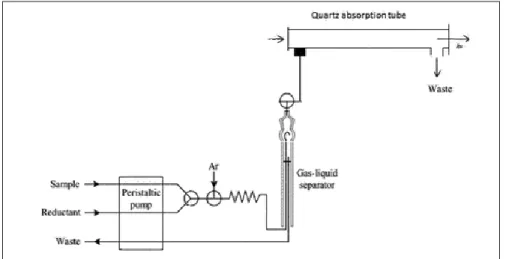
A GBC Avanta Σ cold vapor atomic absorption spectrometer (GBC Scientific Equipment Pty. Ltd., England) was used for this study (Figure 1). All measurements were carried out using high purity argon. A Hg hollow cathode lamp,
ABSTRACT
In this study, the mercury (Hg) levels in muscle tissue of 19 different fish species were deter- mined. The fish samples were collected from the Sakarya River, Sakarya Cark Stream, Sapanca Lake and the Western Black Sea, solubilized in a microwave diges- tion system and analyzed by cold vapor atomic absorption spec- trometry (CVAAS). The accuracy of the method was validated with certified reference material DORM-3 Fish Protein. Various analytical parameters were opti- mized. The relative standard devi- ation was found to be below 10%. The Hg levels ranged from
0.046 ± 0.07 µg g-1 to 0.755 ±
0.02 µg g-1. The Hg recoveries for
the external calibration standards and the known amounts of mer- cury added to the fish samples indicated minimal or no loss of Hg during microwave digestion.
operated at 3.0 mA, was utilized as the radiation source. The wave- length and slit width for Hg were 257.3 nm and 0.5 nm, respectively. The measurements were carried out in integrated absorbance (peak height) mode at 253.7 nm and using a spectral bandwidth of 0.5 nm. Argon 99.99% was the carrier gas.
Reagents and Standard Solutions
All reagents were of analytical grade. Double deionized water obtained with a Milli-Q™ system (Millipore Corporation, USA) was used for all dilutions (18.2 M cm−1
resistivity). Hydrochloric acid, nitric acid, sodium chloride, sodium hydroxide, and sodium tetrahydroborate were from Merck
(Darmstadt, Germany). Stock mer- cury standard solution was
prepared by diluting (1000 mg/L) with 3.0 M HCl solution for the determination of the mercury by CVAAS and some experimental parameters were optimized. The Hg(II) stock standard solution (1000 mg L-1) was prepared for the
calibration. NaBH4 solution was
used to form elemental Hg as the reducing agent with (0.8% w/v) NaOH.
Sample Preparation
19 samples were collected from fish species randomly caught in the Sakarya River, Cark Stream, Sapanca Lake, and the Western Black Sea (see Table I). The fish species anlyzed were: Silurus glanis, Blicca bjoerkna, Capoeta pestai, Cyprinus carpio, Scardinius ery- throphtholmus, Mugil cepholus, Barbus capito, Esox lucius, Tinca tinca, Trachurus mediterraneus, Sadra sarda, Mullus barbatus, Engraulis encrasicolus,
Fig. 1. Schematic of CVAAS system for mercury determination.
TABLE I
Fish Species and Area in Turkey Where Found
Sample Place Location Fish Species
Sapanca Lake Sapanca Esox lucius
Cyprinus carpio
Scardinius erythrophtholmus Tinca tinca
Sakarya River Sakarya Silurus glanis
Capoeta pestai
Pamukova Cyprinus carpio
Mugil cephalus Barbus capito
Cark Stream Sakarya Blicca bjoerkna
Mugil cepholus
Scardinius erythrophtholmus
West Black Sea Karasu Trachurus mediterraneus
Sadra sarda Mullus barbatu Engraulis encrasicolus Merlangius merlangus Belone belone Pamatomus saltarix
Merlangius merlangus, Belone belone, Pamatomus saltarix. The
scales and skin of the fish samples were separated, the viscera removed, the bones cleaned, and the flesh parts homogenized. These were then placed into polyethylene containers, kept in 1:10 nitric acid solution in order to prevent metals contamination, and stored at –20 °C. The homogenized muscle tissues were dried at 50 °C for 48 hours, then placed into a desiccator until they reached ambient temperature.
Microwave Digestion Procedure for Fish Samples
The dried samples were prepared for the microwave incineration process using a Milestone Ethos D microwave system (Sorisole-Bg Italy) with maximum pressure of 1450 psi and maximum tempera- ture of 300 °C. A 0.5 g sample was digested with 6 mL concentrated
Suprapur® HNO3 (65%) (Merck,
Darmstadt, Germany) and 2 mL 33
concentrated Suprapur® H2O2
(30%) (Merck) and diluted to 10 mL with double deionized water. A blank digest was carried out in the same way. The digestion conditions for the microwave system for the samples were applied (10-11) (see Table II). The microwave sample preparation method is preferred because it accelerates the
incinera-TAB;E II
Microwave Digestion Program
Step Power Ramp Ventilation
(W) (min) (min) 1 0 2 8 2 250 2 8 3 250 6 8 4 400 5 8 5 550 8 8 TABLE III
CRM DORM-3 Fish Protein Analysis Rresults (µg g-1), (N=4)
Hg Certified Value 0.382±0.060 Hg Found Value 0.355±0.056
Relative Error –7.06%
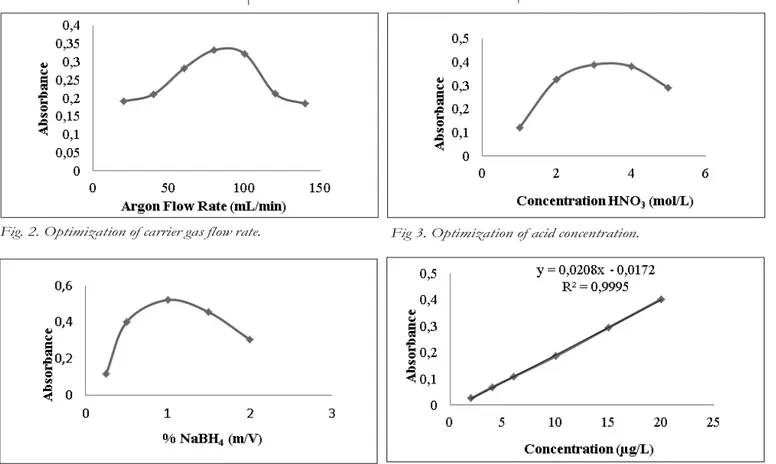
ues (see Table III). The influence of
tion process and decreases the con- the argon flow rate (Figure 2),
con-tamination level (18). After the incineration process, the samples were filtered and brought to 25-mL volume with pure double distilled Water.
The accuracy of the method was validated with certified reference material (CRM) DORM-3 Fish Pro- tein. Analysis of the CRM was car- ried out by dilution to linear range of the calibration curve. Table III shows that the results are in accor- dance with the certified values.
Optimization of Experimental Conditions
The variables were optimized for the simultaneous determination of Hg in the standards, the CRM, and different fish species. NaBH4 solu-
tion was used as the reducing mate- rial in order to form elemental Hg with 0.8% (w/v) NaOH. The analy- sis of the CRM was performed by diluting the linear range of the cali- bration curve. The results were in accordance with the certified
val-centration of HNO3 (Figure 3), and
sodium borohyride (Figure 4) on the signal of Hg were investigated.
Analytical Figures of Merit
The linear range of the calibra- tion curve reached the quantifica- tion limit up to 20 µg L−1 (see
Figure 5). The detection and quan- tification limits for Hg were calcu- lated by LOD=3σ and LOQ=10σ, respectively. The RSD values for the measurements were found to be less than 5.6% (N=5).
Fig. 2. Optimization of carrier gas flow rate. Fig 3. Optimization of acid concentration.
RESULTS AND DISCUSSION
Several countries have established limitations for allowable mercury levels in fish and generally vary between 0.5–1.0 µg g-1. While
determining these limitations, fish consumption and trade were con- sidered. The Turkish National Food Codex, WHO, and FAO advise the Hg levels not to be in excess of 0.5 µg g-1 (8–14).
The total Hg level in the fish samples and the % RSD found in this study are listed in Table IV. According to these results, the Hg levels of S. glanis were at 0.755 µg
g-1, while in all other fish samples
the level was 0.5 µg g-1 which is
acceptable in accordance with the FAO/WHO and the National Food Codex of Turkey regulations (18).
Many studies have been published regarding Hg levels in fish. However, to our knowledge
the present study is the first study for fish found in Turkey. In 2015, Doker and Basgelmez (9) devel- oped a simple and sensitive proce- dure in order to specify and extract Hg. Species separation was accom- plished with reverse phase-high performance liquid chromatogra- phy (HPLC) and hyphenated to inductively coupled plasma mass spectrometry (ICP-MS). They ana- lyzed six fish species from the Black Sea in Turkey and found Hg levels at 0.2 and 0.1 ng g-1. The dif-
ferences in Hg content in fish may arise from various factors such as species, gender, diet, habitat, and season (9). In 2009, Tüzen (10) performed a CVAAS method and reported mercury levels of 25 µg
kg-1 for S. sarda, and the highest
levels were found at 84 µg kg-1 for M. merlangus. Thus, these Hg lev-
els are below the 0.5 mg kg-1 level
as mandated by the Turkish Food Codex (11, 19).
In 2015, Fernandez et al. (4) ana- lyzed fish samples for the determi- nation of cadmium and lead by ICP-AES and mercury by CVAAS (4).
Eperesi et al. (20) specified Hg levels in tuna fish using microwave digestion and cold vapor AAS. The Hg levels found were 0.19±0.07 µg g-1 and 3.60±0.17 µg g-1, also
below the legal limits.
Pan et al. (16) reported that in fish in China Hg was present in 82% of the 54 different fish (within a total of 571 fish species) with levels at 30 ng g-1. They found that lower
Hg concentration levels are con- nected with feeding habits and trophic levels (16).
Voegborla and Akagi (21) identi- fied Hg levels between 0.004–0.122 µg g-1 in 13 of 56 fish samples from
the Atlantic coast region in Ghana. These values were lower than the limit of 0.5 µg g-1 as per WHO (22).
Squadrone et al. (23) examined
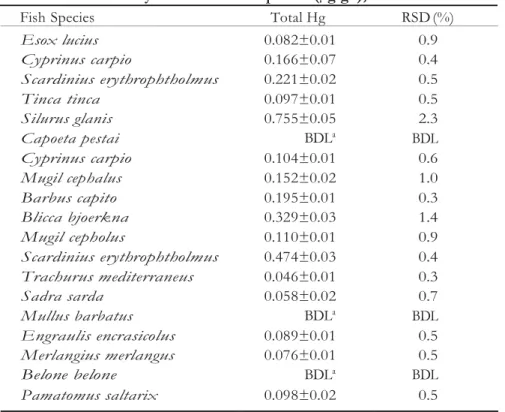
TABLE IV
Mercury Levels in Fish Species (µg g-1), N=4
Fish Species Total Hg RSD (%)
mercury and selenium accumula- tion in S. glanis found in the lakes
and rivers of Italy. The Hg levels in this fish were 1.4 mg kg-1. S. glanis
is the largest freshwater fish in Europe and is a favorite food owing to the boneless white flesh, also low in fat and highly palatable (22, 23).
This specie is also widely found in the rivers and lakes of Turkey and sold in supermarkets and other similar stores. In our study, the level of Hg in S. glanis from Turkey
was found at 0.755 µg g-1, while the
Hg levels in all other fish species were below 0.5 mg kg-1.
The variation of Hg concentra- tion in fish of the same species is mostly associated with the size (weight) of the fish. Larger fish usu- ally have higher concentrations than their smaller counterparts (24). We consider that as S. glanis
is bigger than the other fish and since it feeds on other small fish, the Hg level may be higher. 35 Vol. 38(1), Jan./Feb. 2017 Esox lucius 0.082±0.01 0.9 Cyprinus carpio 0.166±0.07 0.4 Scardinius erythrophtholmus 0.221±0.02 0.5 Tinca tinca 0.097±0.01 0.5 Silurus glanis 0.755±0.05 2.3 Capoeta pestai BDLa BDL Cyprinus carpio 0.104±0.01 0.6 Mugil cephalus 0.152±0.02 1.0 Barbus capito 0.195±0.01 0.3 Blicca bjoerkna 0.329±0.03 1.4 Mugil cepholus 0.110±0.01 0.9 Scardinius erythrophtholmus 0.474±0.03 0.4 Trachurus mediterraneus 0.046±0.01 0.3 Sadra sarda 0.058±0.02 0.7 Mullus barbatus BDLa BDL Engraulis encrasicolus 0.089±0.01 0.5 Merlangius merlangus 0.076±0.01 0.5 Belone belone BDLa BDL Pamatomus saltarix 0.098±0.02 0.5
CONCLUSION
In this study, the mercury level was determined in various fish sam- ples from the Sakarya River, Sakarya Cark Stream, Sapanca Lake, and the Black Sea. Microwave digestion was used to prepare the samples for analysis by cold vapor atomic absorption spectrometry (CVAAS). Quality control of the CVAAS method was performed with CRM DORM 3 Fish Protein, and good agreement was found between the certified values and the experimen- tal results. Several countries have set limitations for the allowable mercury levels in fish and vary
between 0.5–1.0 mg kg-1. WHO
advises the mercury levels not to exceed 0.5 mg kg-1. In this study,
the mercury levels of S. glanis har-
vested in Turkey were found to be below 0.5 mg kg-1 which is a posi-
tive result for the population in Turkey. Reducing the pollutant load in the region appears to be the best approach to decreasing the presence of heavy metals. Accord- ing to the data obtained and consid- ering the high fish consumption, the fish of this area of Turkey is not seen as a threat to public health.
ACKNOWLEDGMENT
This work was in part supported by Sakarya University Scientific Research Foundation with Project Number 50-01-034 and 2014-02-04-009.
Received February 18, 2016. REFERENCES
1. T. Kupeli, H. Altundag, and M. Imamoglu, The Scientific World Journal, Article ID 496107,1-7, http://dx.doi.org/10.1155/2014/49 6107 (2014).
2. J.L. Domingo, A. Bocio, G. Falcó, and J.M. Lobet, Toxicol. 230(2-3), 219 (2006).
3. M.I. Castro-González and M. Mén- dez-Armenta, Environm. Toxicol. and Pharmacol. 26(3), 263 (2008). 4. Z.H. Fernandez, L.A.V. Rojas, A.M.
Alvarez, J.R.E. Alvarez, J.A.S. Junior, I.P. Gonzalez, M.R. Gonza- lez, N.A. Macias, I.P. Sanchez, and D.H. Torres, Food Chem. 48, 37 (2015).
5. L. Järup, British Med. Bull. 68(1),
167(2003).
6. E. Has-Schon, I. Bogut, R. Vukovic, D. Galovic, A. Bogut, and J. Hor- vatic, Chemosph. 135, 289 (2015). 7. B. Jezierska and M. Witeska, Soil
Water Pollut. Monit. Protect. Reamed. 69, 107 (2006).
8. L. Carrasco, C. Barata, E. Garcia- Berthou, A. Tobias, J.M. Bayona, and S. Diez, Chemosph. 84, 1642 (2011).
9. S. Doker and I.L. Bosgelmez, Food Chem. 184, 147 (2015).
10. M. Tuzen, Food Chem.Toxicol. 47(8), 1785 (2009).
11. M. Ghaedi, M.R. Fathi, A. Shokrol- lahi, and F. Shajarat, Anal. Lett. 39(6), 1171 (2006).
12. M. Tuzen, I. Karaman, D. Citak, and M. Soylak, Food Chem. Toxi- col. 47(71648 (2009).
13. M. Tuzen and M. Soylak, Environ. Contam. Tox. 74(5), 968 (2005). 14. M. Tuzen, M. Soylak, and L. Elci, Anal. Chim. Acta 548(1-2),101 (2005).
15. P. Surmann and H. Zeyat, Anal. Biochem. 383(6), 1009 (2005). 16. K. Pan, K, H. Chan, Y.K. Tam, and
W. Wang, Environ Pollut. 185, 250 (2014).
17. J.C.A. Wuilloud, R.G. Wuilloud, M.F. Silva, R.A. Olsina, and L.D. Martinez, Spectrochim. Acta, Part B: At. Spectrosc. 57 (2), 365 (2002).
18. J. Usero, C. Izquierdo, J. Morillo, and I. Gracia, Environ. Int. 29, 949 (2003).
19. Turkish Food Codex. Regulation of setting maximum levels for certain contaminants in foodstuffs. Official Gazette 26879 (2008).
36
20. C.A. Eperesi, D.E. Nelson, and M.T. Stauffer, Spectrosc. Lett. 43(7), 597 (2010).
21. R.B. Voegborla and H. Akagi, Food Chem. 100, 853 (2007).
22. FAO/WHO. (2010). Joint FAO/ WHO expert consultation on the risks and benefits of fish consump- tion, Rome, Italy, 25-29 January 2010. EC:RBFC/2010/3. 23. S. Squadrone, A. Benedetto, P.
Brizio, M. Prearo, and M.C. Abete, Chemosphere 119, 24 (2015). 24. N.A. Panichev and S.E. Panicheva,