An Investigation on the Relationship Between Yield and Canopy
Components in Wheat (Triticum aestivum)
M. Muhip ÖZKAN1
M.Sait ADAK2 Zahide KOCABAŞ1 Geliş Tarihi: 04.12.2007 Kabul Tarihi: 10.06.2008
Abstract : The purpose of this study is to investigate to which extent yield components are related to
canopy components in Gerek-79 cv. of bread wheat. The data on biological yield, grain yield, 1000-grain weight, harvest index, fertile spikelet number, spike number, spike length and plant height were used. The canonical correlation analysis was fulfilled using the biological yield, grain yield, 1000-grain weight, fertile spikelet number and harvest index as the first set, called yield components, and spike number, spike length and plant height as the second set, called canopy components. The results of the canonical analysis showed that a high canonical correlation of 0.923 was achieved between yield and canopy components. The largest contribution to the first canonical variable for yield component was made by biological yield. The first canonical variable for the canopy component was most affected by spike length. The computed squared multiple correlation coefficients confirmed that the first canonical variable for canopy components had a substantial predictive power for biological yield (0.730) but much less for the other yield components. The squared multiple correlations also showed that the first canonical variable for yield components was a better predictor of canopy components, being 0.784 to predict plant height.
Key Words: Gerek-79, wheat cv., yield components, canopy components, canonical correlation, canonical
variables
Buğdayda (Triticum aestivum) Verim ve Vejetatif Bileşenler Arasındaki
İlişkinin Araştırılması
Öz : Bu çalışmanın amacı, ekmeklik buğday Gerek-79 cv’de ürün bileşenlerinin vejetatif bileşenler ile ne
kadar ilişkili olduğunun araştırılmasıdır. Bu çalışmada biyolojik verim, dane verimi, 100 dane ağırlığı, hasat indeksi, fertile başakçık sayısı, başak sayısı, başak uzunluğu ve bitki boyu verileri kullanılmıştır. Kanonik korelasyon analizinde, hasat indeksi, fertile başakçık sayısı, başak sayısı, başak uzunluğu ve bitki boyu vejetatif bileşenler setini, biyolojik verim, dane verimi ve 100 dane ağırlığı ise ürün bileşenleri setini oluşturmuştur. Vejetaitf ve ürün bileşenleri arasındaki en yüksek kanonik korelasyon katsayısı 0.923 olarak bulunmuştur. Ürün bileşenleri için oluşturulan birinci kanonik değişkene en büyük katkının biyolojik verim tarafından yapıldığı saptanmıştır. Vejetatif bileşenler için oluşturulan birinci kanonik değişkeninin oluşturulmasında ise en büyük katkı başak uzunluğu tarafından sağlanmıştır. Hesaplanan belirtme katsayıları, vejetatif bileşenler için oluşturulan birinci kanonik değişkenin, biyolojik verim için iyi bir tahmin edici olduğunu göstermiştir (0.730). Diğer taraftan ürün bileşenleri için oluşturulan birinci kanonik değişkenin, bitki boyu için daha iyi bir tahmin edici olduğu saptanmıştır (0.784).
Anahtar Kelimeler: Gerek-79, ekmeklik buğdayı, ürün bileşenleri, vejetatif bileşenler, kanonik korelasyon, kanonik değişkenler
Introduction
Wheat is an important cereal all over the world in terms of its production and consumption and has a vital contribution to the human diet as a staple because majority of people lack sources of other basic food. Because of its importance, agronomists are interested in having knowledge on the relationship among traits being investigated to achieve improvement in grain
yield. For this reason, there were many experiments carried out to investigate the fundamental basics of development and growth of wheat crop (Chaturvedi ve Gupta 1995, Kraljevic-Balalic ve ark. 1988, Triwari ve Rawat 1993). The number of effective spikes and the number of grains per spike were the main factors responsible for higher yield in durum wheat (Lin 1988).
1Ankara Üniv., Agricultural Fac. Biometry and Genetics Department-Ankara 2
The information given above was achieved calculating correlation coefficient or applying multiple regression analysis or path analysis to data. However, in most cases, these methods are not satisfactory due to the fact that they show the relationship between only two variables, or one dependent and a number of independent variables. But, it is preferable to know the relationship between two sets of variables. This is because the components taken into consideration are not too simple to define using only one or more than one variable. So, in such circumstances canonical correlation analysis should be used to identify the strength of association between two sets of variables.
In the literature, there are many studies in which canonical correlation analysis is used to identify the strength of association between morphological, chemical and physiological properties in plant sciences (Kesici ve ark. 1999). For example, canonical correlation analysis was used to determine predictive models for end-use quality of spring wheats through canonical analysis (Masood ve ark. 2007). Thenutrient concentration and agronomic data set variables were subjected to canonical correlation analysis to quantify the relationship between the two sets of variables and theirimpact on crop reaction to treatments (Walter ve ark. 2007).
Canonical correlation analysis was used to determine to what extent variation of biochemical components in wheat flours is responsible for the differences in bread-making quality (Lill-D-Van ve ark. 1995).
The possibilities of increasing wheat production were investigated using canonical correlation analysis for ecological factors and nutrient content variables (Bartos ve ark. 1991). The relationships of several morphological characters with yield and its components across the varieties were also inspected using canonical correlation analysis (Ledent 1982).
The purpose of this study is to investigate to which extent yield components are related to canopy components in Gerek-79 cv. of bread wheat by applying canonical correlation analysis.
Materials and Methods
In this study, the data collected from the experiment carried out in Research-Application Farm, Faculty of Agriculture, University of Ankara, in Haymana were used. The purpose of the experiment was to investigate the relationship between yield and canopy components in Gerek-79 that is an indigenous
bread wheat variety. The seed were sown on October 17, 2003. 60 kg/ha of P2O5 and 40 kg/ha of N were
applied at planting time. Then, 40 kg/ha of N was provided in early spring, just before shotting time. During the experiment, the crop was grown under optimal conditions, i.e., there were no water and nutrient deficiencies affecting the development and growth of the crop. The crop was harvested on July 25, 2004 when the full maturity was achieved. A 10 m2 of field was harvested for biological and grain yield. The spikelet from which grain was obtained was fertile spikelet per spike. 48 plants were sampled for data collection. In the experiment, the data on biological yield (BY, g / m2), grain yield (GY, g / m2), 1000-grain weight (TGW, g), harvest index (HI), fertile spikelet number (FSN, per spike), spike number (SN, m2), spike length (SL, cm) and plant height (PH, cm) were obtained, having 48 plants on each variable. The canonical correlation analysis was fulfilled using the BY, GY, TGW, FSN and HI as the first set, called yield components, and SN, SL and PH as the second set, called canopy components.
To investigate the relationship between yield and canopy components in Gerek-79 cv. of bread wheat, the canonical correlation analysis was performed.
Canonical correlation analysis is an extension of multiple regression analysis. Even though regression analysis focuses on an X-set including a number of explanatory variables and a Y-set containing only one response variable, canonical analysis deals with two sets of variables containing more than one variable. If the first group of p variables is represented by (px1) random vector of X and the second group of q variables is represented by (qx1) random vector of Y, the linear combinations for the first and the second sets can be constructed as U=a’X and V=b’Y, respectively. Where a' and b' are the canonical coefficients vectors.
Their variance - covariance matrix can be partitioned as
yy xy xy xxS
S
S
S
S
Therefore, the variances of the sets and the covariance between them are defined as;
Var(U)= a’Sxxa
Var(V)= b’Syy b
The canonical correlation coefficient between the linear combinations U and V can be expressed as:
b S b a S a b S a = V) r(U, yy ' xx ' xy '
The first pair of linear combinations is the first pair of canonical variables that maximizes the above-mentioned correlation coefficient (Johnson and Wichern, 2002).
For interpretation of the canonical variables, the correlation coefficients between the canonical variables and their original variables, which indicate the contribution of the original variables to their own canonical variables, are calculated.
The proportion of total standardized sample variance explained by the constructed canonical variables is also calculated to provide some information on how well the canonical variables symbolize their own sets (Mardia et al., 1979, Johnson and Wichern 2002). In application of canonical correlation analysis, SAS statistical package was used.
Results and Discussion
The mean and the standard error of mean of yield and canopy components, calculated from 48 plants, are given in Table 1.
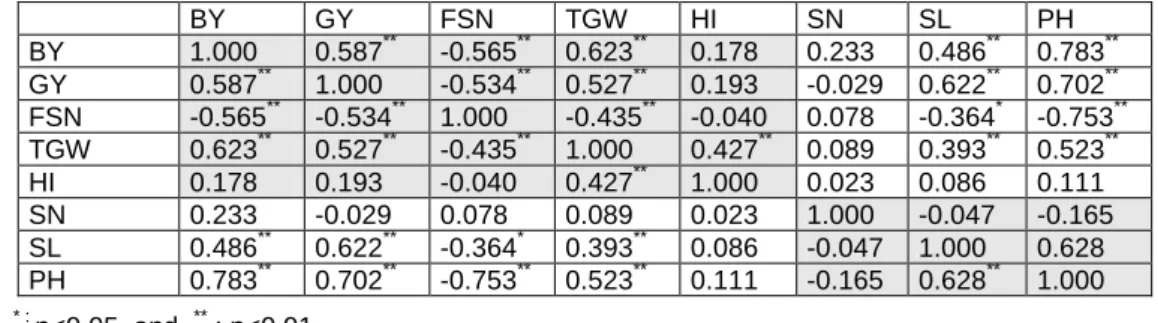
With regard to the correlations between the yield and canopy components, the largest correlation was accomplished between BY and PH, being 0.783 (Table 2). The results also indicated that there was a strong positive correlation between PH and GY (r=0.702) and a strong negative correlation between PH and FSN (r=-0.753).
GY was significantly correlated with BY and TGW that was in agree with reported of Sanjari (1993).
GY was significantly and positively correlated with PH and SL corroborated earlier work of Triwari ve Rawat (1993) but conflict with finding by Triwari ve Rawat (1993) where GY was significantly and positively correlated with FSN.
After calculating individual correlation coefficient between yield and canopy components, canonical correlation analysis was applied to the data. The results of the analysis showed that the first canonical correlation was 0.923, which appeared highly larger than any of between-set correlations presented in Table 2 due to the fact that canonical correlation analysis investigates the relationship between two sets of variables. In other words, yield components and canopy components are considered altogether. The results of hypotheses control indicated that the first canonical correlation was statistically significant (P<0.01) (Table 3).
The correlation coefficients among the yield and canopy components are displayed in Table 2.
Table 1. The mean (
X
) and standard error of mean (S
x) of yield and canopy components Yield and canopy componentsX
S
xBiological yield (g/m2) 1066.2937.904 Grain yield (g/m2) 246.627.757 Fertile spikelet number /spike 15.620.426 1000-grain weight (g) 32.740.557 Harvest index (%) 28.570.438 Spike number (m2) 779.3022.616 Spike length (cm) 7.340.097 Plant height (cm) 93.533.069
Table 2. The correlation coefficients among the yield and canopy components
BY GY FSN TGW HI SN SL PH BY 1.000 0.587** -0.565** 0.623** 0.178 0.233 0.486** 0.783** GY 0.587** 1.000 -0.534** 0.527** 0.193 -0.029 0.622** 0.702** FSN -0.565** -0.534** 1.000 -0.435** -0.040 0.078 -0.364* -0.753** TGW 0.623** 0.527** -0.435** 1.000 0.427** 0.089 0.393** 0.523** HI 0.178 0.193 -0.040 0.427** 1.000 0.023 0.086 0.111 SN 0.233 -0.029 0.078 0.089 0.023 1.000 -0.047 -0.165 SL 0.486** 0.622** -0.364* 0.393** 0.086 -0.047 1.000 0.628 PH 0.783** 0.702** -0.753** 0.523** 0.111 -0.165 0.628** 1.000 * : p<0.05 and ** : p<0.01
Table 3. Standardized canonical coefficients and canonical correlations (In table, CV: Canonical variable, CC: Canonical correlation)
CV Yield components CC CV Canopy components
BY GY FSN TGW HI SN SL PH V1 0.642 0.226 -0.349 -0.070 -0.014 0.923 ** U1 0.287 -0.035 1.029 V2 -0.685 1.229 0.517 0.248 -0.161 0.415 U2 -0.387 1.214 -0.708 V3 0.981 -0.081 1.125 0.118 -0.120 0.348 U3 0.895 0.429 -0.377 ** : p<0.01
The results of the analysis confirmed that the conclusion that there was a strong association between yield and canopy components can be drawn. As seen in Table 3, the second and third canonical variables were not worthy of consideration due to the insignificant canonical correlations between them. The standardized canonical coefficients were evaluated since the variables examined were not measured in the same units in Table 3.
The first pair of canonical variables, providing the largest (first) canonical correlation of 0.923, was; V1=0.642 BY+0.226 GY–0.349 FSN–0.070 TGW –0.014 HI
U1= 0.287 SN –0.035 SL + 1.029 PH
The standardized canonical coefficient in Table 3 indicated that the construction of the first canonical variable for yield components (V1) was most influenced
by BY, GY and FSN. This canonic variable is a weighed difference of BY and GY, and FSN, with more stress on BY. The coefficients for TGW and HI were near zero. Regarding the first canonical variable for canopy components (U1), it can be considered to be
the sum of SN and PH. The first canonical variable coefficients estimated also confirmed that an increment in the canopy components resulted in an increase in the BY and GY due to the fact that the coefficients had the same sign while there was a decrease in FSN.
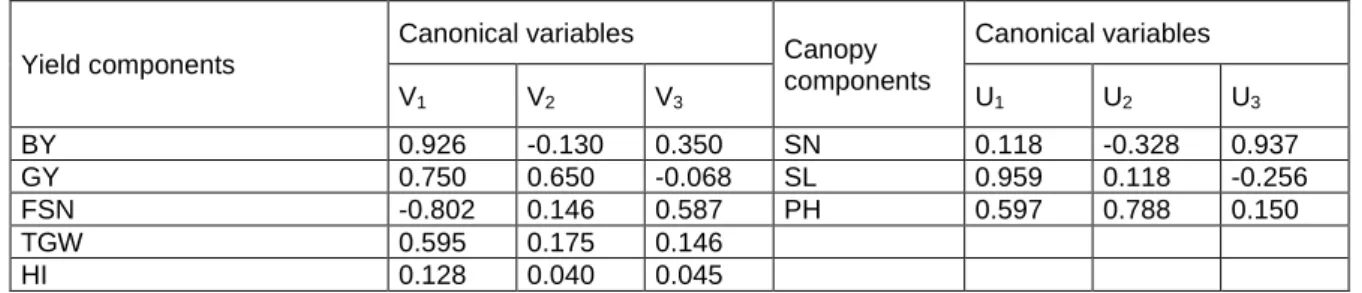
The canonical variables have no physical meaning. So, they can be interpreted computing the correlation coefficients between the canonical variables and their original variables. The correlation
coefficients between the yield components, canopy components and their canonical variables were computed and are given in Table 4.
The correlation coefficients given in Table 4 exhibited the contribution of the original variables to their own canonical variables. As shown in Table 4, the largest contribution to construction of the first canonical variable of yield components was made by biological yield (r=0.926). Regarding the canopy components, there was no certain canopy component affecting the construction of all the canonical variables. In other words, each canonical variable was influenced by different canopy component. As given in Table 4, the SL most influenced the construction of the first canonical variable.
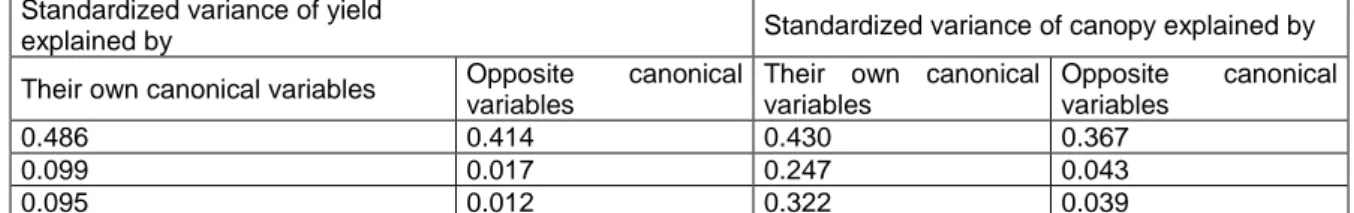
The proportion of total standardized sample variance explained by the canonical variables was also calculated by canonical redundancy analysis. The proportions of the standardized variance of the yield and canopy components explained by their own and opposite canonical variables are presented in Table 5.
The results showed that the first canonical variable of the yield component accounted for 48.60% of total standardized variance of yield components. However, the percentage of total standardized variance of yield components elucidated by the opposite canonical variable was 41.40%. Therefore, the first canonical variable for canopy components can be concluded as a good predictor of the opposite set of variables.
Table 4. The correlations between the canonical variables and their original variables
Yield components Canonical variables Canopy components Canonical variables V1 V2 V3 U1 U2 U3 BY 0.926 -0.130 0.350 SN 0.118 -0.328 0.937 GY 0.750 0.650 -0.068 SL 0.959 0.118 -0.256 FSN -0.802 0.146 0.587 PH 0.597 0.788 0.150 TGW 0.595 0.175 0.146 HI 0.128 0.040 0.045
Table 5. The proportions of total standardized variance of yield and canopy components explained by their own and opposite canonical variables
Standardized variance of yield
explained by Standardized variance of canopy explained by
Their own canonical variables Opposite canonical variables
Their own canonical variables Opposite canonical variables 0.486 0.414 0.430 0.367 0.099 0.017 0.247 0.043 0.095 0.012 0.322 0.039
The squared multiple correlation coefficients computed between the canonical variables for the canopy components confirmed that the first canonical variable for canopy components had a substantial predictive power for BY (0.730) but much less for the other yield components. The squared multiple correlations also showed that the first canonical variable for yield components was a better predictor of canopy components, being the largest squared multiple correlation of 0.784 to predict PH.
The calculated correlation coefficients showed that grain yield was significantly and positively correlated with biological yield, 1000-grain weight, spike length and plant height. These findings were in accordance with the results reported by Triwari and Rawat (1993). The grain yield was, however, significantly and negatively influenced by fertile spikelet number. Harvest index was positively and significantly correlated grain yield and 1000-grain weight. These findings were in accordance with the results reported by Chaturvedi and Gupta (1995).
The results of canonical correlation analysis showed that the yield components were strongly correlated with the canopy components because the first canonical correlation was statistically significant (Table 3). The largest contribution to the first canonical variable for yield component was made by biological yield. Meanwhile, the fertile spikelet number and grain yield also had an important contribution to this variable (Table 4). As also seen in Table 4, the first canonical variable for the canopy component was most affected by spike length.
The results also verified that TGW and HI in the first canonical variable for the yield components ad SL in the first canonical variable for the canopy components were suppressor variables (Table 3 and 4). This is because the signs for the canonical coefficients and for the correlations were different from each other. Therefore, it can be concluded that these variables acted as suppressor variables to enhance the correlation between BY and PH.
Conclusions
A researcher and/or producer wish to predict some variable using the other easily examined variables. For instance, researcher desires to investigate how yield components are affected by the canopy components or whether it would be possible to estimate biological and/or grain yield using the canopy components. In such cases, the interpretation of the squared multiple correlation coefficients are of importance for practical use (Kesici ve ark., 1999). The results obtained in this study emphasized that biological yield would be adequately predicted by the first canonical variable for the canopy components.
References
Bartos, A., A. Fekete and B. Sarvari. 1991. Study of ecological factors and nutrient content variables in wheat using canonical correlation analysis. Novenytermeles. 40 (2): 111-123.
Chaturvedi, R. K. and R.R. Gupta. 1995. Selection parameters for some grain and quality attributes in spring wheat (Triticum aestivum L.). Agricultural Science-Digest-Karnal. 15 (4): 186-190.
Johnson, R.A. and D.W. Wichern. 2002. Applied Multivariate Statistical Analysis. Fifth Edition. Prentice-Hall, Inc., New Jersey. 767 p.
Kesici, T., A.C. Yazıcı, Z. Kocabas ve S.Yücel. 1999. An Application of Canonical Correlation Analysis to Sugar Beet Data. Türk ve Alman Tarım ve Tabi Bilim Araştırıcıları Dernekleri, Türk-Alman Tarımsal Araştırma. 6. Sempozyumu, 27 Eylül-2 Ekim 1999, Justus-Liebig-Universität Gießen. Redaktion: Prof. Dr. Utrich Planck, Verlag Ulrich E. Grauer, Stuttgart, 2000.
Kraljevic-Balalic, M., S. Borojevic, T.E. Miller and R.M.D. Koebner. 1988. Inheritance of harvest index and related traits in wheat Proceedings of the seventh international wheat genetics symposium held at Cambridge: 547-550.13-19 July 1988. UK,
Ledent, J.F. 1982. Morphology and yield in winter wheat grown under in high yielding conditions. Crop Science. 22(6): 1115-1120.
Lill-D-VAN., J.L. Purchase, M.F.Smith, G.A. Agenbag, O.T Villiers, and D.L. Van. 1995. Multivariate Assesment of Environmental Effects on Hard Red Winter Wheat. II. Canonical Correlation and Canonical Variate Analysis of Yield, Biochemical and bread-making characteristics. South African Journal of Plant and Soil. 12 (4):164-169.
Lin, W.Z. 1988. Preliminary study on character correlation in durum wheat. Fujian-Agricultural-Science and Technology. No:5, 2-4.
Mardia, K.V., J.T. Kent and J.M. Bibby. 1979. Multivariate Analysis. Academic Press Inc. Ltd., London. 521 p.
Masood, S. Butt, N. Shahzadi, M.K.Sharif and M.Nasir. 2007. Canonical correlation: a multivariate technique to determine thecontribution of various dependent and independent variables, International Journal of Food Science and Technology 42: 1416–1423.
Sanjari, A.G. 1994. Study of the effect of the yield component on grain yield of wheat cultivars. Seed and Plant, 9 (1-2): 15-20.
SAS Institute Inc. 1987. SAS/STAT Guide for Personel Computers, Version 6 Edition. SASInstitute Inc., Cary, NC, USA.
Tiwari, V. N. and G.S. Rawat. 1993. Variability and correlation studies between grain yield and its components. Bhartiya-Krishi-Anusandhan-Patrika. 8 (1): 19-24.
Walter, E., L. Riedell, S.Osborne and A. A. Jaradat. 2007. Crop Mineral Nutrient and Yield Responses to Aphids or Barley Yellow Dwarf Virus in Spring Wheat and Oat, Crop Sci. 47:1553-1560.
Communication address:
Muhip ÖZKAN
Ankara Üniv., Agricultural Fac. Biometry and Genetics Department, 06110 Ankara/Turkey
Phone: 0 312 596 1492