Hacettepe Üniversitesi Eğitim Fakültesi Dergisi (H. U. Journal of Education) 34(2): 402-417 [2019] doi: 10.16986/HUJE.2018045408 [Araştırma Makalesi / Research Article]
The Measurement Invariance of University Students’ Ratings of
Instruction
Üniversitede Öğretimi Değerlendirme Puanlarının Ölçme Değişmezliği
İlker KALENDER*, Giray BERBEROĞLU** Received: 11.10.2017 Accepted: 25.09.2018 Published: 30.04.2019
Kaynakça Bilgisi: Kalender, İ., & Berberoğlu, G. (2019). Üniversitede öğretimi değerlendirme puanlarının ölçme
değişmezliği. Hacettepe Üniversitesi Eğitim Fakültesi Dergisi, 34(2), 402-417. doi: 10.16986/HUJE.2018045408
Citation Information: Kalender, İ., & Berberoğlu, G. (2019). The measurement invariance of university students’
ratings of instruction. Hacettepe University Journal of Education, 34(2), 402-417. doi: 10.16986/HUJE.2018045408
ABSTRACT: The invariance in the scores of student rating of instruction was studied across high and low achieving
classrooms. Achievement levels were determined by the two criteria such as self-reported expected grades and end of semester grades. The data included 625 classrooms. The equality of (i) factorial structure, (ii) factor loadings, (iii) item intercepts, and (iv) error variances of the 7 item rating scale were studied across these groups. With respect to self-reported expected grades, high and low achieving classes produced invariant scale characteristics except strict invariance. On the other hand, with respect to end of semester grades, full equality in item intercepts and error variances were not achieved. It seems that comparing the rating results across the classrooms and courses independent of the achievement levels of the students may be misleading especially for the high-stake decisions since the origin of the scale is not the same across high and low achieving groups.
Keywords: Student rating of instruction, invariance of student ratings, measurement equivalence, multi-group
confirmatory factor analysis, validity of student ratings
ÖZ: Bu çalışmada üniversite düzeyinde öğretimi değerlendirme anketi puanlarının üst ve alt başarı grupları
arasındaki ölçme değişmezliği incelenmiştir. Başarı düzeyleri öğrencilerin not beklentileri ve dersin sene sonu başarı ortalaması şeklinde iki ölçüt ile belirlenmiştir. Çalışmanın verisi 625 dersten oluşmaktadır. Yedi maddelik anketin (i) faktör yapısı, (ii) faktör yükleri, (iii) madde ortalamaları ve (iv) hata varyanslarının değişmezliği iki başarı grubu arasında analiz edilmiştir. Öğrencilerin not beklentilerine göre, üst ve alt başarı grupları hata varyanslarının değişmezliği dışında değişmez ölçek özellikleri görülmüştür. Diğer yandan, sene sonu notlarına göre yapılan inceleme sonucunda, madde ortalamaları ve hata varyanslarında tam değişmezlik gözlemlenmemiştir. Çalışma sonuçları öğretim elemanı değerlendirme puanlarının sınıflar ve dersler arasında başarı düzeylerinden bağımsız olarak karşılaştırılmasının yanıltıcı sonuçlar doğurabileceğini göstermektedir. Üst ve alt başarı gruplarının ölçek başlangıç noktaları farklı olduğu için bu durum özellikle ciddi kararlar alınması aşamalarında daha önem kazanmaktadır.
Anahtar Sözcükler: Öğretim elemanı değerlendirme anketi, puanların değişmezliği, ölçüm eşdeğerliği, çoklu grup
faktör analizi, öğretim elemanı değerlendirme puanlarının geçerliği
1. INTRODUCTION
Student rating of instruction is a widely accepted approach in academic settings to elicit students’ opinions regarding the instructional effectiveness. The use of student rating of instruction dates back to 1920s (Remmers, 1928). Until 1960s, ratings were basically used by instructors to collect students’ opinions about the effectiveness of teaching, rather than providing institutional feedback for academic promotion. Starting in 1970s, student ratings became a critical instrument in higher education institutions for both formative and summative
*
Asst. Prof. Dr., Ihsan Dogramaci Bilkent University, Graduate School of Education, Ankara-Turkey. e-mail: [email protected] (ORCID: 0000-0003-1282-4149)
**
assessment of instructors (Macfadyen et al., 2016; Morley, 2014). Although these ratings are basically used for monitoring instructional quality, they constitute an important source of information for high-stake decisions about the instructors such as promotion and granting tenure in the academic track (Ehie & Karathanos, 1994; Kulik, 2001; Nargundkar & Shrikhande, 2014). In either cases, the student ratings are used for important decisions which require reliable and valid measurement results. In other word, scores obtained on student rating should not be contaminated by some extraneous factors such as students’ expectations and achievement levels in a particular course. Thus, in the present study, validity of student ratings was examined from the perspective of measurement invariance across achievement levels.
1.1. Background
The student ratings are generally interpreted in the same way across different courses and achievement strata by assuming that the rating results have the same scale characteristics which are independent of these factors. Even though student ratings tend to be reliable, they might not be explaining aspects of instructional quality in a valid way (Benton, Duchon, & Pallett, 2013; Morley, 2014; Zhao & Gallant, 2012). Thus, the questions about the results of students’ ratings are rather a serious validity issue.
In general, it is suspected that students’ grades are somehow interfere with their ratings. The positive relationship between students’ expected and/or received grades and student ratings of instruction was reported in the literature (Harrison, Douglas, & Burdsal, 2004; Marsh & Roche, 1997; McKeachie, 1987; Maurer, 2006). The instructors can either receive high ratings from students by giving them high grades (Langbein, 2008; McPherson & Jewell, 2007) or students with low expected/received grades may discredit instructors with giving them lower ratings (Brockx, Spooren, & Mortelmans, 2011; Greenwald & Gillmore, 1997a; MacNell, Driscoll, & Hunt, 2015; Miles & House, 2015). On the other hand, instructors providing effective instruction may expect higher ratings from students (Marsh & Roche, 2000). Empirical studies provided contradictory results for these two situations. Some supported the relationships between easiness of the instruction and the rating results (Felton, Mitchell, & Stinson, 2004; Greenwald & Gillmore, 1997a), on the other hand some other studies reported correlation between learning and student ratings (Grammatikopoulos et. al., 2015).
If student ratings are influenced by students’ grades and expected achievement level, the scores reflect construct-irrelevant variance beside the instructional quality (Benton & Cashin 2012; Messick, 1989; Zhao & Gallant, 2012). Thus, evaluating the rating results without considering students’ achievement level creates a serious validity problem. Technically, for different achievement strata the rating results could produce different metrics which are not directly comparable. This is rather a problem of the invariance of the scale characteristics across different groups of students which is a requirement for a valid interpretation of the measurement results (Dimitrov, 2010). It can be achieved if the scale has the ability to measure identical constructs with the same structure across different groups (Schoot, Lugtig, & Hox, 2012). Thus, within this framework the instrument should function in the same way across the groups and the construct has the same meaning for the students who belong to different groups (Dimitrov, 2010). In other words, the weakness in invariance means that the observed ratings, which have the same true score across the groups, are not equal to each other (Meredith & Millsap, 1992).
Among various methodologies, multi-group confirmatory factor analysis that involves checking the equality of (i) factorial structure, (ii) factor loadings, (iii) item intercepts, and (iv) error variances across different groups can be considered as evidence for invariance (Byrne, 2004; Jöreskog, 1971). In this particular method, equivalence of factorial structure indicates that the relationships between items and latent variables are the same (items are grouped in the same factors in all groups), but strengths of these relationships may vary across groups. Equality of
factor scores when equivalency of factor loadings holds (Wu, Li, & Zumbo, 2007). If equality of item intercepts is not achieved in the scores, differences in the intercepts create scores on different metrics for the same behavior of the same instructor or course across the groups (Baas, De Dreu, & Nijstad, 2011). Only when strong invariance holds between different groups, ratings provided by students become group independent and reflect students’ true scores regarding instructional effectiveness (Wilberg, 2007). Finally, strict invariance indicates that whether student ratings function with different reliability levels across groups (Vandenberg & Lance, 2000). These four requirements are named as configural, weak, strong, and strict invariance levels, respectively (Wu, Li, & Zumbo, 2007).
The lack of invariance on student ratings of instruction between different learning levels may have some implications depending on the level of invariance. For instance, student ratings suffering from the lack of configural and weak invariance may hinder the interpretation of the scores across different groups, since the item contents are interpreted differently by the students who belong to different groups. Configural invariance provides evidence of similar conceptualization of instructional effectiveness, while weak invariance indicates students in all groups give the same level of importance for each item. Thus, within-group differences can be compared but direct comparison between groups is not possible since scales are not the same. Strong invariance is an indicator of the fact that the same standards are held by student in different groups (van de Vijver & Tanzer, 2004; Vandenberg & Lance, 2000). A student will give the same ratings for the same instructional performance, regardless of his or her group. Equivalence in the item intercepts allows researchers to compare observed rating scores and factor means without favoring any group to be compared. Invariant error variances indicate that scores from different groups can be compared with equal precision level (Lubke et al., 2003). Thus, degree of invariance for different learning groups is expected to yield information about the fairness of the student rating of instruction.
In evaluating the student ratings results, testing the measurement invariance is often neglected and as a consequence, any decision based on rating results may likely arise the question of fairness including instructor’s rankings of academic performance (Wolbring, 2012). On the other hand, complete invariance provides evidence that students rated the instruction independent of their achievement level (Schmitt & Kuljanin, 2008; van de Vijver & Tanzer, 2004; Wu, Li, & Zumbo, 2007).
Thus, the purpose of the present study is to examine the invariance levels of student ratings of instruction across groups which are defined with respect to two criteria such as students' expected grades and their end of semester grades through four levels of invariance requirements such as, configural, weak, strong, and strict. Despite the various correlational research studies in the literature, no specific study about the invariance properties of the student ratings of instruction was carried out before. Whereas the degree of invariance for different learning groups is expected to yield information about the fairness of the student ratings of instruction. Moreover, the results of the study will provide evidence to deal with the actual mean differences across the groups defined by different levels of achievement.
2. METHOD
2.1. SampleThe data were collected in a private university in Turkey. There are approximately 13000 students in the university both in undergraduate and graduate levels. Student ratings are collected for each class at the end of each semester before the final grades are given. Total 49099 forms which were filled out in 2119 classes were used in the present study.
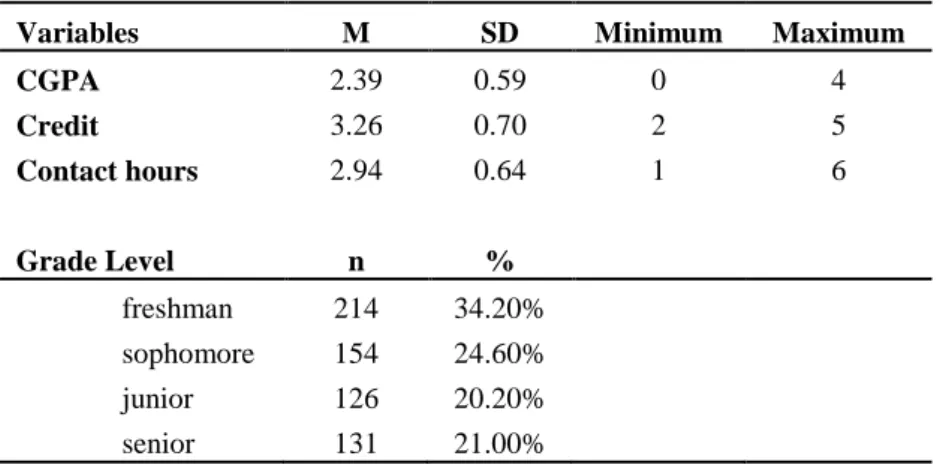
In the data set, within the same course or classroom there could be dependence among the students’ rating results which may create inflated Type I error rate in the statistical analyses. In order to avoid inflation in the Type I error rate, the means obtained in the item level for each classroom were used as the unit of analysis. Although using aggregated data are reported to have both advantages and disadvantages, class-level data were used in this study since principal use of students is mainly at that level rather than student-level. Decisions, high-stake or not, regarding courses and instructors were made based on aggregated student ratings at class level. A random sample of 625 classrooms with total 9230 students were used in the data analysis. Descriptive of classes were given in the Table 1 below.
Table 1: Descriptives of class-related variables
Variables M SD Minimum Maximum
CGPA 2.39 0.59 0 4 Credit 3.26 0.70 2 5 Contact hours 2.94 0.64 1 6 Grade Level n % freshman 214 34.20% sophomore 154 24.60% junior 126 20.20% senior 131 21.00% 2.2. Instrument
The student rating of instruction scale used in the university was developed by the rector’s office for the purpose of evaluating instructional performance. The students are required to fill out the scale about the effectiveness of the instruction at the end of the semester. It is used in providing feedback to the instructors and promoting the academics in the respective academic programs. The items in the scale were selected from a domain of item pool reflecting various aspects of the instruction. The item pool included the items of various rating scales used before for the research purposes as well as for evaluating the instructional effectiveness by other higher education institutions. This scale has been used by the university for many years and routine analyses by the rector’s office is carried out after each administration. Ethics Committee of the university granted permission for use of student ratings after excluding all information that could be used to identify courses and/or instructors.
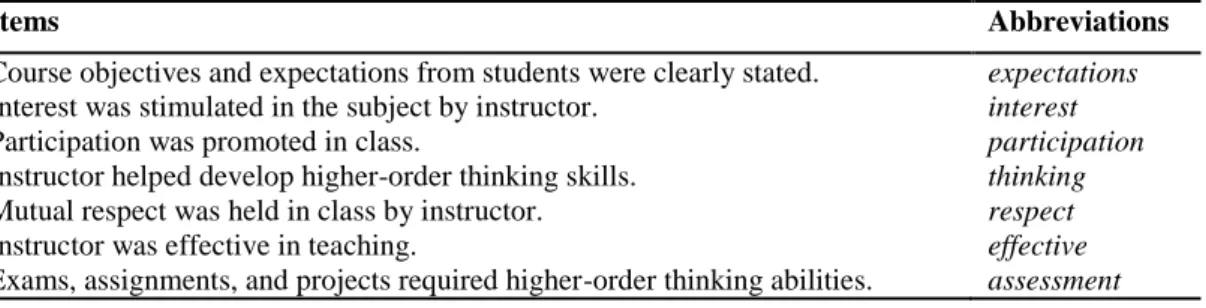
There are 9 items in the rating scale. Among them, one item was related to the frequency of using English in the classroom since the language of the instruction is in English in this particular university. Another item was about the frequency of canceling the class during the semester. Obviously, these two items were not compatible with the rest of the scale and did not reflect the instructional effectiveness per se. Furthermore, a preliminary exploratory factor analysis indicted that these two items were grouped into a separate factor. Thus, the seven items given in Table 2 were used in the analyses. The items were rated on the Likert type agreement scale such as strongly disagree (1), disagree (2), neutral (3), agree (4), and strongly agree (5). The scale scores have the Cronbach’s alpha reliability of .97 in the whole group.
Table 2: Items in the student ratings form with their abbreviations
Items Abbreviations
Course objectives and expectations from students were clearly stated. expectations Interest was stimulated in the subject by instructor. interest
Participation was promoted in class. participation
Instructor helped develop higher-order thinking skills. thinking Mutual respect was held in class by instructor. respect
Instructor was effective in teaching. effective
Exams, assignments, and projects required higher-order thinking abilities. assessment
As is seen from the Table 2 the items of the scale reflect clearness of instructional objectives, instructor’s efforts in promoting student-centered instructional activities, instructor-student’s relationships and emphasize on promoting higher-order thinking skills in the classroom and evaluation processes.
2.2. Groups Defined by Learning
In the present study two criteria were used for the levels of achievement. The first criterion is the students’ perception about their learning level. This was assessed by students’ agreement with the statement “I learned a lot in this course” which is used in the student ratings of instruction scale.
Based on the 33rd and 66th percentile scores, three groups were defined following suggestions made by Gelman and Park (2008). The bottom and the top groups were selected for this study to define low and high achieving groups. Three hundred and eight classrooms with the means below the 33rd percentile score were named as low achieving and 317 classrooms with means above the 66th percentile score were named as high achieving classrooms.
The second criterion is the students’ end of semester grades. In the university, a criterion referenced scoring is used over 4.00. Similarly, 33rd and 66th percentile scores were used to divide the group into two. Two hundred sixty-seven classrooms which were above the 66th percentile scores were named as high achieving classrooms and 358 classrooms which were below the 33rd percentile score were named as low achieving classrooms.
The reason of using two learning indicators in the present study is the inconclusive results reported in the literature. Some researchers argued that self-reported variables are free from the contamination due to grading leniency (Cruse, 1987; Machina, 1987; Sailor, Worthen, & Shin, 1997). On the other hand, Grimes (2002) and Kennedy, Lawton, and Plumlee (2002) argued that students’ learning level may not be effectively assessed by self-reported technique due to the inability of students to effectively assess their own learning. Pollio and Beck (2000) claimed that there is no evidence supporting the relationship between grades and learning but some other researchers reported a significant relationship between student ratings of instruction and students’ perception of success (Clayson, 2009). No matter which achievement criterion was considered, in general the correlations between students ratings and achievement measures were reported from low to moderate in previous research studies (Bowman, 2010; Cole & Gonyea, 2010; Pascarella, Seifert, & Blaich, 2010).
In the present study, the correlation coefficient between end of semester grades and self-reported learning scores is small but significant (.189; p<.001). Also, almost 50% of the classrooms were differently grouped with respect to two criteria. As a result, the researchers decided to analyze the invariance of ratings with respect to these two criteria.
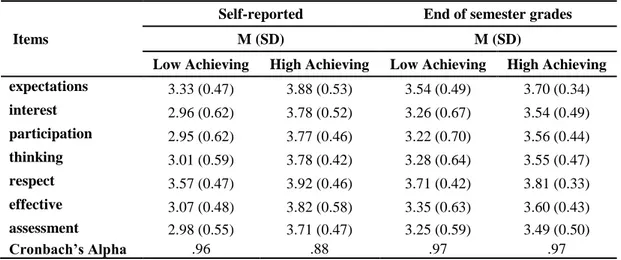
Table 3 indicates the mean and standard deviation of the items used in the invariance analysis across two grouping criteria.
Table 3: Mean and standard deviations of student ratings for the grouping variables
Items
Self-reported End of semester grades
M (SD) M (SD)
Low Achieving High Achieving Low Achieving High Achieving
expectations 3.33 (0.47) 3.88 (0.53) 3.54 (0.49) 3.70 (0.34) interest 2.96 (0.62) 3.78 (0.52) 3.26 (0.67) 3.54 (0.49) participation 2.95 (0.62) 3.77 (0.46) 3.22 (0.70) 3.56 (0.44) thinking 3.01 (0.59) 3.78 (0.42) 3.28 (0.64) 3.55 (0.47) respect 3.57 (0.47) 3.92 (0.46) 3.71 (0.42) 3.81 (0.33) effective 3.07 (0.48) 3.82 (0.58) 3.35 (0.63) 3.60 (0.43) assessment 2.98 (0.55) 3.71 (0.47) 3.25 (0.59) 3.49 (0.50) Cronbach’s Alpha .96 .88 .97 .97
As is seen in Table 3 there are differences in the means of the items across the groups compared. High achieving groups have statistically higher means in all items (p < .05).
2.3. A Priori Analyses
Before carrying out the invariance analyses, the multivariate normality was tested in the data set. The test conducted by Lisrel 8.54 (Jöreskog & Sörbom, 1996) indicated significant departures from normality in each of the four groups (χ2
Low achieving=441.30, p<.001, χ2high achieving=4622.35, p<.001 for self-reported learning, and χ
2
low achieving=1330.76, p<.001, χ 2
high achieving=1054.77, p<.001 for end of semester grades). Since the assumption of multivariate normality was violated in the data set, for the assessment of goodness of fit, Satorra-Bentler χ2 (S-Bχ2), a scaled Chi-square statistic for non-normality, was used in the confirmatory factor analyses (Bryant & Satorra, 2012; Satorra & Bentler, 1988; Satorra & Bentler, 2001). Parameters were estimated by Robust Maximum Likelihood method (Finney & DiStefano, 2006). The other goodness-of-fit indexes were also used in the analyses with the fit criteria of below .05 for Robust Root Mean Square Error of Approximation (RMSEA) and Standardized Root Mean Square Residual (SRMR) and above .90 for Robust Comparative Fit Index (CFI), Goodness-of-Fit (GFI), and Non-normed fit index (NNFI) (Hu & Bentler, 1999).
The confirmatory factor analysis was carried out to test if there was a unidimensional trait being measured in 7-item scale. S-Bχ2 was found to be statistically significant (S-Bχ2(14)=49.75, p<.001), as expected due to its sensitivity to sample size. In this very first analysis other estimated fit indexes were .05 for RMSEA with the confidence band of [90%CI=.04;.08], .01 for SRMR, .99 for CFI, .95 for GFI, and .98 for NNFI. All factor loadings of the seven items were in between .81 and .96 and they were significant at .05 level. Taken together, these findings illustrate that the seven-item scale seemed to measure a unidimensional construct.
The last a priori analysis was testing the equality of covariance matrices across the groups. (Jöreskog, 1971; Vandenberg & Lance, 2000). This is a test of the null hypothesis that covariance matrices are invariant across groups on which invariance analyses are conducted. If the hypothesis is rejected, the groups are non-equivalent with respect to the covariance matrices which makes the invariance analysis justifiable. In this analysis the significant results were obtained for both comparisons: F(28, 1143932.521)=279.357, p<.001 for the end of semester grades, and F(28, 1350140.913)= 1087.833, p<.001 for the self-reported learning. The analyses indicated that the covariance matrices were not equivalent across the groups. This result justifies the further invariance analyses in the data set.
2.4. Invariance Analyses
Before studying the invariance, the unidimensional baseline model was tested across the groups constituted by two learning criteria. Then multiple-group confirmatory factor analysis was employed as the method of assessment of invariance (Byrne, 2004; Byrne, Shavelson, & Muthen, 1989). In this analysis the nested models are hierarchically compared by conducting a series of sequential hypothesis testing. Since there is non-normality in the data set, parameters were again estimated by the use of Robust Maximum Likelihood estimation with S-Bχ2 scaling method. Analyses were carried out using Lisrel 8.54 (Jöreskog & Sörbom, 1996).
Analyses started with a baseline model including no constraint about invariance across groups and proceed with increasingly restrictive constraints on the baseline model. If new constraint produced a poorer fit as indicated by a significant change in S-Bχ2 between two models, then new invariance level was said not to be held. Thus, a non-significant change in S-Bχ2 between two consecutive invariance levels justified the existence of invariance between two consecutive models. The measurement invariance was studied through the following steps: invariance of (i) factor patterns (configural), (ii) factor loadings (weak), (iii) intercepts (strong), and (iv) variances of residuals of observed variables (strict) (Dimitrov, 2010; Meredith, 1993; Schmitt & Kuljanin, 2008; Schoot, Lugtig, & Hox, 2012; Vandenberg & Lance, 2000; Wu, Li, & Zumbo, 2007). Configural invariance was checked by hypothesizing a baseline model which fits into all groups with no constraint in factor loadings and intercepts. All parameters were free to vary. Then factor loadings were fixed across groups for testing weak invariance. For setting the metric of the latent variable the loading of one of the items was fixed to 1 (Stark, Chernyshenko, & Drasgow, 2006). This item was selected through an iterative approach. The item which demonstrated the least invariance was selected and fixed to 1. For strong or scalar invariance, a new set of constraints into the model was added to fix item intercepts across groups. One of the factor intercepts was fixed to zero again for identification purposes. And finally, strict invariance was tested by fixing error variances across groups. When invariance is not observed at any level, partial invariance was sought for by freeing 20% of the fixed parameters at a respective invariance level (Byrne, Shavelson, & Muthén, 1989; Levine et al., 2003). As suggested by Byrne (2010) in order to determine the non-invariant items all factor loadings were tested separately. Modification indexes which could produce changes of magnitude .20 or greater based on estimations by Lisrel were also considered.
In the following hierarchical invariance analyses only S-Bχ2 difference test was interpreted to determine if invariance holds at a specific level. Beside S-Bχ2 difference test, some other fit indexes were also considered to assess goodness-of-fit of the invariance models. These indexes were RMSEA, SRMR, CFI, GFI and NNFI. Criteria were the same as in the confirmatory factor analysis.
3. FINDINGS
3.1. Baseline ModelFigure 1. Path diagram of the model tested
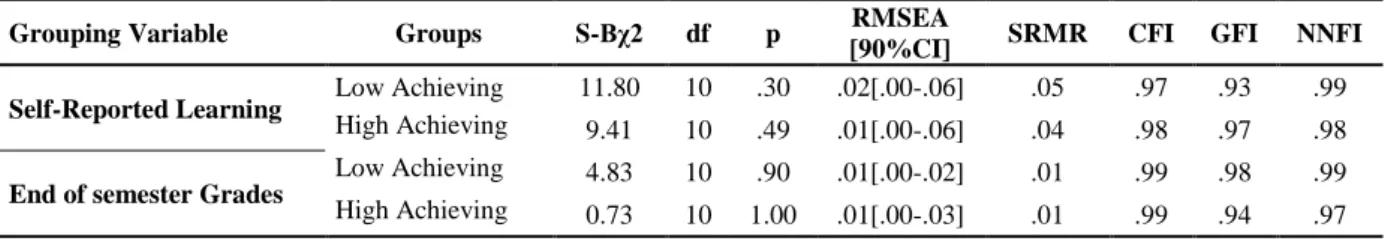
Table 4 indicates the fit statistics of the one dimensional models with seven observed variables. No additional modification was made in the models such as adding a covariance between items or freeing item error variances. As it is evidenced by the indexes, the one-dimensional model gave fit in all the groups compared.
Table 4: Fit indexes for the baseline model in subgroups
Grouping Variable Groups S-Bχ2 df p RMSEA
[90%CI] SRMR CFI GFI NNFI
Self-Reported Learning Low Achieving 11.80 10 .30 .02[.00-.06] .05 .97 .93 .99
High Achieving 9.41 10 .49 .01[.00-.06] .04 .98 .97 .98
End of semester Grades
Low Achieving 4.83 10 .90 .01[.00-.02] .01 .99 .98 .99 High Achieving 0.73 10 1.00 .01[.00-.03] .01 .99 .94 .97
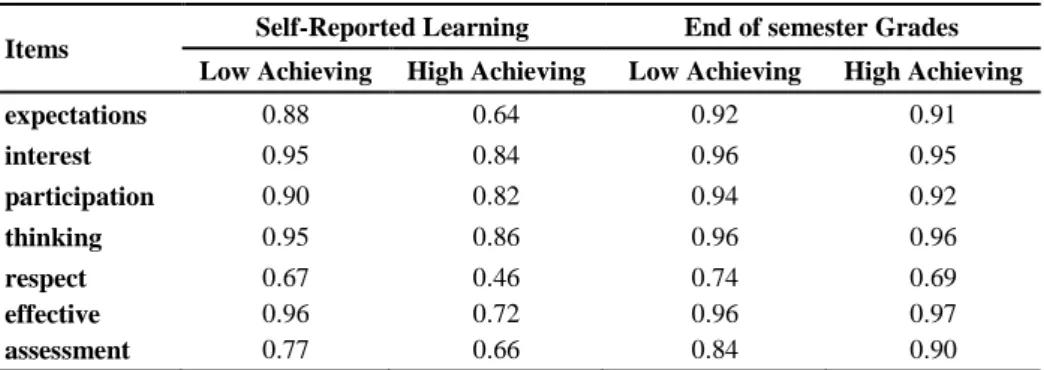
Table 5 presents the standardized factor loadings estimated by LISREL. All factor loadings were significant at .05 Alpha level.
Table 5: Standardized factor loadings for the baseline model in subgroups
Items Self-Reported Learning End of semester Grades
Low Achieving High Achieving Low Achieving High Achieving
expectations 0.88 0.64 0.92 0.91 interest 0.95 0.84 0.96 0.95 participation 0.90 0.82 0.94 0.92 thinking 0.95 0.86 0.96 0.96 respect 0.67 0.46 0.74 0.69 effective 0.96 0.72 0.96 0.97 assessment 0.77 0.66 0.84 0.90
The factor loadings were higher for the learner groups defined by end of semester grades. Furthermore, it was observed that the factor loadings for low achieving students based on self-reported learning criterion were higher than high achieving students.
3.2. Invariance Analysis for Self-Reported Learning Level
Table 6 presents the results of invariance test and fit indexes for the groups constituted with respect to self-reported achievement criterion.
Table 6: Fit indexes for invariance analyses for self-reported learning
Invariance
Model S-Bχ2 df p ΔS-Bχ2 Δdf p
RMSEA
[90% CI] SRMR CFI GFI NNFI
Configural 9.48 28 .99 - - - .00[.00;.02] .04 .98 .94 .97
Weak 17.46 34 .99 6.52 6 .37 .00[.00;.01] .03 .94 .87 .96
Strong 18.60 40 1.00 10.54 6 .99 .00[.00;.02] .04 .96 .88 .96
Non-significant value for S-Bχ2 index provides supporting evidence for configural invariance. Also goodness-of-fit indexes confirmed the fit between model and the data. As was explained before in the second level of invariance, a new constraint was added into the model to fix the factor loadings across the groups. The S-Bχ2 difference test result indicated that the weak invariance was also confirmed in the model. In the consecutive two steps, the item intercepts and error variances were fixed in the model. As is seen by the S-Bχ2, test result and fit indexes strong invariance was also observed. However, the model for strict invariance did not produce acceptable fit indexes (RMSEA=.11 [90%CI=.04;.08], SRMR=.10, CFI=0.86, GFI=.87, and NNFI=.88). Thus, the two learner groups defined by self-reported learning can directly be compared, but not with the same reliability level.
3.3. Invariance Analysis for End of Semester Grades
Table 7 presents the results of invariance test and fit indexes for the groups constituted with respect to end of semester grades achievement criterion.
Table 7: Fit indexes for invariance analyses for end of semester grades
Invariance
Model S-Bχ2 df p ΔS-Bχ2 Δdf p
RMSEA
[90% CI] SRMR CFI GFI NNFI
Configural 30.73 28 .32 - - .02[.00;.05] .02 .99 .92 .98
Weak 45.43 34 .09 14.70 6 <.001 .03[.00;.06] .03 .98 .90 .98
Weak-P1 35.01 33 .37 4.28 5 .40 .01[.00;.05] .02 .99 .92 .98
Strong 47.78 39 .02 12.77 6 <.001 .03[.00;.05] .03 .98 .92 .98
1
Configural invariance level was achieved with respect to S-Bχ2 difference test. Goodness-of-fit indexes indicated that one-dimensional factor structure was found to be invariant across learner groups. On the other hand, weak invariance was not fully observed. Freeing the factor loading of the item assessment provided a partial weak invariance. However, item intercepts were not invariant, as evidenced by significant S-Bχ2 changes after new constraints were added even though goodness-of-fit indexes indicated a good fit. Freeing some parameters did not yield an improvement in the fit of model imposing strong invariance. Equality of error variances was not checked since factor intercepts were variant.
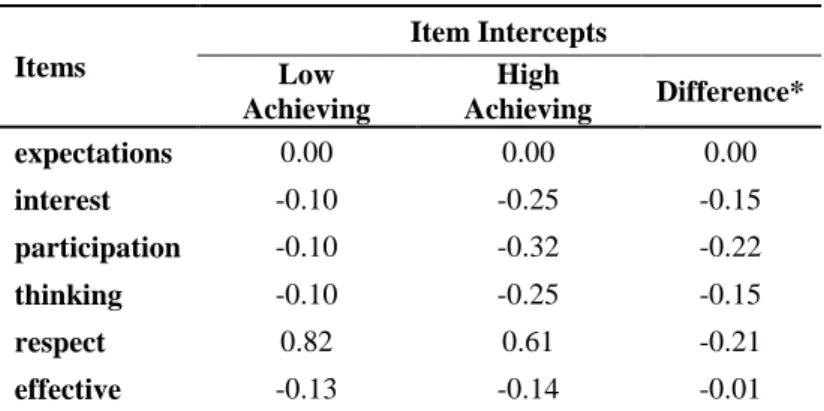
In Table 8 item intercept differences between high and low achieving groups are presented.
Table 8: Item intercepts differences based on end-of-semester grades
Items Item Intercepts Low Achieving High Achieving Difference* expectations 0.00 0.00 0.00 interest -0.10 -0.25 -0.15 participation -0.10 -0.32 -0.22 thinking -0.10 -0.25 -0.15 respect 0.82 0.61 -0.21 effective -0.13 -0.14 -0.01
* The intercept of the item assessment was not calculated since it was freed.
As is seen from Table 8 all the items in the high achieving group had lower intercept except item assessment. In this particular analysis only the configural invariance was fully achieved where the unidimensional factor structure can be defensible across high and low achieving groups, while weak invariance was observed after the item assessment was removed. The differences in the intercept imply that the origin of the scale across the two groups compared are different in favor of low achieving students.
4. DISCUSSION and RESULTS
Test scores which are invariant across different groups of students is one of the most important requirements for validity. In the student rating of instruction, achievement level of students is the extraneous variable that may invalidate the results since there is a general belief that higher scorers may rate the instruction in a more positive way (Brockx, Spooren, & Mortelmans, 2011; Marsh & Roche, 2000).
In practice, when rating results are used without justifying the invariance, the scores of ratings could be biased against instructors or classes. Within invariance framework, the instrument should function in the same way across the groups and the construct has the same meaning for the subjects who belong to different groups (Dimitrov, 2010). The weakness in invariance can depict itself as non-equivalent metrics across the instructors or courses where observed score differences can not correspond to the same true score differences (Meredith & Millsap, 1992). Thus, any interpretation depending on observed scores could be favoring some instructors or classrooms depending on the level of invariance achieved in the scale scores.
In the present study, with respect to self-reported expected grades and end of semester grades, the means of observed scores in the item level are higher for the groups expecting high scores and receiving higher end of semester grades. Interestingly, the mean differences observed between two groups are greater for the self-reported expected grades than the end of semester
grades. On the other hand, the invariance analyses carried out with respect to self-reported expected grades proved that the scale has strong invariance characteristics regardless of the level of expected grades. Only the strict invariance was not achieved where the amount of errors are different across groups expecting high and low scores. Thus, with respect to self-reported expected grades, any difference in the observed scores across groups expecting high and low scores are true differences. This means that as students expect to get higher grades in the course they tend to rate the instructor relatively in a more positive way. This could be a problem if students take courses with some contemplation about the leniency in grading. High score expectation will cause students rate the instruction in a more positive way. In the institutional context, if the rating results are primarily used for instructional evaluation or promotion, there will be bias in rating results in favor of instructors who have lenient grading policy. From administrative point of view, there is a need to have some precautions especially if the results are basically used for instructors’ promotion. In practice, students expected grades can be statistically controlled over the rating scores in order to remove this unintended effect in the rating results.
For the end of semester grades the situation is quite different. In this particular analysis, only the configural invariance was fully achieved in the scale. This means that high and low scorers have a unidimensional conception of the instructional effectiveness as articulated in the items’ content. However, the lack of complete weak invariance implies that the comparison across the groups may be problematic if all the items are considered. The item assessment creates the problem in this level. Removing this item solves the problem in weak invariance. Moreover, in this analysis, having no strong invariance clearly indicates that the scale metrics are different across high and low achievers. In the present study, the intercepts in the high achieving classrooms are lower than the low achieving classrooms, except for the item assessment. Differences in intercepts across different groups indicate that for the same instructor or classroom practice different achievement groups may have different perceptions and as a consequence of it, the ratings of these groups are different (Baas, De Dreu, & Nijstad, 2011). In other words, the same degree of instructional effectiveness is rated differently by the students from two scoring groups. Low achieving students rated the same instructional performance more positively than the high achievers. It seems that the scores across these two groups produce biased results in favor of the low scorers. On the contrary, high achieving groups with lower intercepts are not as generous as the low achieving groups in their ratings with the exception of the item assessment. Thus, the observed mean difference found across different scorer groups do not indicate true difference (Nimmer & Stone, 1991; Rodabaugh & Kravitz, 1994; Sailor, Worthen, & Shin, 1997). The observed scores will be higher for the high achievers, but the non-equivalent intercepts point out the different true scores for these two achievement groups.
The invariance analyses indicated that there was also the lack of equality in residuals for both learning indicators. It points out the differences in the precision of measurement across the groups compared (Schmitt & Kuljanin, 2008).
In the literature, the bias in student ratings is attributed to students’ perceptions about the meaning of the items used in the rating scale and their maturity level (Dimitrov 2010; Schoot, Lugtig, & Hox, 2012). Different than the high achieving students, the low achieving students may be assessing the content of the items differently for themselves. Having relatively scarce ratings among high achievers could be explained by their higher expectations from the instruction. Moreover, this particular group could be more critical in line with the on-going processes during the instruction and as a consequence of this, they underrate the instruction. Usually the school administrators do not compare the high achieving groups with low achieving ones but, because of the instructor’s grading policy, work load in the course, difficulty of the
administration level this factor should be seriously considered before making important decisions about the instructors since the inequality of item intercepts creates bias in ratings (Greenwald & Gillmore, 1997a, 1997b; Wilhelm, 2004). Some researchers suggest using peer ratings and review of course material by peers more than the students ratings of instruction (Ackerman, Gross, & Vigneron, 2009; Benton, Duchon, & Pallett, 2013). On the other hand, Wolbring (2012) argues that ratings provided by students can only be used to assess instructors’ effectiveness rather than promotion. Similarly, Zabaleta (2007) suggests that student rating should be removed as a component in assessing instructional effectiveness due to the strong relationship with the students’ grades.
If student rating of instruction is still worthwhile for the administrators, the bias due to the student achievement levels can be corrected in the overall rating scores. In general as a most practical precaution is statistical control which can be used for removing the influence of students’ end of semester grades from the rating results (Ellis, Becker, & Kimmel,1993; Soh, 2014; Wolbring, 2012) The correcting the rating results and removing the effect of extraneous variables are all promising but it is quite clear that student rating of instruction should be primarily used for improving the educational practices and quality of teaching rather than promotion.
This study has some limitations. First of all, the analyses are valid only for one institution. Even though the data are large enough, the results cannot be generalized to all the student rating of instruction scales. Replications are strongly recommended for the other institutional settings. Second limitation comes from the scale itself. The university administration generally wants to have shorter scales which are easy to administer. On the other hand, student rating of instruction has various aspects that are possible to cover only through longer and multidimensional assessment tools. Thus, a study could be designed for the purpose of exploring the issue of invariance by the use of professionally developed multidimensional scales. This study rather investigates the invariance issue by using an existing scale rather than exploring all the possible problems that may be encountered in evaluating the instructional effectiveness.
In sum, any comparison using student rating requires a serious consideration of students’ expected achievement level and end of the semester grades. Thus, the results of the present study indicate that the student rating of instruction should be used sparingly in making important decisions.
5. REFERENCES
Ackerman, D., Gross, B. L., & Vigneron, F. (2009). Peer observation reports and student evaluations of teaching: Who are the experts? Alberta Journal of Educational Research, 55(1), 18-39.
Baas, M., De Dreu, C. K. W., & Nijstad, B. A. (2011). When prevention promotes creativity: the role of mood, regulatory focus, and regulatory closure. Journal of Personality and Social Psychology, 100, 794–809.
Benton, S. L. & Cashin, W. E. (2012). Student ratings of teaching: A summary of research and literature. (No. 50). Manhattan, KS: IDEA Center.
Benton, S. L., Duchon, D., & Pallett, W. H. (2013). Validity of self-reported student ratings of instruction.
Assessment & Evaluation in Higher Education, 38, 377-389.
Bowman, N. A. (2010). Can 1st-year college students accurately report their learning and development? American
Educational Research Journal, 47(2), 466-496.
Brockx, B., Spooren, P., & Mortelmans, D. (2011). Taking the grading leniency story to the edge. The influence of student, teacher, and course characteristics on student evaluations of teaching in higher education. Educational
Assessment, Evaluation and Accountability, 23(4), 289-306.
Byrne, B. M. (2004). Testing for multigroup invariance using AMOS graphics: A road less traveled. Structural
Byrne, B. M. (2010). Structural equation modeling with AMOS: Basic concepts, applications, and programming. Routledge.
Byrne, B. M., Shavelson, R. J., & Muthén, B. (1989). Testing for the equivalence of factor covariance and mean structures: the issue of partial measurement invariance. Psychological Bulletin, 105, 456-466.
Bryant, F. B., & Satorra, A. (2012). Principles and practice of scaled difference chi-square testing. Structural
Equation Modeling, 19(3), 372-398.
Clayson, D. E. (2009). Student evaluations of teaching: are they related to what students learn?: a meta-analysis and review of the literature. Journal of Marketing Education, 31, 16-30.
Cole, J. S., & Gonyea, R. M. (2010). Accuracy of self-reported sat and act test scores: Implications for research.
Research in Higher Education, 51(3), 305–319.
Cruse, D. B. (1987). Student evaluations of the university professor: caveat professor. Higher Education, 16, 723-737.
Dimitrov, D. M. (2010). Testing for factorial invariance in the context of construct validation. Measurement and
Evaluation in Counselling and Development, 43(2), 121-149.
Ehie, I. C., & Karathanos, K. (1994). Business faculty performance evaluation based on the new aacsbi accreditation standards. Journal of Education for Business, 69, 257-262.
Ellis, B. B., Becker, P., & Kimmel, H. D. (1993). An item response theory evaluation of an English version of the trier personality inventory (TPI). Journal of Cross-cultural psychology, 24(2), 133-148.
Felton, J., Mitchell, J., & Stinson, M. (2004). Web-based student evaluations of professors: the relations between perceived quality, easiness and sexiness.Assessment & Evaluation in Higher Education, 29(1), 91-108.
Finney S. J., & DiStefano, C. (2013). Nonnormal and categorical data in structural equation modeling. In G. R. Hancock y R. O. Mueller (Eds.), Structural Equation Modeling: A second course (pp. 269- 492). Greenwich, CT: Information Age Publishing Inc.
Gelman, A. & Park, D. K. (2008). Splitting a predictor at the upper quarter or third and the lower quarter or third. The
American Statistician, 62(4), 1-8.
Grammatikopoulos, V., Linardakis, M., Gregoriadis, A., & Oikonomidis, V. (2015). Assessing the Students’ Evaluations of Educational Quality (SEEQ) questionnaire in Greek higher education. Higher Education, 70(3), 395-408.
Greenwald, A. G., & Gillmore, G. M. (1997a). Grading leniency is a removable contaminant of student ratings.
American Psychologist, 52, 1209–1217.
Greenwald, A. G., & Gillmore, J. M. (1997b). No pain, no gain? The importance of measuring course workload in student ratings of instruction. Journal of EducationalPsychology, 89, 743–751.
Grimes, P. W. (2002). The overconfident principles of economics students: an examination of metacognitive skill.
Journal of Economic Education, 33(1), 15-30.
Harrison, P. D., Douglas D. K., & Burdsal, C. A. (2004). The relative merits of different types of overall evaluations of teaching effectiveness. Research in Higher Education, 45(3), 311–323.
Hu, L. T., & Bentler, P. M. (1999). Cutoff criteria for fit indexes in covariance structure analysis: conventional criteria versus new alternatives. Structural Equation Modeling, 6, 1–55.
Jöreskog, K. G. (1971). Simultaneous factor analysis in several populations. Psychometrika, 36(4), 409-426.
Jöreskog, K. G., & Sörbom, D. (1996). LISREL 8: user’s reference guide. Chicago, IL: Scientific Software International.
Kennedy, E. J., Lawton, L., & Plumlee, E. L. (2002) Blissful ignorance: the problem of unrecognized incompetence and academic performance, Journal of Marketing Education, 24(3), 243-252.
Kulik, J. A. (2001). Student ratings: validity, utility, and controversy. New directions for Institutional Research, 109, 9-25.
Langbein, L. (2008). Management by results: Student evaluation of faculty teaching and the mis-measurement of performance. Economics of Education Review, 27(4), 417-428.
Levine, D. W., Kaplan, R. M., Kripke, D. F., Bowen, D. J., Naughton, M. J., Shumaker, S. A. (2003). Factor structure and measurement invariance of the women's health initiative insomnia rating scale. Psychological Assessment,
15(2), 123-136.
Lubke, G. H., Dolan, C. V., Kelderman, H. & Mellerbergh, G. J. (2003). On the relationship between sources of within- and between-group differences and measurement invariance in the common factor model. Intelligence,
31, 543-566.
Macfadyen, L. P., Dawson, S., Prest, S., & Gašević, D. (2016). Whose feedback? A multilevel analysis of student completion of end-of-term teaching evaluations. Assessment & Evaluation in Higher Education, 41, 821-839. Machina, K. (1987). Evaluating student evaluations. Academe, 73(3), 19-22.
MacNell, L., Driscoll, A., & Hunt, A. N. (2015). What’s in a name: exposing gender bias in student ratings of teaching. Innovative Higher Education, 40(4), 291-303.
Marsh, H. W., & Roche, L. A. (1997). Making students' evaluations of teaching effectiveness effective: The critical issues of validity, bias, and utility. American Psychologist, 52(11), 1187-1197.
Marsh, H. W., & Roche, L. A. (2000). Effects of grading leniency and low workload on students' evaluations of teaching: Popular myth, bias, validity, or innocent bystanders?. Journal of Educational Psychology, 92(1), 202-228.
Maurer, T. W. (2006). Cognitive dissonance or revenge? Student grades and course evaluations. Teaching of
Psychology, 33(3), 176-179.
McKeachie W. J. (1987). Can evaluating instruction improve teaching?. New Directions for Teaching and Learning,
31, 3-7.
McPherson, M. A., & Jewell, R. T. (2007). Leveling the playing field: Should student evaluation scores be adjusted?.
Social Science Quarterly, 88(3), 868-881.
Meredith, W. (1993). Measurement invariance, factor analysis and factorial invariance. Psychometrika, 58(4), 525-543.
Meredith, W., & Millsap, R.E. (1992). On the misuse of manifest variables in the detection of measurement bias.
Psychometrika, 57, 289-311.
Messick, S. (1989). Validity. In R. L. Linn (Ed.), Educational measurement (3rd ed., pp. 13–103). New York: American Council on Education/Macmillan.
Miles, P., & House, D. (2015). The Tail Wagging the Dog; An Overdue Examination of Student Teaching Evaluations. International Journal of Higher Education, 4(2), 116-126.
Morley, D. (2014). Assessing the reliability of student evaluations of teaching: choosing the right coefficient.
Assessment & Evaluation in Higher Education, 39(2), 127-139.
Nargundkar, S., & Shrikhande, M. (2014). Norming of student evaluations of instruction: Impact of noninstructional factors. Decision Sciences Journal of Innovative Education, 12(1), 55-72.
Nimmer, J. G. & Stone, E. F. (1991). Effects of grading practices and time of rating on student ratings of faculty performance and student learning. Research in Higher Education, 32, 195-215.
Pascarella, E. T., Seifert, T. A., Blaich, C. (2010). How effective are the nsse benchmarks in predicting important educational outcomes? Change, 42(1), 16–22.
Pollio, H. R., & Beck, H. P. (2000). When the tail wags the dog. Journal of Higher Education, 71, 84-102.
Remmers, H. H. (1928). The relationship between students' marks and student attitude toward instructors. School &
Society, 28, 759–760.
Rodabaugh, R. C., & Kravitz, D. A. (1994). Effects of procedural fairness on student judgments of professors.
Journal on Excellence in College Teaching, 5(2), 67-83.
Sailor, P., Worthen, B., & Shin, E. H. (1997). Class level as a possible mediator of the relationship between grades and student ratings of teaching. Assessment & Evaluation in Higher Education, 22(3), 261-269.
Satorra, A., & Bentler, P. M. (1988). Scaling corrections for chi-square statistics in covariance structure analysis. ASA 1988 Proceedings of the Business and Economic Statistics, Section (308-313). Alexandria, VA: American Statistical Association.
Satorra, A., & Bentler, P. M. (2001). A scaled difference chi-square test statistic for moment structure analysis.
Psychometrika, 66, 507–514.
Schmitt, N., & Kuljanin, G. (2008). Measurement invariance: review of practice and implications. Human Resource
Management Review, 18, 210-222.
Schoot, R., Lugtig, P., & Hox, J. (2012). A checklist for testing measurement invariance. European Journal of
Developmental Psychology, 9(4), 486-492.
Soh, K. (2014). Test language effect in international achievement comparisons: An example from PISA 2009. Cogent
Education, 1(1), 955247.
Stark, S., Chernyshenko, O. S., & Drasgow, F. (2006). Detecting differential item functioning with confirmatory factor analysis and item response theory: toward a unified strategy. Journal of Applied Psychology, 91(6), 1292. van de Vijver, F. J. R., & Tanzer, N. K. (2004). Bias and equivalence in cross-cultural assessment: An overview.
Revue Européenne de Psychologie Appliquée/European Review of Applied Psychology, 54,119-135.
Vandenberg, R. J., & Lance, C. E. (2000). A review and synthesis of the measurement invariance literature: suggestions, practices, and recommendations for organizational research. Organizational Research Methods, 3, 4–70.
Wilberg, M. (2007). Measuring and detecting differential item functioning in criterion-referenced licensing test: A
theoretic comparison of methods. Umea University. EM No 60.
Wilhem, H. B. (2004). The relative influence of published teaching evaluations and other instructor attributes on course choice. Journal of Marketing Education, 26(1), 17-30.
Wolbring, T. (2012). Class attendance and students’ evaluations of teaching. Do no-shows bias course ratings and rankings?. Evaluation review, 36(1), 72-96.
Wu, A. D., Li, Z. & Zumbo, B. D. (2007). Decoding the meaning of factorial invariance and updating the practice of multi-group confirmatory factor analysis: a demonstration with timss data. Practical Assessment, Research &
Evaluation, 12, 1–26.
Zabaleta, F. (2007). The use and misuse of student evaluations of teaching.Teaching in Higher Education, 12(1), 55-76.
Zhao, J., & Gallant, D. J. (2012). Student evaluation of instruction in higher education: Exploring issues of validity and reliability. Assessment & Evaluation in Higher Education, 37(2), 227-235.
Extended Abstract
Student rating of instruction is a widely accepted approach in academic settings to elicit students’ opinions regarding the instructional effectiveness. The use of student rating of instruction dates back to 1920s (Remmers, 1928). Until 1960s, ratings were basically used by instructors to collect students’ opinions about the effectiveness of teaching, rather than providing institutional feedback for academic promotion. Starting in 1970s, student ratings became a critical instrument in higher education institutions for both formative and summative assessment of instructors (Macfadyen et al., 2016; Morley, 2014). Although these ratings are basically used for monitoring instructional quality, they constitute an important source of information for high-stake decisions about the instructors such as promotion and granting tenure in the academic track (Ehie & Karathanos, 1994; Kulik, 2001; Nargundkar & Shrikhande, 2014). In either cases, the student ratings are used for important decisions which require reliable and valid measurement results. In other word, scores obtained on student rating should not be contaminated by some extraneous factors such as students’ expectations and achievement levels in a particular course. Thus, in the present study, validity of student ratings was examined from the perspective of measurement invariance across achievement levels.
The data were collected in a private university in Turkey. In order to avoid inflation in the Type I error rate, the means obtained in the item level for each classroom were used as the unit of analysis. Decisions, high-stake or not, regarding courses and instructors were made based on aggregated student ratings at class level. A random sample of 625 classrooms with total 9230 students were used in the data analysis. The items were rated on the Likert type agreement scale such as strongly disagree (1), disagree (2), neutral (3), agree (4), and strongly agree (5). The scale scores have the Cronbach’s alpha reliability of .97 in the whole group.
Based on the 33rd and 66th percentile scores, three groups were defined based on self-reported learning criterion. The bottom and the top groups were selected for this study to define low and high achieving groups. Three hundred and eight classrooms with the means below the 33rd percentile score were named as low achieving and 317 classrooms with means above the 66th percentile score were named as high achieving classrooms. The second criterion is the students’ end of semester grades. Similarly, 33rd and 66th percentile scores were used to divide the group into two. Two hundred sixty-seven classrooms which were above the 66th percentile scores were named as high achieving classrooms and 358 classrooms which were below the 33rd percentile score were named as low achieving classrooms.
Analyses started with a baseline model including no constraint about invariance across groups and proceed with increasingly restrictive constraints on the baseline model. The measurement invariance was studied through the following steps: invariance of (i) factor patterns (configural), (ii) factor loadings (weak), (iii) intercepts (strong), and (iv) variances of residuals of observed variables (strict).
For self-reported learning, non-significant value for S-Bχ2 index provides supporting evidence for configural invariance. Also goodness-of-fit indexes confirmed the fit between model and the data. As was explained before in the second level of invariance, a new constraint was added into the model to fix the factor loadings across the groups. The S-Bχ2 difference test result indicated that the weak invariance was also confirmed in the model. In the consecutive two steps, the item intercepts and error variances were fixed in the model. Strong invariance was also observed. However, the model for strict invariance did not produce acceptable fit indexes.
For end of semester grades, configural invariance level was achieved with respect to S-Bχ2 difference test. Goodness-of-fit indexes indicated that one-dimensional factor structure was found to be invariant across learner groups. On the other hand, weak invariance was not fully observed. Freeing the factor loading of the item assessment provided a partial weak invariance. However, item intercepts were not invariant, as evidenced by significant S-Bχ2 changes after new constraints were added even though goodness-of-fit indexes indicated a good fit. Equality of error variances was not checked since factor intercepts were variant.
In the present study, with respect to self-reported expected grades and end of semester grades, only the strict invariance was not achieved where the amount of errors are different across groups expecting high and low scores. Thus, with respect to self-reported expected grades, any difference in the observed scores across groups expecting high and low scores are true differences. This means that as students expect to get higher grades in the course they tend to rate the instructor relatively in a more positive way. This could be a problem if students take courses with some contemplation about the leniency in grading. High score expectation will cause students rate the instruction in a more positive way. In the institutional context, if the rating results are primarily used for instructional evaluation or promotion, there will be bias in rating results in favor of instructors who have lenient grading policy. From administrative point of view, there is a need to have some precautions especially if the results are basically used for instructors’ promotion. In practice, students expected grades can be statistically controlled over the rating scores in order to remove this unintended effect in the rating results.
For the end of semester grades, only the configural invariance was fully achieved in the scale. This means that high and low scorers have a unidimensional conception of the instructional effectiveness as articulated in the items’ content. However, the lack of complete weak invariance implies that the comparison across the groups may be problematic if all the items are considered.
Differences in intercepts across different groups indicate that for the same instructor or classroom practice different achievement groups may have different perceptions and as a consequence of it, the ratings of these groups are different (Baas, De Dreu, & Nijstad, 2011).