Special Issue on Applied Economics and Finance
Has Intra-Industry Trade Changed After Protectionism?:
The Case of US Automotive Industry
1
Korumacılık Sonrası Endüstri-İçi Ticaret Değişti mi?:
Amerikan Otomotiv Endüstrisinin Durumu
Gulcin Elif YUCEL, Beykent University, Turkey, [email protected] Ayfer USTABAS, Beykent University, Turkey, [email protected]
Abstract: The automotive industry is one of the most important engines of economic development thanks to its contribution to employment, high value added creation capacity, production size, high share in global trade and attracting international investments. Therefore, changes in the industry affect the entire economy. After the election of Donald Trump in the United States, restrictions were put on international trade in various ways and protectionism came to the fore. In the study, it is aimed to analyze the intra-industry trade and competitiveness of the automotive industry products between the years of 2007-2017. In the analyzes, the products and countries where the US has the most intense intra-industry trade in the automotive industry have been examined and the change before and after the protectionist policies have been compared. Intra-industry trade has been calculated using the Grubel-Lloyd index. In the analyzes, Harmonized System 6-digit trade data from the World Bank supported WITS software have been used. The results suggest that the share of intra-industry trade decreases as protectionism increases as expected.
Keywords: Intra-Industry Trade, Protectionism, Automotive Industry, Economic Development
Öz: Otomotiv endüstrisi, istihdama katkısı, yüksek katma değer yaratma kapasitesi, üretim büyüklüğü, küresel ticaretteki yüksek payı ve uluslararası yatırımları çekmesi nedeniyle ekonomik gelişmenin en önemli motorlarından biridir. Bu nedenle, sektördeki değişiklikler tüm ekonomiyi etkiler. ABD’de Donald Trump’ın seçilmesinden sonra çeşitli şekillerde uluslararası ticarete kısıtlamalar getirilmiştir ve korumacılık ön plana çıkmıştır. Bu çalışmada, 2007-2017 yılları arasında otomotiv endüstrisi ürünlerinin endüstri içi ticaret ve rekabet edebilirliğinin analiz edilmesi amaçlanmıştır. Çalışmada, otomotiv endüstrisi ürünlerinin endüstri içi ticaret ve rekabet edebilirliğinin 2007-2017 yılları arasında incelenmesi amaçlanmıştır. Analizlerde, ABD'nin otomotiv endüstrisinde en yoğun sanayi içi ticarete sahip olduğu ürünler ve ülkeler incelenmiş ve korumacı politikalar öncesi ve sonrası değişim karşılaştırılmıştır. Grubel-Lloyd endeksi kullanılarak endüstri içi ticaret hesaplanmıştır. Analizlerde, Dünya Bankası destekli WITS yazılımından Harmonize Sistem 6 basamaklı ticari veriler kullanılmıştır. Çalışmanın sonuçlarına göre, korumacılık arttıkça endüstri-içi ticaretin payının azaldığı görülmektedir.
Anahtar Sözcükler: Endüstri-İçi Ticaret, Korumacılık, Otomotiv Endüstrisi, İktisadi Kalkınma
1. Introduction
The automobile industry called by Peter Drucker as “the industry of industries” is considered as one of the main contributors to economic development because of its scale and linkages with various other manufacturing industries and services (Dicken, 2013). On production side, there are very large transnational manufacturers of vehicle and component suppliers working closely with internationally integrated ties. It is estimated that nearly 9 million people are employed directly in the production of vehicles constituting more than 5% of the global manufacturing employment. If the workers in services sectors such as the selling and servicing vehicles are included, then it is concluded that the automobile industry provides a total of more than 50 million jobs throughout the world. The global automobile industry produced over 90 million motor vehicles in 2018. If the industry was a country, it would be the sixth largest economy with this level of output (OICA, 2018). In short, economic development, employment and welfare are always related to the development of the automobile production and markets.
Given the fact that an automobile is consisted of an immense number and type of components, the growth of automobile industry increases the demand for backwardly linked industries including steel, rubber, glass, paint, plastic and electric and electronic equipments as well as for downstream integrated industries such as dealers, maintenance and repair services, financial institutions providing automobile credit, fuel oil companies and finally the advertising and insurance companies. As a result of this process that is called by Freeman as “clustering”, the automobile industry was one of the major ingredients of national industrial economic development policies and strategies (Abbott, 2003).
The automobile industry is a truly global industry with its contribution to the gross world product. According to Kierzkowski (2011), modeling the global auto industry is a difficult task, for several reasons. First of all, the industry does not produce a homogenous good but differentiated products, with a multitude of existing models, colors and options. For example, there is some horizontal product differentiation going on in the auto industry- we can see yellow Volkswagens and blue Volkswagens. However, the horizontal product differentiation takes a second seat to vertical
1Bu çalışma Gülçin Elif Yücel ve Ayfer Ustabaş özet bildirisi olarak, “ICOAEF’18, IV. International Conference on Applied Economics and Finance
& EXTENDED WITH SOCIAL SCIENCES, November 28 – 29 – 30, 2018 / Kuşadası – Turkey” Kongresinde sanal oturumda sunulmuştur ve kongre
83
product differentiation in this sector. The Falvey–Kierzkowski (1987) model was specifically set up to deal with vertical differentiation. It works like this. Assume that there are: 4 countries, Germany, the USA, China and India; two commodities (sectors), food (F) and auto (A); and two homogeneous factors of production, capital (K) and labor (L). Assume further that sector F produces a homogeneous product and sector A produces a continuum of differentiated products called qualities. The homogeneous product sector uses a Ricardian production function with labor being the only input. In contrast, the differentiated product sector uses L as well as K. Constant returns to scale and perfect competition prevail in the two sectors, F and A. One of the conclusions of the Falvey–Kierzkowski model is that every country will be a car exporter. India, for instance, will export some of its car production to China. However, it will also export some cars to the USA and Germany because there is a market for lower quality vehicles in these countries. By the same token, India will import some high-quality models, such as Cadillac or Mercedes, because there is a market for higher-end cars in India. On the whole, however, India will be a net importer of cars. The average car quality in India will tend to be rather low given the average income per capitathere. On balance, it will be a net importer of cars. Moving to the other end of the quality spectrum, Germany will export and import cars to and from the USA, India and China, but, on balance, it will be a net exporter of cars. Its trade surplus generated by the auto industry will be exactly matched by food imports (Kierzkowski, 2011).
The intra-industry trade (IIT) revolution in trade theory has been a striking feature of world trade for many decades. Since the 1960s, the traditional trade theories (absolute and comparative advantage) have come under major criticism because they fail to explain trade in which countries both export and import within the same industrial category. The traditional Heckscher-Ohlin (H-O) theory, which is also known as factor proportions theory, cannot adequately explain the volume of simultaneous exports and imports within the same industry. Thus, trade economists were in a search of a new trade theory in order to explain the phenomenon of this simultaneous international trade. A part of the intra-industry trade literature is concerned with the international division of the supply chain in commodity production. Instead of producing the whole commodity in a single country, the relevant production line is segmented into several parts depending on skill, technology and factor requirements, and then countries engage in back and forth trade in intermediate inputs until the final product is assembled (Salim et al., 2018.)
Restructuring and change that have characterized the auto-industry in the past two decades is one of the most important factors behind the rapid expansion of intra-industry in the US auto-industry. In other words, intra-industry trade has become much more important than before in the US auto-industry in recent years due to ongoing structural changes in auto production and large investments by global assemblers. There is an increasing trend in the use of entire sub-assemblies (‘modules’) rather than individual components. Auto-industry organized itself into several tiers. Tier 1 sells directly to automakers or original equipment manufacturers (OEM), which assemble final product. Tier 2 supplies parts to Tier 1 and those that sell parts to Tier 2 are known as Tier 3, etc. moving down to the value chain2. Rather than supplying
only the fuel tank for a given model, a first-tier supplier may supply the entire fuel supply system. Also, car manufacturers have begun requiring their first-tier suppliers to provide modular components (standard) that can be used on several vehicle models worldwide. By using modules or preassembled units for several vehicle models, automakers are able to cut production costs and reduce their in-house parts operations. Consequently, these changes in the global auto-industry have forever altered the relationship between motor vehicle manufacturers and auto-parts suppliers (Turkcan and Ates, 2010).
This study is organized as follows: Section 2 gives some information about the importance of the US automobile industry. Section 3 contains theoretical and empirical background of IIT literature. In the next section measures of IIT and its decomposition as vertical and horizontal are described. Section 5 describes the data set and outlines the application procedure, followed by the summarized empirical results. Finally, empirical results and conslusions are presented in Section 6.
2. Automobile Industry
2.1. The Importance of the Automobile Industry
The United States was the major producer of the automobile industry starting from the Henry Ford’s invention of mass production in 1913. Then, the lean production led by Japanese company Toyota in 1970’s displaced the Fordist mass production techniques. From the 1960s to 1970s, European and especially Japanese carmakers started to penetrate the US market through exportation. The mass production and lean production both have played a crucial role in the implementation of effective and appropriate technologies not only in the automobile industry but also in overall manufacturing industries. Japan has been very successful in developing its automotive industry with globally accepted brands such as Toyota, Honda and Nissan, and immense research and development and innovation capacity. After the years of dominance by manufacturers from industrialized countries, new global firms from developing countries such as South Korea, India and China have significantly increased the competition in the industry (Dicken, 2013). Finally, in 2009 China became the world’s largest automotive market and producer. In China, the automobile industry which was determined as one of the strategic industries in 1980s became a contributor of growth for the Chinese economy in the 1990s (Chin, 2010). The development of the automobile industry is not a spontaneous event but an evolutionary process. There are some principal factors of development in the growth of the industry. The role of the state and foreign direct
84
investment are reported as the most important factors in the development of the automobile industry especially in developing countries such as South Korea, and lately China.
The contribution of the automobile industry in the welfare of the economy depends mostly on the part of local manufacturers and suppliers. During the development of a country’s national automobile industry, the stages of development exhibit similarity especially in case of developing countries. The first stage is the import of vehicles completely by local importers. As a result of high transport costs and protectionist measures, the country shifts to second stage that is the ssembly of vehicles imported to save some part of costs and to make some adaptations for the country. The third stage is the assembly of vehicles having an increasing domestically manufactured part. This stage allows the development of local component suppliers as well as the rising value added of the national automotive industry. Lastly, the fourth stage in which the local value added reaches the highest level, is referred as the full scale manufacture of vehicles by the country (Abbott, 2003).
The automobile industry has also some important socio-economic impacts. The industry has been accepted to be one of the main technologies mentioned in the fourth Kondratiev by neo Schumpeterians. Kondratiev long waves, generally fifty year long cycles were started by Kondratiev in the 1920s developed by Schumpeter in the next decade. The invention of internal combustion engine, Ford’s mass production techniques and the development of multinational companies such as “US Big Three” (Ford, General Motors and Chrysler) outlines the fourth Kondratiev concerning the period from 1920s to 1970s (Abbott, 2003).
New techniques of production namely, innovations have always been the focus of the automobile industry. The industry is an important innovator with over 84 billion euro in research, development and manufacturing. For example, since consumers demand more environmentally friendly cars, car manufacturers have invested in developing various types of automobiles running on alternative fuels such as electrical cars or using hybrid technology including both petroleum and electric power (OICA, 2018). Finally, the automobile industry is also a major source of state revenues including different tax revenues globally and contributes over 430 billion euros in 26 countries alone (OICA, 2018).
2.2. Global Trends in USA Automobile Industry
The global automobile industry registered a 67 % increase from 2000 to 2017 (58 million to 97 million units). Producing these vehicles requires the employment of about 9 million people working directly in the production of vehicles and their spare parts. This is more than 5% of the world’s total manufacturing employment. Taking into consideration the indirect jobs, the automobile industry, one of the most global of all manufacturing industries owes more than 50 million jobs (OICA, 2018).
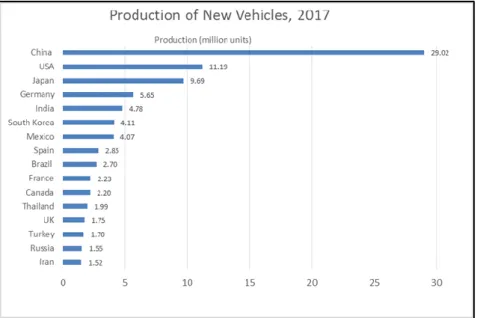
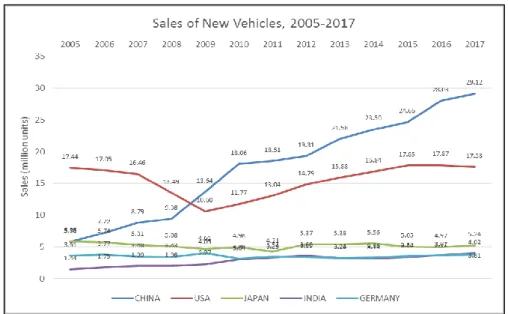
Global automobile industry which was dominated in 1960s by the USA, faced the strong growth of Japan in 1970s and 1980s as a leading automobile exporter (Dicken, 2013). As of 2017, China is the leading automobile producer (29 million units) followed by the USA (11.2 million units), Japan (9.7 million units), Germany (5.6 million units), India (4.7 million units) and South Korea (4.1 million units) (Figure 1). China is also the world’s biggest vehicle market with 29.1 million vehicles followed by the USA market with 17.5 million cars sold during the same period (Figure 2).
Figure 1. Production of New Vehicles in selected countries in 2017 (in million units) Source: OICA (International Organization of Motor Vehicle Production), 2018
85
Figure 2. Sales of New Cars in selected countries 2005-2017
Source: OICA (International Organization of Motor Vehicle Production), 2018
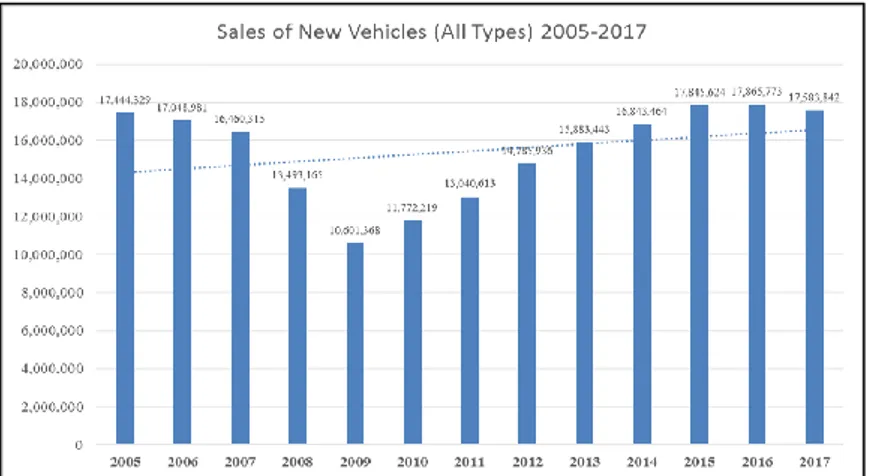
The US automobile industry was one of the major industries severely affected by the 2008 global financial crisis. Total car sales dropped 18% and 21% from 2007 to 2008 and from 2008 to 2009 respectively (Figure 3). Some of multinational manufacturers faced financial difficulties so that governments supported them to eliminate the unemployment and economic depression. Thus various restructuring interventions occured in the industry, notably in North America and Europe.Despite these interventions, consolidations through mergers and acquisitions were inevitable in some situations. General Motors sold some assets of Saab, one of its premium brands to Chinese firm BAIC. In 2008, Ford sold its Jaguar Land Rover branch to Indian manufacturer Tata and sold Volvo to Chinese company Geely. Thus, the decline of US Big Three manufacturers started by the end of 1980s turned into a collapse as a result of 2008 crisis. Finally, the Italian company Fiat has totally acquired Chrysler in 2014 (Dicken, 2013).
Another important development occurred in the automobile industry in 1990s is the environmental issues originated by the global warming. The governments started to involve by using environmental policies which resulted in the changes about the design, technology and components used in vehicles. Especially, during the Obama administration, the US government provided loans to manufacturers to produce new types of fuel efficient cars. The government had also announced the limits aiming to decrease the carbon emmissions by 30 % by 2016 (Dicken, 2013).
Figure 3. Sales of New Vehicles in USA 2005-2017
Source: OICA (International Organization of Motor Vehicle Production), 2018
Motor vehicle sales in the US surpassed the effects of the crisis gradually starting from 2010 and sales reached 17.5 million units in 2016 that is the highest annual figure on record. Besides, US vehicle importation has also kept its nearly constant share of total sales (Figure 4).
86
Figure 4. US Vehicle Sales and Imports (Passenger cars, light trucks, and SUVs) Source: Ward’s Automotive Yearbooks, Ward’s Datasheets, and CRS as cited in (Canis et. al. 2018)
US motor vehicle production has been significantly changed by the North American Free Trade Agreement (NAFTA) that took effect in 1994. As a result of this agreement, Mexico has become North America’s important automobile production center through the full integration into US and Canada’s supply chains. Besides, US vehicle production has increased with major European, Japanese and South Korean automobile multinationals (Figure 4). (Canis et al., 2018)
Figure 5. Sales of New Vehicles in USA 2005-2017 Source: Ward’s Datasheet as cited in (Canis et al. 2018)
In addition to the integration with NAFTA member countires, US-China trade relations have expanded in the late 1970s. Total merchandise trade between US and China increased from 2 billion dollars in 1979 to 636 billion dollars in 2017. China is currently the US’ largest trading partner in merchandise, its third largest export market as well as its biggest source of imports (Morrison, 2018). Despite growing economic ties with especially NAFTA countries and China, US has started to take protectionist measures especially towards China and to review its relations with NAFTA in 2017 and notably in 2018. The aggravation of US twin deficits (in 2017, the current account deficit amounted 2.3 % of GDP and the fiscal deficit reached 3.4 % of GDP in 2017) is one of the reasons explained for the aggressiveness of the US Government about its bilateral trade policy (Boata et al. 2018).
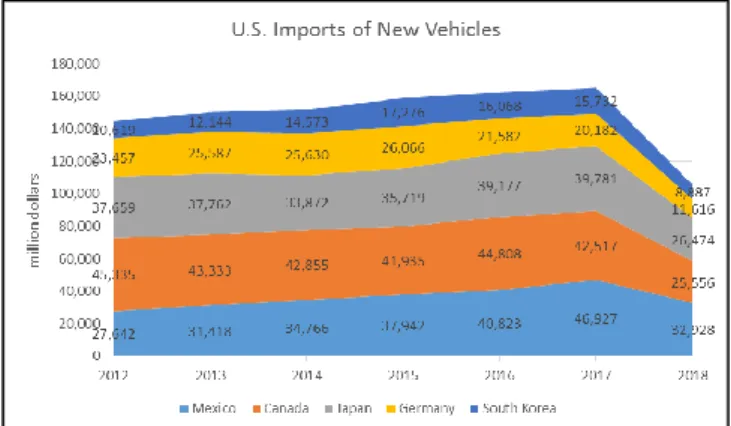
Main partners of US in terms of exports of new vehicles are Canada, China, Germany, Mexico and South Korea (Figure 6). US imports mainly from Mexico, Canada, Japan, Germany and South Korea (Figure 7) (International Trade Administration, 2018) .
87
Figure 6. U.S. Exports of New Vehicles 2012-2018 (Jan.-Aug.) Source: (International Trade Administration, 2018)
Figure 7. U.S. Imports of New Vehicles 2012-2018 (Jan.-Aug.) Source: (International Trade Administration, 2018)
3. Theoretical and Empirical Background of IIT Theory
In the early 1960s some trade theorists3 have hypothesized that different countries may specialize in different types of a
given commodity instead of being specialized in different products. Because they noticed that most of the world trade actually takes place between developed countries with similar income structure and much of the trade between these countries involves two-way exchange of goods produced with similar factor endowments. In other words, they became aware that certain developed countries exported and imported products in the same product categories4. They noticed that
countries with similar factor endowments do more trade than countries with different factor endowments. These developments gave rise to abandon the traditional factor endowment theory which assumes that international trade takes place among countries with different factor endowments. Therefore, the new trade theory emphasized the existence of scale economies and imperfect competition.
Theories of IIT can be divided into two parts such as demand-side theories5 and supply-side theories6. The former
is about the diversification of consumer tastes whereas the latter one gives emphasis on product differentiation7. A great
deal of international trade is IIT in differentiated products, as opposed to inter-industry trade8 in completely different
products. IIT is explained by increasing returns theory. Increasing returns theory implies higher trade volumes when there are scale economies, when income levels are similar and when there is product differentiation. This is where new trade theory comes in (Williamson and Milner, 1991).
3 See Verdorn (1960) and Linder (1961).
4 This phenomenon occurred in the years following the formation of the European Economic Community (EEC). However, it only started to receive
increasing attention after Grubel and Lloyd (1975) had introduced an index to measure IIT (See Faustino and Leitão, 2007).
5 See Linder (1961), Lancaster (1980), Helpman (1981).
6 See Helpman (1981), Krugman (1981) and Helpman and Krugman (1987).
7 From the earliest work on IIT, product differentiation was seen as an important ingredient in its explanation (see for example Balassa, 1966; Grubel
and Lloyd, 1975). Following the contributions of Dixit and Stiglitz (1977) and Lancaster (1979) product differentiation has become explicitly modelled in formal analyses of IIT (See Greenaway et al., 1995).
8 Grubel (1967) states that inter-industry trade results when countries produce and export but do not import the output of some industries while they
88
The expansion of trade flows between countries can be of IIT type or inter-industry type. Inter-industry trade is considered as a one-way trade since the exchanged products belong to different industries. On the other hand, IIT is the two-way exchange of related products between nations with the same or similar factor intensities in production or that are close substitutes in demand. Grubel and Lloyd (2003) find this definition too restrictive and define IIT as an exchange between nations of all kinds of products that are closely related in supply or demand. Explanations of international trade have been inspired by the decomposition of total trade in trade overlap (representing intra-industry trade) and the imbalance (inter-industry trade). The flows related to inter-industry trade remain largely explained by traditional theory, whereas intra-industry trade is explained by the new trade theories (Fontagné and Freudenberg, 1997).
There is a huge literature on IIT that is increasing day by day. Most of the studies are empirical rather than being theoretical. Country or country group studies consist most of the IIT literature. The following studies are a small part of this increasing number of studies about the US automotive industry.
Given its crucial importance in the global automotive industry and in the US economy, the US automotive industry has become an appropriate case to study the structure and determinants of IIT. Several empirical studies have analyzed the determinants of IIT in motor vehicle and autoparts industry (Becuwe and Mathieu, 1992; Montout et al., 2001, 2002; Ito and Umemoto, 2004; Umemoto, 2005; Lefilleur, 2008; Leitao et al., 2009). However, among these empirical studies only Montout et al. (2002) have specifically examined IIT in the US auto-industry in the context of NAFTA for a shorter time period from 1992 to 1999. The results highlight an increase of IIT in the corresponding industry since the beginning of the 1990s. They distinguish horizontally differentiated goods from vertically differentiated goods using a comparison of the unit values. Subsequently, with the increase of IIT, it appears that MERCOSUR has favoured in particular the development of trade in vertically differentiated goods. In MERCOSUR, the automobile industry has experienced the highest rate of growth in IIT. They also analyse the nature of that increase and more precisely, the determinants of IIT. In order to explain the pattern of trade for the automobile industry, they present an econometric model integrating principles of gravity, which takes into account some country-specific variables.
Turkcan and Ates (2010) also examined the composition of trade patterns, and development of intra-industry trade (IIT) between the US and its 37 trading partners in auto-industry for 1989-2006 period. Their results show that a substantial part of IIT in the US auto-industry was vertical IIT and vertical IIT increased over the data period.
4. Measurement and Decomposition of IIT
Grubel and Lloyd (1975) state that there was a debate about the way in which IIT flows should be measured. The appropriate index or statistics to measure this trade was one of the main issues in discussions. In 1960s, a variety of measures of IIT have been offered (Verdorn 1960, Michaley 1962, Kojima 1964). However, they have not dealt with IIT directly and they have only prepared the ground for the explicit measures of IIT. Balassa (1966) was the first people who proposed the measure of the extent of IIT. In his measure, exports of a given good are offset by imports of an equivalent good. Among them, the most important one is Balassa’s Index (1966). His index is formulazed as follows:
Bj =
|𝑋𝑗−𝑀𝑗| 𝑋𝑗+𝑀𝑗
XJ is the value of the exports of commodity j by a country, and MJ is the value of the “matching” imports. If there is
no intra-industry trade (XJ = 0 or MJ = 0), then BJ =1. But if there is perfectly matching intra-industry trade, then XJ = MJ
and BJ = 0.
The measure of Balassa has two drawbacks. First, it gives equal weight to all industries, that is irrespective of whether their share in total industry exports plus imports is large or small. Second, there is no correction for the aggregate trade imbalance (Grubel and Lloyd, 1971, 1975). Since Balassa Index is a simple arithmetic mean of each industry's index which does not reflect the different weights of each industry, it is criticized by Grubel and Lloyd (1971, 1975) and they made a simple modification and introduced their famous GL index for the measurement of IIT. Since Balassa index has not been found much favourable, most studies generally use other indices9. The GL index is the well-known measure of
IIT which tries to measure the trade overlap in a given sector. The GL index is a simple modification of the Balassa formula. It calculates the part of balanced trade (overlap between exports and imports) in all trade in a given industry j. The GL index is written as,
9 Even if most studies use GL index, there are some shortcomings of using it. According to Salvatore (1998), there is a serious shortcoming in using the
GL index to measure the degree of IIT. This results from the fact that GL index has different values depending upon how broadly the industry or product group are defined. Specifically, the more broadly defined an industry, the greater will be the value of GL because of that a country will export some varieties of the differentiated product and import others. Thus, according to him the GL index must be used with caution. It can, nevertheless, be very useful in measuring differences in IIT in different industries and changes in IIT for the same industry over time. Nilsson (1997) also claims that “the GL index is a measure of the degree of IIT rather than of the absolute amount of IIT. Since the GL index does not correctly reflect the level of IIT, it is necessary to make a distinction between the level and the share of IIT. This failure of the GL index to correctly reflect the level of IIT may partly be explained by the relative size of the trade imbalances. The measure of relative trade imbalances equals one minus the GL index. Hence, the country with the largest relative trade imbalance will always display the lowest degree of IIT according to the GL index, irrespective of the level of IIT. Likewise, the country with the lowest relative trade imbalance will always display the largest share of IIT”.
89 𝐺𝐿𝑗=
(𝑋𝑗+𝑀𝑗)−|𝑋𝑗−𝑀𝑗|
(𝑋𝑗+𝑀𝑗)
GL index varies between zero and one. If there is no intra-industry trade (Xj=0 or Mj=0), it takes the value of zero and
if there is perfectly matching intra-industry trade, then GL= 1. Therefore, the Balassa index is positively related to the level of inter-industry trade while GL index is positively related to the level of intra-industry trade. After calculating the shares of IIT by using GL index, IIT is divided into its horizontal and vertical components. In other words, there are two forms of IIT. The first one is HIIT that distinguishes between the exchange of competing or substitute products. The other one is VIIT that is the exchange of products at different stages in the processing of a final product (Grubel and Lloyd, 1975). The HIIT is seen between different varieties of a product while the VIIT is about the different qualities or levels of service provided by a product10. Horizontal product differentiation refers to product types which differ in specifications
but are of the same “quality” in the sense that they embody the same value of resources (e.g. recordings by different performers, identical houses at different locations, brands of pasta) (Vousden, 1990). In other words, HIIT occurs when varieties differ in their characteristics, i.e. it may be either “actual” (the colour of wine) or “perceived” (the taste of the wine).
The theoretical basis of VIIT was first developed by Falvey (1981). Falvey explains IIT with quality differences between products by using the constant returns to scale assumption of the traditional Heckscher-Ohlin-Samuelson (HOS) theorem. Falvey concentrates on trade within a single industry and adopts a partial equilibrium approach. He defines higher quality products by higher K/L ratio used in their production. Thus, the capital-abundant countries have higher quality while labour-abundant countries have lower quality. The demand for different qualities leads to an increase in the volume of VIIT. Therefore, Falvey predicts that the share of VIIT is greater when the difference in the K/L endowment or per capita income of countries is greater. VIIT involves the exchange of different qualities of the same good, produced using different technologies. In other words, VIIT is defined as the two-way trade of commodities that differ in quality. The determinants of VIIT are more factor and trading partner specific. The share of VIIT increases (decreases) if the trading partner has a larger (smaller) endowment (Cabral et al., 2009).
HIIT models that were generated by Lancaster (1980), Krugman (1979; 1981), Helpman (1981), and Dixit and Norman (1980) focus on variation between products of a similar quality in combination with increasing returns to scale. According to these theorists, HIIT takes place between countries on the same level of economic development and in monopolistically competitive markets. HIIT is driven by economies of scale and occurs when products within similar qualities are differentiated. In this type of IIT, consumers can express their preferences for product variety. On the other hand, VIIT is defined as the exchange of similar goods of different quality which is driven by comparative advantage. In general, HIIT is seen between the two-way trade of developed countries whereas VIIT is seen between developing and developed countries. However, recent empirical studies show that VIIT is dominant as compared to HIIT even among developed countries11. Also, empirical literature of IIT points out the dominance of VIIT12 (Greenaway, Hine and Milner, 1994).
HIIT is considered to be particularly relevant to explain the presence of IIT among developed countries. HIIT is analyzed under monopolistic competition derived from the existence of economies of scale in the differentiated product industry. Even though the products are different in many attributes, they are the same in terms of quality, cost and technology used in their production process. On the other hand, VIIT is considered to be particularly relevant to explain the presence of IIT between unequal partners. However, some of the empirical studies show that VIIT is dominant even among the developed countries. For instance, Greenaway et al. (1994) found that VIIT is dominant in the UK’s bilateral trade with every developed country. Also, Hu and Ma (1999) observed the dominance of VIIT in the manufacturing industry of China.
In order to decompose IIT, the quality differences in exports and imports of a country are used. Since determining the qualities of commodities are very difficult, in empirical studies the product prices are generally used as indicators of quality. In other words, differences in prices (unit values) reflect quality differences. This assumption is only acceptable with the most detailed trade data, where aggregation of different products within one product category is minimized. Greenaway et al. (1995) claims that all studies of quality in international trade start from the low and high price comparison. Falvey (1981) claims that quality is an increasing function of capital intensity. It means that capital abundant countries have comparative advantage in higher-quality varieties while labor-abundant countries have the opposite. In summary, high-income countries export high-price and high-quality products while income countries export low-price and low-quality products. It is assumed that higher quality goods have higher low-prices (Stiglitz, 1987). Therefore, in order to determine the quality differences of exports and imports, export and import unit values are used. Abd-el Rahman (1991) was the first and the most important one in decomposing IIT by using unit value measures, which was later utilised by GHM (1994) and FF (1997) to obtain an index on the measurement of HIIT and VIIT. Both methods rely on the same
10 HIIT is derived from the “love of variety” model pioneered by Krugman and “most preferred variety” type of model pioneered by
Lancaster (for details, see Greenaway et al. 1994). In other words, based on the work of Dixit and Stiglitz (1977) and popularized by Helpman and Krugman (1987), the love of variety (LOV) model has become a standard textbook model for IIT in horizontally differentiated products. On the other hand, VIIT is derived from the models of Falvey (1981) and others that emphasize product differentiation based on quality (for details, see Grubel and Lloyd, 2003).
11 See, Greenaway et al. (1994), Veeramani (1998), Aturupane et al. (1999) and Hu and Ma (1999).
12 For these studies, please see Greenaway et al. (1995), Aturupane et al. (1999), Gullstrand (2002), Diaz Mora (2002), Crespo and
90
assumption regarding the association of price (actually unit values) with the quality of traded products. The decomposition of GHM uses the GL index whereas FF uses the modified version of GHM. In the GHM case a product exhibits HIIT when unit values of exports and imports lie between the interval and exhibits VIIT in the opposite case.
FF index measures the trade overlap by comparing the minimum of imports and exports to their maximum. Trade in an item is considered to be "two-way" when the value of the minority flow (for example imports) represents at least 10% of the majority flow (exports in this case) (Fontagné and Freudenberg, 1997). If the value of minority is below this level, it can be said that there is a one-way trade of inter-industry trade. In the FF case a product exhibits HIIT when unit values of exports and imports lie between the interval and exhibits VIIT in the opposite case.
𝑀𝑖𝑛 (𝑋𝑖𝑡, 𝑀𝑖𝑡) 𝑀𝑎𝑥(𝑋𝑖𝑡, 𝑀𝑖𝑡) > 10%
1
1
1
1
it it it it it it X M X M X MUV
UV
HIIT
GHM
UV
UV
or UV
UV
VIIT
1
1
1
1
1
1
it it it it it it X M X M X MUV
UV
HIIT
FF
UV
UV
or UV
UV
VIIT
LQ VIIT HQ VIIT (α=15%) Since1
1
1
, in the GHM case more products will be classified as VIIT (Azhar and Elliott, 2006). As α getslarger, the difference between these two lower bounds will become larger. The vertical component of IIT can be broken down into high quality VIIT (HQ VIIT) and low quality VIIT (LQ VIIT). In both cases (GHM and FF) the lower bound of VIIT represents LQ VIIT whereas the upper bound represents the HQ VIIT.
Traded products are considered to be similar (or horizontally differentiated) if the export and import unit values differ by less than 15%. The transportation and insurance expenditures are estimated to constitute approximately 15% of the product prices. Therefore, in the calculations ±15% are used. If this range is defined broader, the share of horizontal IIT will rise and the share of vertical IIT will fall.
FF rely on a 15% difference in unit value while GHM have used 15% (as well as 25%) threshold. The two methodologies differ in the measurement of the trade overlap. In GHM, the balanced part of a bilateral trade flow is considered as intra-industry, whereas the trade imbalance is inter-industry. On the other hand, the approach adopted by FF no longer relies on the trade overlap. It is based on a simple algorithm: First, test whether reciprocal trade flows are of an intra-industry nature (imports represent at least x % of exports or vice versa). Second, if the answer is positive, test whether unit values of trade flows are similar or not (up to a y % difference in unit values is allowed). Since the GHM measure is systematically lower than the FF one, in this study FF method is used in order to measure HIIT and VIIT.
According to Stiglitz (1987), the rationale for using UVs as an indicator of quality is the presumption that a variety sold at a higher price will typically be of higher quality than a variety sold more cheaply. On the other hand, there are some problems of using UVs as an indicator of quality. UVs can be calculated per item, per tonne, per kilograms, per metres, etc. According to Greenaway, Hine and Milner (1994), using unit values per item can be problematic since unit prices may be a function of size as well as other characteristics which are more related to quality (for example durability, dependability) and, in some cases, the latter may be inversely related to size. Therefore, a more expensive, large but poorly finished car can be regarded as of lower quality than a smaller, cheaper but well-finished car. They also state that unit values per tonne are similarly problematic. For example, a higher quality product may be made out of heavier material so that its value per tonne is lower than that of an inferior quality item (Greenaway, Hine and Milner, 1994). However, these problems do not prevent the use of UVs in the quality measurement.
5. Empirical Analyses of IIT
5.1. Data Set and Application
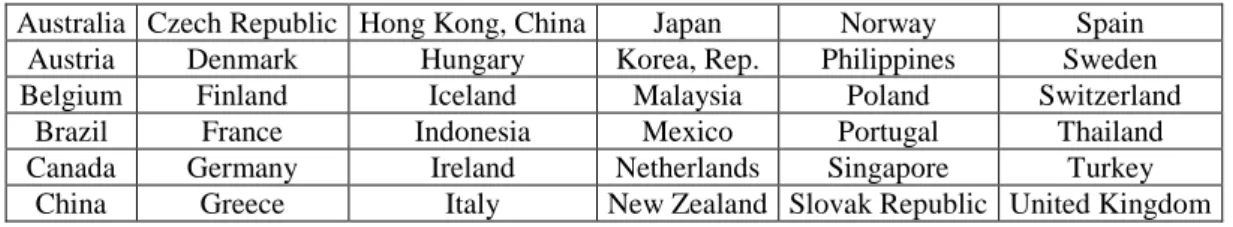
Since the more disaggregated the sector, the more reliable the result of the comparison, in this study calculations are made at a very disaggregated level. The data refer to bilateral trade flows of USA with the 36 main trade partners (Table 1) in automotive industry. The shares of these countries in the automotive exports of US are given in Table 2. According to the figures, Canada and Mexico are the top two export partners of US in automotive products. Germany is the third important partner. China’s share in US automotive exports is also increasing.
91
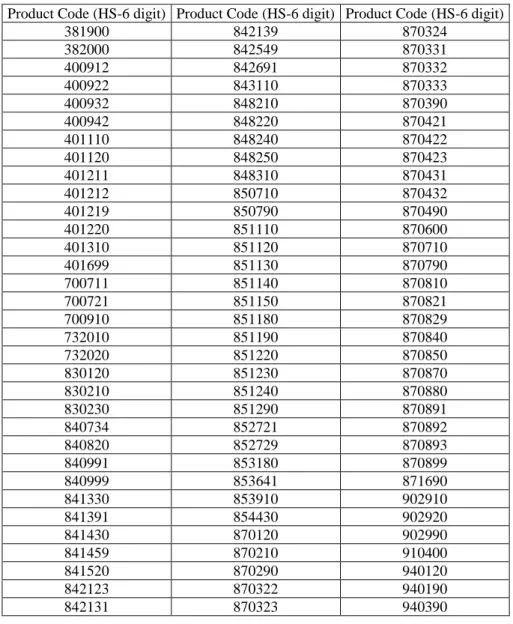
The bilateral trade flows data at the 6-digit HS (Harmonized Tariff System) used in this study were obtained from World Bank’s World Integrated Trade Solution System (WITS) database which covers the 2007-2017 period. There are about 6,000 items at the 6-digit level of the HS. For the measurement of IIT in the automotive industry, 99 items are considered as automotive industry products (motor vehicle products and automobile parts). In Table 3, the HS 6-digit codes of these products are given.
Table 1. Selected Countries in This Study*
*These countries constitute about 95% of USA automotive trade. Source: World Integrated Trade Solution System Database
Table 2. The Share of US Automotive Industry Exports By Countries (%)
Source: Authors’ own calculations.
US Trade Partners 2007 2008 2009 2010 2011 2012 2013 2014 2015 2016 2017 Australia 1,4 1,8 1,8 1,9 2,2 3,1 2,2 2,9 2,5 2,3 2,2 Austria 0,5 0,4 0,2 0,1 0,1 0,1 0,1 0,1 0,1 0,1 0,1 Belgium 1,1 1,1 0,8 0,7 0,8 0,6 0,5 0,7 0,6 0,5 0,8 Brazil 1,0 1,3 1,2 1,4 1,7 1,4 1,3 1,1 1,1 0,5 2,0 Canada 57,6 54,6 53,6 53,8 47,1 46,8 46,8 40,0 43,3 54,8 39,1 China 2,0 2,2 3,6 5,2 7,1 7,1 9,2 12,4 9,8 3,8 11,2 Czech Republic 0,0 0,1 0,1 0,1 0,1 0,1 0,0 0,0 0,0 0,0 0,1 Denmark 0,0 0,1 0,1 0,0 0,0 0,0 0,0 0,1 0,0 0,1 0,0 Finland 0,7 1,0 0,1 0,2 0,4 0,3 0,1 0,1 0,0 0,0 0,1 France 0,8 1,1 1,0 0,8 0,7 0,8 0,6 0,5 0,6 0,6 0,5 Germany 7,8 11,2 8,7 6,6 7,6 6,1 6,0 6,1 6,6 10,7 6,4 Greece 0,0 0,0 0,0 0,0 0,0 0,0 0,0 0,0 0,0 0,0 0,0
Hong Kong, China 0,1 0,2 0,2 0,2 0,5 0,2 0,2 0,3 0,2 0,2 0,2
Hungary 0,1 0,1 0,1 0,1 0,0 0,1 0,1 0,1 0,1 0,1 0,1 Iceland 0,0 0,0 0,0 0,0 0,0 0,0 0,0 0,0 0,0 0,0 0,0 Indonesia 0,1 0,1 0,1 0,1 0,1 0,1 0,1 0,1 0,0 0,0 0,0 Ireland 0,0 0,0 0,0 0,0 0,0 0,0 0,0 0,0 0,0 0,0 0,1 Italy 0,7 0,4 0,4 0,2 0,6 0,4 0,3 0,5 0,8 0,5 0,6 Japan 2,1 2,4 1,8 2,1 2,0 2,3 1,5 1,9 1,6 1,6 1,6 Korea, Rep. 0,9 0,7 0,8 0,9 1,2 1,2 1,2 1,4 1,4 2,4 1,9 Malaysia 0,1 0,1 0,1 0,1 0,1 0,1 0,1 0,1 0,1 0,0 0,1 Mexico 18,1 15,3 20,9 20,6 22,8 24,5 25,0 26,3 25,8 15,4 26,3 Netherlands 0,8 0,7 0,5 0,6 0,6 0,4 0,6 0,5 0,9 0,7 1,3 New Zealand 0,1 0,1 0,1 0,0 0,1 0,1 0,1 0,2 0,2 0,2 0,2 Norway 0,1 0,1 0,1 0,1 0,1 0,0 0,0 0,1 0,1 0,0 0,0 Philippines 0,1 0,1 0,1 0,1 0,1 0,1 0,1 0,1 0,0 0,1 0,1 Poland 0,2 0,1 0,1 0,1 0,2 0,2 0,1 0,2 0,2 0,1 0,2 Portugal 0,0 0,0 0,0 0,0 0,0 0,0 0,0 0,0 0,0 0,0 0,0 Singapore 0,4 0,6 0,7 0,6 0,6 0,6 0,5 0,5 0,4 0,3 0,4 Slovak Republic 0,0 0,0 0,0 0,0 0,0 0,0 0,0 0,0 0,0 0,0 0,0 Spain 0,2 0,3 0,3 0,2 0,2 0,2 0,2 0,3 0,2 0,3 0,4 Sweden 0,3 0,4 0,3 0,3 0,2 0,2 0,1 0,2 0,1 0,1 0,2 Switzerland 0,1 0,1 0,1 0,1 0,1 0,1 0,1 0,1 0,0 0,3 0,1 Thailand 0,1 0,1 0,2 0,2 0,2 0,3 0,3 0,3 0,3 0,2 0,6 Turkey 0,1 0,2 0,2 0,1 0,2 0,2 0,2 0,2 0,2 0,1 0,1 United Kingdom 2,4 3,0 1,7 2,4 2,4 2,2 2,1 2,9 2,5 3,7 3,0
Australia Czech Republic Hong Kong, China Japan Norway Spain
Austria Denmark Hungary Korea, Rep. Philippines Sweden
Belgium Finland Iceland Malaysia Poland Switzerland
Brazil France Indonesia Mexico Portugal Thailand
Canada Germany Ireland Netherlands Singapore Turkey
92
Table 3. Product Codes of Automotive Industry (HS 6-digit)
Product Code (HS-6 digit) Product Code (HS-6 digit) Product Code (HS-6 digit)
381900 842139 870324 382000 842549 870331 400912 842691 870332 400922 843110 870333 400932 848210 870390 400942 848220 870421 401110 848240 870422 401120 848250 870423 401211 848310 870431 401212 850710 870432 401219 850790 870490 401220 851110 870600 401310 851120 870710 401699 851130 870790 700711 851140 870810 700721 851150 870821 700910 851180 870829 732010 851190 870840 732020 851220 870850 830120 851230 870870 830210 851240 870880 830230 851290 870891 840734 852721 870892 840820 852729 870893 840991 853180 870899 840999 853641 871690 841330 853910 902910 841391 854430 902920 841430 870120 902990 841459 870210 910400 841520 870290 940120 842123 870322 940190 842131 870323 940390
Source: Data of these product codes has taken from WITS database.
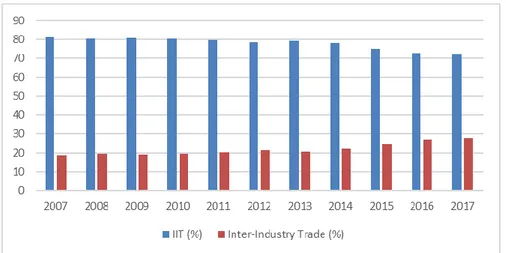
The analyses primarily focus on automotive industry which better fit the concepts of quality and variety. All calculations are based on IIT analyses. In order to see the quality differences between exports of US to its different trade partners, we decompose IIT into its vertical and horizontal components and FF method is used for determining whether trade in a given commodity is vertical (VIIT) or horizontal (HIIT). GL index has been calculated and the automotive products which have IIT have been selected. IIT sectors have been divided according to their IIT type by using FF index and automotive products which are included in HIIT, low-quality VIIT (LQ VIIT) and high-quality VIIT (HQ VIIT) have been signed. Finally, VIIT is divided into its high-quality and low-quality components by using unit value, which is a very simple- but also a very comprehensive- product quality indicator. According to Figure 8, the share of IIT in the automotive sector is always higher than the share of inter-industry trade, but it has a decreasing trend. VIIT dominates HIIT in this 80% percent share of IIT as seen in Figure 9. The share of low and high-quality VIIT generally changes but LQVIIT dominates HQVIIT as depicted in Figure 10.
Unit values of these commodities are calculated by dividing the total values by their respective quantities. Some items that do not have quantity information in the data are excluded from the analysis. Export values are expressed on free on board (f.o.b.) basis and import values are on cost, insurance, and freight (c.i.f.) basis, so the former are multiplied by 1.05 as assumed in Ando (2006) to generate equivalent values.
93
Figure 8. The Share of Intra and Inter-Industry Trade (%) (2007-2017) Source: Authors’ own calculations.
Figure 9. The Share of Horizontal and Vertical Intra-Industry Trade (%) (2007-2017) Source: Authors’ own calculations.
Figure 10. The Share of Low and High-Quality Vertical Intra-Industry Trade (%) (2007-2017) Source: Authors’ own calculations.
94
5.2. Competitiveness and Comparative Advantage
The globalization process increases the importance of competition in trade. Within the globalization context, there are many benefits of improving international competitiveness. Increasing competition in exports creates jobs in the export sector, improves a country’s current account deficit, increases demand for exports by exporting relatively cheaper goods and leads to economic growth.
5.2.1. Revealed Comparative Advantage
𝑹𝑪𝑨𝒊𝒋= 𝑿𝒊𝒋⁄𝑿𝒊
𝑿𝒘𝒋⁄𝑿𝒘
*In our calculations “World” indicates all automotive industry exports of USA.
0 < RCA < 1 USA does not have a comparative advantage in exports of a given automotive product. 1 < RCA < ∞ USA has a comparative advantage in exports of a given automotive product.
5.2.2. Product Mapping
In the following part, the comparative advantages are directly compared with the degree of export specialization of products. In order to develop a product map, RCA index and a Trade Balance Index (TBI) are used. RCA index is modified in order to obtain a symmetric index with values from -1 to +1. This new RCA index is called Revealed Symmetric Comparative Advantage (RSCA), which is provided by Dalum et al. (1998), is neutral at zero and takes the form
𝐑𝐒𝐂𝐀 = (𝐑𝐂𝐀 − 𝟏) (𝐑𝐂𝐀 + 𝟏)
The trade balance reveals whether the country is a net exporter or a net importer for each commodity i, by comparing the net exports with the total trade volume:
T B I = ( X - M ) / ( X + M )
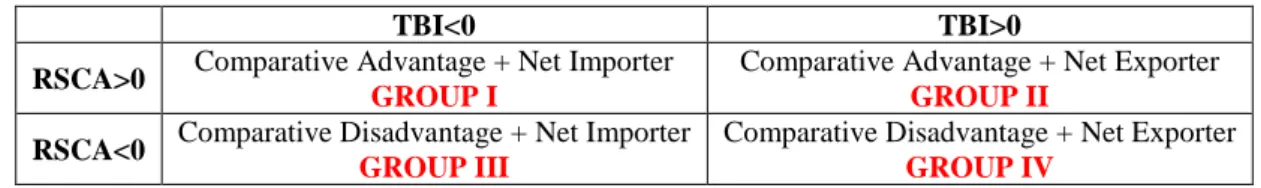
Both indicators yield symmetric values, where the critical value is zero for each. By plotting these indicators into a matrix, the commodities can be divided into four main groups, as presented in Table 4.
Table 4. Product Mapping
Source: Dalum et al.,1998
In products with comparative advantages, there should be an export surplus, whereas in products with comparative disadvantages, exports should play a minor role. Therefore, Groups 2 and 3 are the most important ones. When allocating the products to this map, information on country trade structure can be depicted. If most products are indeed placed in Groups 3 and 4, the assumption of export-specialization by those products with international competitiveness, and imports of those goods with low competitiveness, can be assumed. Especially sectors in Group 1, with relatively high competitiveness but without good export-performance, offer further potential for developing economic strength (Dalum et al.,1998).
5.2.3. Quality and Competitiveness
Competitiveness is a dynamic issue. In the literatüre, unit value is used as an indicator of qualitative competitiveness. The relationship between trade and quality is being increasingly studied by trade economists. The general thought about the quality is that “the higher the price, the higher the quality”. Since prices of goods are not directly observable and difficult
𝑗 Country 𝑖 Commodity 𝑤 World*
TBI<0 TBI>0
RSCA>0 Comparative Advantage + Net Importer
GROUP I
Comparative Advantage + Net Exporter
GROUP II
RSCA<0 Comparative Disadvantage + Net Importer
GROUP III
Comparative Disadvantage + Net Exporter
95
to obtain, researchers have tried to find an indicator for calculating quality. The most simple and comprehensive indicator of quality is the “unit value” which is defined as the nominal exports (or imports) divided into weight (i.e. kilograms, tons, meter, etc.). This indicator can be interpreted as an indicator of the consumer’s evaluation of the product quality. Unit value can be calculated both for exports and imports. According to Greenaway et al. (1994), in models of imperfect competition, increases in unit values signal quality improvements together with growing product differentiation. Therefore, unit values under a broad set of circumstances can be used as a measure of the degree of quality of a product. The idea of Peneder (2009) is that products with higher quality should have a higher value for the buyer and therefore increase the willingness to pay, which is again reflected in high export or import prices.
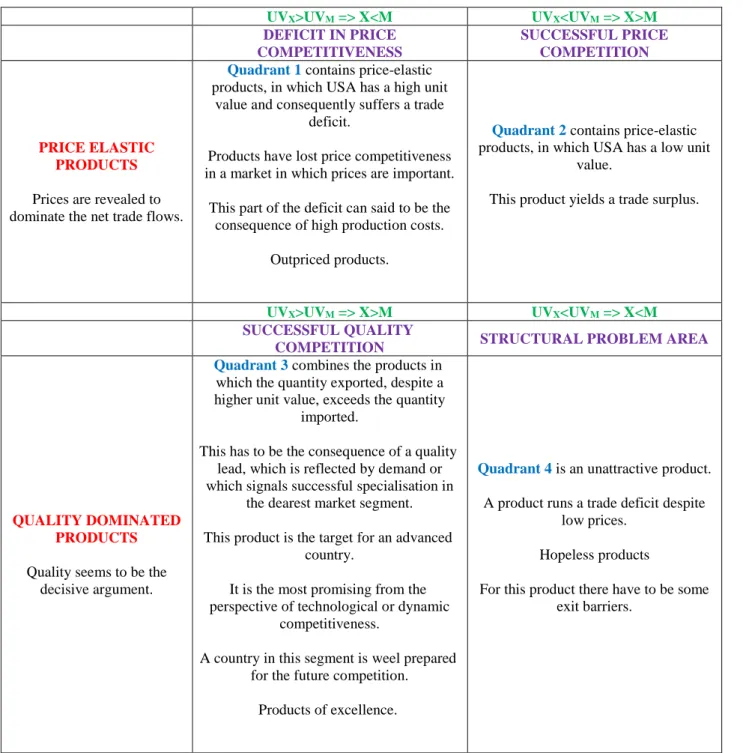
In his study, Aiginger (1998) subdivides markets dominated by price conditions and markets dominated by quality competition into those with a higher or lower export unit value. Aiginger (1998) subdivides the elastic markets (“products” in our case) and the quality-dominated markets (“products” in our case) into markets with higher unit values and those with lower unit values to attain a four-quadrant scheme.
Table 5. Four-Quadrant Scheme of Aiginger
UVX>UVM => X<M UVX<UVM => X>M DEFICIT IN PRICE COMPETITIVENESS SUCCESSFUL PRICE COMPETITION PRICE ELASTIC PRODUCTS
Prices are revealed to dominate the net trade flows.
Quadrant 1 contains price-elastic products, in which USA has a high unit
value and consequently suffers a trade deficit.
Products have lost price competitiveness in a market in which prices are important.
This part of the deficit can said to be the consequence of high production costs.
Outpriced products.
Quadrant 2 contains price-elastic products, in which USA has a low unit
value.
This product yields a trade surplus.
UVX>UVM => X>M UVX<UVM => X<M
SUCCESSFUL QUALITY
COMPETITION STRUCTURAL PROBLEM AREA
QUALITY DOMINATED PRODUCTS
Quality seems to be the decisive argument.
Quadrant 3 combines the products in which the quantity exported, despite a higher unit value, exceeds the quantity
imported.
This has to be the consequence of a quality lead, which is reflected by demand or which signals successful specialisation in
the dearest market segment. This product is the target for an advanced
country.
It is the most promising from the perspective of technological or dynamic
competitiveness.
A country in this segment is weel prepared for the future competition.
Products of excellence.
Quadrant 4 is an unattractive product. A product runs a trade deficit despite
low prices. Hopeless products
For this product there have to be some exit barriers.
96
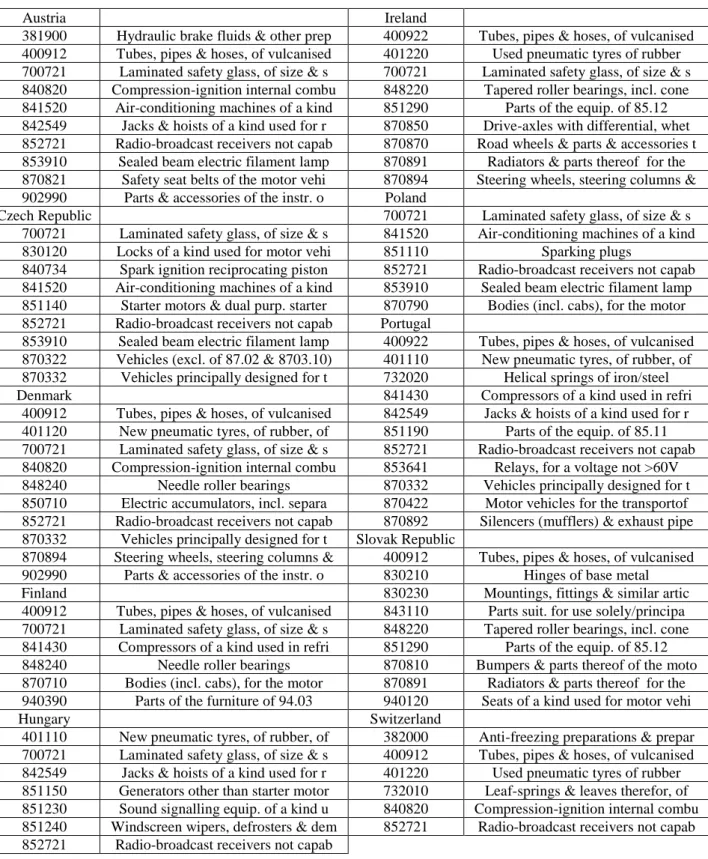
Table 6 shows the problematic trade relations between US and its trade partners. These figures show the
“Structural Problem Area” according to the Four-Quadrant Scheme of Aiginger. Some high income Europe
and Central Asian countries have inter-industry trade rather than intra-industry trade. Also, USA does not have
a comparative advantage in the following automotive products since its RCA index lies between 0 and 1.
According to “Product Mapping” in these products, USA has a comparative disadvantage and it is a net
importer (Group III). Finally, according to the “Four-Quadrant Scheme of Aiginger”, the following products
are in the structural problem area. Even if they are quality dominated products and quality seems to be the
decisive argument, since they are in the fourth quadrant, there have to be some exist barriers for this product.
Table 6. Problematic Trade Relations in Automotive Trade of USA (2000-2017)
Austria Ireland
381900 Hydraulic brake fluids & other prep 400922 Tubes, pipes & hoses, of vulcanised 400912 Tubes, pipes & hoses, of vulcanised 401220 Used pneumatic tyres of rubber 700721 Laminated safety glass, of size & s 700721 Laminated safety glass, of size & s 840820 Compression-ignition internal combu 848220 Tapered roller bearings, incl. cone
841520 Air-conditioning machines of a kind 851290 Parts of the equip. of 85.12
842549 Jacks & hoists of a kind used for r 870850 Drive-axles with differential, whet 852721 Radio-broadcast receivers not capab 870870 Road wheels & parts & accessories t 853910 Sealed beam electric filament lamp 870891 Radiators & parts thereof for the 870821 Safety seat belts of the motor vehi 870894 Steering wheels, steering columns & 902990 Parts & accessories of the instr. o Poland
Czech Republic 700721 Laminated safety glass, of size & s
700721 Laminated safety glass, of size & s 841520 Air-conditioning machines of a kind
830120 Locks of a kind used for motor vehi 851110 Sparking plugs
840734 Spark ignition reciprocating piston 852721 Radio-broadcast receivers not capab
841520 Air-conditioning machines of a kind 853910 Sealed beam electric filament lamp
851140 Starter motors & dual purp. starter 870790 Bodies (incl. cabs), for the motor 852721 Radio-broadcast receivers not capab Portugal
853910 Sealed beam electric filament lamp 400922 Tubes, pipes & hoses, of vulcanised 870322 Vehicles (excl. of 87.02 & 8703.10) 401110 New pneumatic tyres, of rubber, of
870332 Vehicles principally designed for t 732020 Helical springs of iron/steel
Denmark 841430 Compressors of a kind used in refri
400912 Tubes, pipes & hoses, of vulcanised 842549 Jacks & hoists of a kind used for r
401120 New pneumatic tyres, of rubber, of 851190 Parts of the equip. of 85.11
700721 Laminated safety glass, of size & s 852721 Radio-broadcast receivers not capab 840820 Compression-ignition internal combu 853641 Relays, for a voltage not >60V
848240 Needle roller bearings 870332 Vehicles principally designed for t
850710 Electric accumulators, incl. separa 870422 Motor vehicles for the transportof 852721 Radio-broadcast receivers not capab 870892 Silencers (mufflers) & exhaust pipe 870332 Vehicles principally designed for t Slovak Republic
870894 Steering wheels, steering columns & 400912 Tubes, pipes & hoses, of vulcanised
902990 Parts & accessories of the instr. o 830210 Hinges of base metal
Finland 830230 Mountings, fittings & similar artic
400912 Tubes, pipes & hoses, of vulcanised 843110 Parts suit. for use solely/principa 700721 Laminated safety glass, of size & s 848220 Tapered roller bearings, incl. cone
841430 Compressors of a kind used in refri 851290 Parts of the equip. of 85.12
848240 Needle roller bearings 870810 Bumpers & parts thereof of the moto
870710 Bodies (incl. cabs), for the motor 870891 Radiators & parts thereof for the
940390 Parts of the furniture of 94.03 940120 Seats of a kind used for motor vehi
Hungary Switzerland
401110 New pneumatic tyres, of rubber, of 382000 Anti-freezing preparations & prepar 700721 Laminated safety glass, of size & s 400912 Tubes, pipes & hoses, of vulcanised 842549 Jacks & hoists of a kind used for r 401220 Used pneumatic tyres of rubber 851150 Generators other than starter motor 732010 Leaf-springs & leaves therefor, of
851230 Sound signalling equip. of a kind u 840820 Compression-ignition internal combu
851240 Windscreen wipers, defrosters & dem 852721 Radio-broadcast receivers not capab 852721 Radio-broadcast receivers not capab
97 870821 Safety seat belts of the motor vehi 940120 Seats of a kind used for motor vehi
Source: Aiginger (1998)
6. Empirical Results and Conclusions
The automotive sector is an important part of the manufacturing sector, which has attracted a large amount of foreign direct investment, and has been subjected to substantial amounts of IIT during the past few decades and hence deserve special attention for analysis. In this study, US automotive industry trade is examined by decomposing IIT into inter-industry trade, horizontal IIT, and vertical IIT. As a result of the study, it is shown that the share of intra-inter-industry trade decreases as protectionism increases as expected. Even if IIT has a decreasing trend, the increase in vertical IIT in auto-industry shows that the international fragmentation of production process has become important in the US auto-auto-industry. The increase in VIIT is largely due to the expansion of back-and-forth transactions in vertically fragmented cross-border production processes.
In general, IIT in the US automotive industry is dominated by VIIT. While the degree of HIIT remained stable over the 2007-2017 period, the relative significance of VIIT on total IIT of the US automotive industry has increased from 2007 to 2017. The international fragmentation has become an essential part of the US auto-industry since the significant portion of products involves intermediate goods trade between the US and its trading partners. The results show that the USA trade in automotive industry involves the exchange of technologically linked intermediates rather than involving the exchange of different varieties of the same products.
98
REFERENCES
Abbott, Jason. 2003. Developmentalism and Dependency in Southeast Asia: The Case of the Automotive Industry. Book. New York: Taylor and Francis Group.
Abd-el Rahman, Kamal. 1991. “Firms’ Competitive and National Comparative Advantages As Joint Determinants of Trade Composition.” Article. Weltwirtschaftliches Archiv-Review of World Economics 127 (1): 83-97.
Aiginger, Karl. 1998. “A Framework for Evaluating The Dynamic Competitiveness of Countries.” Article. Structural Change and Economic Dynamics 9(2): 159-188.
Ando, Mitsuyo. 2006. “Fragmentation and Vertical Intra-Industry Trade in East Asia.” Article. North American Journal of Economics and Finance, 17: 257-281.
Aturupane, Chonira, Simeon Djankov and Bernard Hoekman. 1999. “Horizontal and Vertical Intra-Industry Trade between Eastern Europe and the European Union.” Article. Weltwirtschaftlisches Archiv 135 (1): 62-81. Balassa, Bela. 1966. “Tariff Reductions and Trade in Manufactures among the Industrial Countries.” Article. American
Economic Review 56 (3): 466-473.
Becuwe, Stéphane and Claude Mathieu. 1992. “The Determinants of Intra-Industry Trade: The Case of the Automobile Industry.” Article. Weltwirtschaftliches Archiv. 128 (1), 34-51.
Boata, Ana., Islam, Mahamoud, Garatti, Alexis., and Ludovic, Subran. 2018. Protectionism. Book. Euler Hermes. Cabral, Manuel, Rod Falvey and Chris Milner. 2009. “Does Skill Content Explain Total Trade and Intra-Industry Trade?.”
Article. Oxford Bulletin of Economics and Statistics 71 (5): 601-619.
Canis, Bill., Villarreal Angeles and Vivian Jones. 2018. NAFTA and Motor Vehicle Trade. Congressionnal Research Center Report.
Chin, Gregory. 2010. China’s Automotive Modernization. Book. New York: Palgrave Macmillan.
Crespo, Nuno and Maria Paula Fontoura. 2004. “Intra-Industry Trade by Types: What Can We Learn from Portuguese Data?.” Article. Weltwirtschaftliches Archiv/Review of World Economics 140 (1): 52-79.
Dalum, Bent, Keld Laursen and Gert Villumsen. 1998. “Structural Change in OECD Export Specialisation Patterns: De-specialisation and "Stickiness".” Article. The International Review of Applied Economics 12 (3): 447-467. Diaz Mora, Carmen. 2002. “The Role of Comparative Advantage in Trade Within Industries: A Panel Data Approach for
the European Union.” Article. Weltwirtschaftliches Archiv/Review of World Economics 138 (2): 291-315. Dicken, Peter 2013. Global Shift. Book. New York: The Guilford Press.
Dixit, Avinash and Joseph, Stiglitz. 1977. “Monopolistic Competition and Optimum Product Diversity.” Article. American Economic Review 67 (3): 297-308.
Dixit, Avinash and Victor Norman. 1980. Theory of International Trade: A Dual, General Equilibrium Approach. Book. Cambridge University Press.
Falvey, Rodney. 1981. “Commercial Policy and Intra-Industry Trade.” Article. Journal of International Economics 11: 495-511.
Falvey, Rodney and Henryk Kierzkowski. 1987. “Product quality, intra-industry trade and (im) perfect competition,” in Henryk Kierzkowski, eds, Protection and Competition in International Trade: Essays in Honor of W. M. Corden, Blackwell, Oxford, pp. 143–161.
Faustino, Hernandez and Nuno Carlos Leitao. 2007. Country-Specific Determinants of Intra-Industry Trade in Portugal. Working Papers. 27. ISEG - School of Economics and Management, Department of Economics, University of Lisbon. Department of Economics.
Fontagné, Lionel and Michael Freudenberg. 1997. “Intra-Industry Trade: Methodological Issues Reconsidered.” CEPII Working Papers: 1.
Greenaway, David, Robert Hine and Chris Milner. 1994. “Country Spesific Factors and the Pattern of Horizontal and Vertical Intra-Industry Trade in the UK.” Article. Weltwirtschaftliches Archiv/Review of World Economics 130 (1): 77-100.
Greenaway, David, Robert Hine and Chris Milner. 1995. “Vertical and Horizontal Intra-Industry Trade: A Cross-Industry Analysis for the United Kingdom.” Article. Economic Journal 105: 1505-1518.
Grubel, Herbert Gunter 1967. “Intra-Industry Specialization and The Pattern of Trade.” Article. Canadian Journal of Economics and Political Science 33 (3): 374-388.
Grubel, Herbert Gunter and Peter John Lloyd. 1971. “The Empirical Measurement of Intra-Industry Trade.” Article. Economic Record 47 (120): 494-517.
Grubel, Herbert Gunter and Peter John Lloyd. 1975. Intra-Industry Trade: The Theory and The Measurement of International Trade in Differentiated Products. Book. New York: John Wiley & Sons.
Grubel, Herbert Gunter and Peter John Lloyd (Ed.) 2003. Intra-Industry Trade. The International Library of Critical Writings in Economics Series. Book. UK: Edward Elgar Publishing, Cheltenham.
Gullstrand, Joakim. 2002. “Demand Patterns and Vertical Intra-Industry Trade with Special Reference to North-South Trade.” Article. Journal of International Trade and Economic Development 11 (4): 429-455.
Helpman, Elhanan. 1981. “International Trade in the Presence of Product Differentiation, Economies of Scale and Monopolistic Competition: A Chamberlin-Heckscher-Ohlin Approach.” Article. Journal of International Economics 11: 305-340.
99
Helpman, Elhanan and Paul Krugman. 1987. Market Structure and Foreign Trade: Increasing Returns, Imperfect Competition and the International Economy. Book. Edition 1. Volume 1. MIT Press Books.
Hu, Xiaoling and Yue Ma. 1999. “International Intra-Industry Trade of China.” Article. Weltwirtschaftliches Archiv/Review of World Economics 135 (1): 82-101.
International Trade Administration. (2018, November 8). Automotive Team: Industry Trade Data. https://www.trade.gov/td/otm/autostats.asp
Ito, Keiko and Masaru Umemoto. 2004. “Intra-Industry Trade in the ASEAN Region: The Case of Automotive Industry.” Article. ICSEAD Working Paper Series: 23.
Jensen, Lars and Teit Lüthje. 2009. “Driving Forces of Vertical Intra-Industry Trade in Europe 1996–2005.” Article. Weltwirtschaftliches Archiv/Review of World Economics.145 (3): 469-488.
Kierzkowski, Henryk. 2011. “A New Global Auto Industry?.” Article. China & World Economy. 19 (1): 63-82. Kojima, Kiyoshi 1964. “The Pattern of International Trade Among Advanced Countries.” Article. Hitotsubashi Journal
of Economics 5 (1): 16-36.
Krugman, Paul 1981. “Intra-Industry Specialization and the Gains from Trade.” Article. Journal of Political Economy 89 (5): 959-973.
Lancaster, Kelvin 1979. Variety, Equity and Efficiency. Book. Oxford: Blackwell.
Lancaster, Kelvin 1980. “Intra-Industry Trade under Perfect Monopolistic Competition.” Article. Journal of International Economics 10: 151-175.
Lefilleur, Julien 2008. “Geographic Reorganization of the European Automobile Sector.” Article. Eastern Economic Studies 46 (5): 71-94.
Leitao, Nuno Carlos, Faustino Horacio. and Yushi Yoshido. 2009. “Determinants of Vertical Intra-Industry Trade in the Automobile Manufacturing Sector: Globalization and Fragmentation.” Technical University of Lisbon, Department of Economics Working Papers No. 06.
Linder, Staffan Burenstam. 1961. An Essay on Trade and Transformation. Book. Almqvist and Wiksell Int. Stockholm 23-105.
Michaley, Michael. 1962. “Multilateral Balancing in International Trade.” Article. American Economic Review 52: 685-702.
Montout, Sylvie, Mucchielli, Jean-Louis and Zignago, Soledad. 2001. “Horizontal and Vertical Intra Industry Trade of NAFTA and MERCOSUR: The Case of Automobile Industry,” Presented at 3rd Annual Conference of European Trade Study Group (ETSG), Brussels, 14-16 September 2001.
Montout, Sylvie, Mucchielli, Jean-Louis and Zignago, Soledad. 2002. “Regionalization and Intra Industry Trade. An Analysis of Automobile Industry Trade in NAFTA.” Article. Revue Region et Developpement 16,: 137-159. Morrison, Wayne. 2018. China-U.S. Trade Issues. Congressional Research Service Report, 30 July.
Nilsson, Lars. 1997. “The Measurement of Intra-Industry Trade between Unequal Partners.” Article. Weltwirtschaftliches Archiv / Review of World Economics 133 (3): 554-565.
OICA. (2018, November 24). International Organization of Motor Vehicle Manufacturers. OICA: http://www.oica.net/category/economic-contributions/
Peneder, Michael. 2009. Sectoral Growth Drivers and Competitiveness in the European Union. European Communities. Luxembourg.
Salim, Ruhul, Amirul, Islam and Harry, Bloch. 2018. "Patterns And Determinants Of Intra-Industry Trade In Southeast Asia: Evidence From The Automotive And Electrical Appliances Sectors." Article. The Singapore Economic Review 63(03): 647-665.
Salvatore, Dominick. 1998. International Economics. Book. Sixth Edition. Prentice Hall. New Jersey.
Stiglitz, Joseph. 1987. The Causes and Consequences of The Dependence of Quality of Price. Article. Journal of Economic Literature 25: 1-48.
Turkcan, Kemal. and Ayşegül, Ates. 2010. “Structure and Determinants of Intra-Industry Trade in the U.S. Auto-Industry.” Article. Journal of International and Global Economic Studies 2 (2): 15-46.
Umemoto, Masaru. 2005. “Development of Intra-Industry Trade between Korea and Japan: The Case of Automobile Parts Industry.” Article. CITS Working Paper Series No. 03.
Veeramani, C. 2009. “Trade Barriers, Multinational Involvement and Intra-Industry Trade: Panel Data Evidence from India.” Article. Applied Economics 41: 2541–2553.
Verdorn, P. J. 1960. The Intra-Bloc Trade of Benelux, in E. A. G. Robinson (Ed.) The Economic Consequence of The Size of Nations. Chapter 19 and Section V. London: Macmillan 291-293 in Grubel, H. G. and P. J. Lloyd (Ed.), Intra-Industry Trade, UK: Edward Elgar Publishing 3-6.
Vousden, Neil. 1990. The Economics of Trade Protection. Book. Cambridge University Press. USA. Williamson, Joel and Chris, Milner. 1991. The World Economy. Book. New York: Simon & Schuster.