I feel obliged to pay my thanks and gratefulness for those who supported me during my scientific journey and helped finishing this these.
A special and sincere appreciation is due for my supervisor (Dr. Mehmet Yıldırım) form the Agricultural Science Faculty in Dicle University/Turkey for his hard work of supervising my research, constant encouragement, and insightful guidance, without whom I wouldn't have finished this thesis.
I also highly appreciate and deeply thank Dr. Veysel Saruhan from the Agricultural Science Faculty in Dicle University for his support.
I would also like to pay regards and appreciation to Prof. Dr. Shirwn Esmael Tawfia, my co-supervisor, for his scientific feedback and critical contribution, whom especially was a great help in drawing my statistical analysis.
A special gratitude goes to my husband (Lazyan Qadir) for his support and valuable remarks, and his continuous help in last several years of my master study. Also thanks and appreciations are necessary to Dr. Kamil Khoshnaw, Dr. Rebaz Khorsheed, and to my friends Bekhal Omar, M. Bestwn O. Rashid, Dr. Aram Omar and for all the facilitation they provided me with during working my my thesis. Last but not least, I would like to sincerely thank my father, mother, and sister as they are simply perfect. I have no words that can fully describe the everlasting love they showed, sacrifices they made, and tremendous support they provided me with.
ACKNOWLEDGEMENTS………..……….I CONTENTS...II Abstract ...III List of tables ...V List of appendix...VI List of abbreviations...VII 1. INTRODUCTION ... 1 2. REVIEW OF LITERATURE... 4 2.1. Diallel Analysis... 4 2.2. Combining ability ... 7 2.3. Gene action ... 10 2.4. Heritability... 12
2.5. Correlation and path analysis ... 14
3. MATERIAL AND METHODS ... 18
3.1. Plant and experiment material ... 18
3.2. Climate of the studied area ... 21
3.3. Evaluated traits ... 23
3.4. Genetic Parameters ... 24
3.5. Statistical analysis ... 24
3.6. Combining Ability Analysis ... 25
3.7. Estimation of General and Specific Combining Ability Effects ...26
3.8. Estimation of Components of variance for both General and Specific Combining Ability .. ...27
3.9. Estimation of Standard error for the differences between the effects of General Combining Ability of two parents ...27
3.10. Estimation of heritability ...28
3.11. Estimation of average degree of dominance ... 29
3.12. Estimation of reciprocal effect ... 29
3.13. Estimation of Combined Analysis of Variance ...30
3.14. Association Analysis...31
3.14.1. Correlation Analysis... 31
3.14.2. Path Coefficient Analysis ... 32
4. RESULTS AND DISCUSSION...34
5. CONCLUSIONS AND RECOMMENDATIONS…….……… 63
6. REFFERENCES...64
CROSS SYSTEM IN SULAIMANY-IRAQ Master THESIS
Banu YASEEN
DEPARTMENT OF FIELD CROPS
INSTITUTE OF NATURAL AND APPLIED SCIENCES UNIVERSITY OF DICLE
2016
Five two rowed barley (Hordeum vulgare L.) were sown in full diallel cross including reciprocals at Qlyasan research station to produce 20 crosses.
Analysis of Variance for full diallel cross during the winter season of 2014-2015, 25 genotypes (F2S +5 parents) were sown in a completely randomized block design (CRBD) with three replications at Qlyasan location.
The analysis of variance indicated that the mean squares for genotype and SCA were highly significant for all characters and also it was highly significant for most studied characters due to GCA and RCA mean squares.
Parent 4 and 5 recorded maximum values for most studied characters, while parent
1 and 3 recorded the lowest value for most characters.
The diallel cross 1x2 recorded the highest value for grain weight/plant with 14.640 (g) and its components number of tillers/plant and number of spike/plant with 13.67 and 10.800, while the diallel cross 3x4 gave the highest value for weight of grains/spike , average spike weight and harvest index with 1.633(g), 1.727(g) and 0.546 respectively.
The diallel crosses 1x3, 1x5 and 2x3 exhibited lowest value for most characters. The reciprocal crosses 5x2 and 5x4 gave the highest value for most studied characters. Maximum positive GCA effect values for grain weight/plant with 1.273 and some its components exhibited by parent 4, while parent 1 gave maximum negative GCA effect values for grain weight/plant with -1.136 and some its components.
The cross 2x5 produced the highest positive SCA effect values for grain weight/plant with 2.798 and some its components , and maximum negative SCA effect values for grain weight/plant with -3.196 and most its components produced by the cross 1x5. The cross 2x1 gave the highest positive RCA effect values for grain weight/plant with 2.597 and some its components, while the cross 5x4 gave the highest negative value due to grain weight/plant with -2.572 and some its components. Parent 4 gave the highest value due to the variance of effect of general combining ability for grain weight /plant with 1.61992 and some its components , while parent 2 showed the lowest value due to the
Parent 2 exhibited maximum the variance of effect of specific combining ability for diallel crosses for grain weight/plant with 6.312 and most its components, while parent 4 gave the lowest value for the variance of effect of specific combining ability for diallel crosses due to grain weight/plant with 0.390 and most its components. Parent 5 produced the highest the variance of effect of specific combining ability for reciprocal crosses for grain weight/plant with 6.464 and most it s components, while parent 2 gave The ratio of the variance of general combining ability/The variance of specific combining ability values were lessees than unity for all studied characters, while the average degree of dominance values for almost all characters were more than unity, indicating the predominance of non-additive gene effect in the inheritance of these characters.
Heritability in broad sense was found to be high for all characters, while heritability in narrow sense was found to be low to moderate due to all characters, signifying the importance of hybridization method to improve these characters.
The grain weight/plant correlated positively and high significantly with grain weight/ spike, number of spike/plant, number of grains/spike , and biological weight/plant , while correlated positively and significantly with harvest index.
The character number of spike/plant gave the highest positive direct effect in grain weight/plant produced by grain weight/spike via biological weight/plant.
Table 3.1.1.
Classification of barley varieties according to some morphological characteristics of the plant during vegetative growth.
18
Table 3.1.2.
Studied breeding materials. 20
Table 3.1.3. Source and origin of parents. 21
Table 3.2.1. Metrological data of Qilyasan location for the
season 2014 – 2015. 21
Table 3.2.2. Physical and chemical properties of the soil at
Qilyasan location. 22
Table 4.1. Mean squares of the variance analysis for
studied characters. 35
Table 4.2. Averages of studied characters for parents and
their F2 Crosse 38
Table 4.3. The estimates of % reciprocal effect values for
reciprocal crosses. 40
Table 4.4. Estimation of GCA effect values for the
parents. 42
Table 4.5. Estimation of SCA effect values for diallel
crosses. 44
Table 4.6. Estimation of RCA effect values for reciprocal
cross 46
Table 4.7. Estimation of the variance due to GCA effect
for the parents 49
Table 4.8. Estimation of the variance due to SCA effect
for the parents 51
Table 4.9. Estimation of the variance due to RCA effect
for the parents 53
Table 4.10. Estimation of some genetic parameters 56
Table 4.11. Correlation Coefficient 59
Table 4.12 Path Coefficient. 61
1.
Analysis of Variance for Full Diallel Cross According to Griffing 1956, Method I, Model I (Parents, Diallel Crosses and Reciprocal Crosses) (Singh and Chaudhary,1985)……… ……….
72
Abbreviation
Detail
ā Average degree of dominance
ār Average degree of dominance for reciprocal
G.R Genotypic Resultant
RCA Specific combining ability for reciprocal crosses
gi General combining ability effect
h2b.s Heritability in broad sense
h2n.s Heritability in narrow sense
H Hemostats
MSe Revised mean squares of experimental error
2
σ Dr Dominance variance for reciprocal crosses
SCA Specific combining ability for diallel crosses
ri Reciprocal combining ability effects
si Specific combining ability effects
σ2 P Phenotypic variance
σ2 A Additive variance
σ2 D Dominance variance
GCA General combining ability
σ2 e Mean squares of experimental error or (Environmental variance)
σ2GCA (σ2gi.) The variance of effect of general combining ability
σ2 RCA(σ2ri.) The variance of effect of specific combining ability for reciprocal crosses
σ2 SCA(σ2si.) The variance of effect of specific combining ability for diallel crosses
σ2 G Genetic variance
1
1. INTRODUCTION
Barley is considered as one of the first cereals domesticated for use by man as food and feed. It is an important rabi cereal crop grown through the temperate and tropical regions of the world. It occupies the fourth position in terms of acreage and third position in terms of crop production. Barley is cultivated on around11% of the world's total area under cereal cultivation. (Anonymous, 2007).
Hordeum vulgare L. is a generally distributed genus of the public Triticeae by the whole of 45 grade and subspecies, consisting of as is the custom weedy regular or versed grasses adapted to the temperate zones of both the northern and southern hemispheres. Cultivated barley (Hordeum Vulgare L. subsp. vulgare) is the reality ̓s fourth virtually important hasty pudding crop trailing wheat, rice, and maize.
A particular botanical feature of domesticated barley is that most cultivars have covered (hulled) caryopses in which the hull (outer lemma and inner palea) is firmly adherent to the pericarp epidermis at maturity but a few cultivars are of a free – threshing variant called naked (hull-less) barley. Both caryopsis types of barley have agronomic value and are used for different purposes. Covered barley is mainly used as an animal feed and for brewing whereas naked barley is preferred for human consumption. Since healthy effects of the soluble fiber rich barley products have been officially canonical and consumers, futuristic interest in nutrition might threw in one lot with the how things stack up of barley as cro magnon man food (Manjunatha, et al., 2011).
Barley (Hordeum analyzes L.) belongs to the genus Hordeum in tribe Triticeae of the family Poaceae (Gramineae). The basic chromosomes number is, like in all other Triticeae species, x=7 and in the genus, both diploids (2n=14) and polyploids (2n=4x=28 ) and (2n = 6x = 42) occur (Von Bothmer et al.,1995 and Kling and Hayes, 2004 ).
Barley is grown worldwide in many countries and regions with temperate and subtropical climates. Barley in recent years has been the fourth most- produced cereal after maize, rice and wheat with the average of 8 years (2000 – 2008) by 140, 672, 609 and 598 million Mt, respectively (Ullrich, 2011).
2
The choice of an efficient breeding program depends to a large extent on the knowledge of gene action involved in the expression of the character. One of the most appropriate methods of genetic analysis is the generation mean analysis. In this method, epistatic effects, as well as additive and dominance effects, can be estimated. Besides gene effects, breeders would also like to know how much of the variation in a crop is genetic and to what extent this variation is heritable. Because the efficiency of selection mainly depends on additive genetic variance, the influence of the environment and interaction between the genotype and environment (Eshghi and Akhundova. 2010).
One of the problems inbreeding plant genotypes is the presence of relationships between pod characters. To increase the pot yield, the study of direct and indirect effects of pod treats provides the basis for its successful breeding program and hence the problem of pod yield increase can be more effectively tackled on the basis of performance of pod yield traits and selection for closely related characters (Ceyhan and Onedr, 2011).
The structure of the gene effects, i.e. the combinative ability is the indicator for assessment of the parental forms that is being carried broadly in breeding and genetical researches. It has the special important meaning of the choice of the parents who will be used in the creation of new constant and heterotic varieties. It is known that hybrids with higher yield are resaved by genotypes (sorts and lines) with high combinative ability (Turbin et al., 1974).
Different genetic cross designs such as line x tester and diallel analyses were used to estimate gene action of yield and its components in barley. Among these methods, the diallel analysis provides a unique opportunity to obtain a rapid and overall picture of genetic control of a set of parents in the early generation. Additive and dominance effects can be estimated. Beside gene effects, breeders would also like to know how much of the variation in a crop is genetic and to what extent this variation is heritable. This is due to the fact that efficiency of selection mainly depends on additive genetic variance, influence of the environment and interaction between genotype and the environment (Acquaah, 2007).
3
The main objective of this study is to evaluate the performance of five barley varieties their diallel, and reciprocal crosses which were appeared to be tested before at our location for the following parameters:
1 – Gene action controlling the inheritance of yield and its components and other morphological traits.
2 – Combining ability of parents and specific for alleles and reciprocal hybrids. 3 – Heritability in the broad and narrow sense.
4 – Average degree of dominance.
4
2.
LITERATURE REVIEW
The diallel analysis is one of the biometrical techniques that have been used extensively to gain combining abilities information in various crops (Iqbal, 2004).
2.1. Diallel Analysis
The diallel is defined as making all possible crosses in a group of genotypes. It is the most popular method used by breeders to obtain information on the value of varieties as parents, and to assess the gene action in various characters. This technique was developed by Jinks and Hayman (1953); Jinks (1954, 1956); Hayman (1954 a, b, 1957 and 1958), and Griffing (1956).
The option will change depending on the material used. In maize, for pure lines, the most logical choice would be to use one or two sets of crosses without parents. Otherwise, competition effects would be important. Contrarily, if we use synthetic varieties we can use diallel mating designs including not only crosses but also parents to compare mean performance and heterosis. Based on the previous information we can see that one limitation of the diallel design is the number of parents that can practically be included (Griffing, 1956). A diallel forsake is a mating step by step diagram used by tell a little white lie breeders, as lightly as geneticists, to confirm the internal underpinnings of quantitative traits.
There are four main types of diallel mating design:
Full dialleL in which parents and dependent crosses are engaged along by the whole of F1.
Half diallel with parent and without reciprocal crosses. Full diallel without an inclusion of parents.
5
In a all over but the shouting diallel, for the most part parents are crossed to the way one sees it hybrids in generally possible combinations. Full alleles charge twice as large amount crosses and entries in experiments but support for mostly working for maternal and paternal effects (Crusio, 1987). "Maternal effect" should not be confused with maternal inheritance, in which some aspect of an offspring's genotype is inherited solely from the mother. This is often attributed to maternal inheritance of mitochondria or plastids, each of which contains its own genome. Maternal inheritance is distinct from maternal effect inheritance because in maternal constitution the individual's phenotype reflects its seize genotype, preferably than the genotype of a parent. In consider, a paternal chance is when a phenotype bear the genotype of the elder, preferably than the genotype of the individual (Yasuda et al., 1995).
The first who used diallel cross were (Sparague and Tatum, 1942) working on maize to determine the general and specific combining ability. (Jinks and Hayman, 1953) by leading diallel analysis methods and estimation of the general and specific combining ability and their variances. The system employing diallel crosses has been used by several authors, e. g.: (Whitehouse et al., 1958 and Aastveit and Frogner, 1963 on wheat; Leffe and Weiss, 1958 on soybeans ; Aksel and Johnson, 1961; and Aastveit,1961 on barley; Dickson, 1967 on snap beans).
Diallel crosses have been mostly used in genetic consider to runs it up a flagpole the genetic make up of consistent traits intervening a exist of genotypes. These were devised, specially, to assess the combining privilege of the parental lines for the final cause of agape of fine and dandy parents for act with regard to in hybrid knowledge programs (Malik et al., 2004).
Plant breeders frequently need overall information on the average performance of individual inbred lines in crosses- known as general combining ability, for subsequent choosing the best among them for further breeding. For this purpose, diallel crossing techniques are employed (Himadri and Ashish, 2003).
Diallel mating designs provide the breeders with useful genetic information, such as general combining ability GCA and specific combining ability SCA, to help them devise appropriate breeding and selection strategies (Zhang et al., 2005).
The mechanical procedures for making the diallel crosses will vary among crop species (self- vs. cross-pollinators) and within crop species (inbred vs. noninbred parents). If the parents are relatively homozygous (inbred lines), the series of diallel crosses can be made by repeating each parent for each combination of crosses and making paired-row crosses; the only limitation to the number of plants included and cross-pollinated for each pair-row cross is the quantity of seed needed for testing the crosses. By use of paired-row crosses, seed produced on each parent can be bulked for each cross-combination or kept separate if each cross-permutation is desired (Hallauer et al., 2010).
6
Diallel crosses among a set of maize populations are handled similarly to inbred lines, but the sampling of the population genotypes increases the number of individual plants included in the population crosses. The amount of seed usually is not a problem, but the number of crosses between different plants required to sample the populations increases the space and time needed. Several sets of pair rows per cross are recommended to increase the sample size. Also, detasseling males after crossing can make the sample more representatives with the advantage of reducing a future number of pollinations. Shoot bags from males can also be removed. Crosses between 10 plants of inbred lines may be sufficient for seed needs whereas many more are necessary to adequately sample the genotypes in a population (Hallauer et al., 2010).
Various forms of diallel crosses play an important role in evaluating the breeding potential of genetic material in plant and animal breeding. Genetic properties of inbred lines in plant breeding experiments are investigated by carrying out diallel crosses. Complete diallel cross designs involve equal numbers of occurrences of each of the p (p − 1)/2 distinct crosses among p inbred lines (Das et al., 1998).
Diallel mating designs have proved informative in determining the inheritance of quantitative traits of interest to plant breeders. Apart from the well-established analyses of a complete diallel, the two-way factorial data structure of this design lends itself to analysis by the additive-main-effects-and multiplicative-interaction (AMMI) model (Ortiz et al., 2001).
The choice of any of the several alternative breeding procedures to be adopted for an amelioration of a crop primarily depends upon the nature and magnitude of gene actions involved in the expression of different characters and mating flexibilities (Chaudhary et al., 1977).
7
2.2. Combining Ability:
It is defined as the strain ability of superior hybrid production, through crossing with other strain in comparison with the mean of difference crosses of strain with others (Ahmed, 2003).
It is defined as the ability of a parent line in hybrid combinations. It plays an important role in selecting superior parents for hybrid combination and studying the nature of genetic variation (Kambal and Webster, 1965 and Duvick, 1999).
Combining Ability is divided in to two types:
A. General combining ability.
Is the average performance of strain in a series of cross combinations.
B. Specific combining ability.
Is the deviation in performance of cross combination from that predicted on the basis of general combining ability of the parents involved in a cross (AGB301, 2004).
Sprague and Tatum (1942) introduced the concepts of GCA and SCA to distinguish between the average performance of parents in crosses (GCA) and the deviation of individual crosses from the average of the margins (SCA). The concept of GCA and SCA are extensively used in plant breeding and have particular significance to the diallel mating design. Precisely such a system can be defined in terms of general and specific combining ability.
They defined that term of GCA is used to designate the average performance of a line in hybrid combination. The term SCA is used to designate those cases in which certain combination do relatively better or worse than it would be expected on the basis of the average performance of the lines involved (Ahmed, 2003 and Chawdhary, et al., 1998).
Combining ability describes the breeding value of parental lines to produce hybrids. The concept of combining ability is becoming increasingly important in plant breeding. It is especially useful in connection with testing procedures, in which it is desired to study and compare the performances of lines in hybrid combination (Griffing, 1956; Basal and Turgut, 2003).
8
Combining ability analysis helps in identification of desirable parents and crosses for their further exploitation in breeding program (Verma et al., 2007).
It has been indicated that both general and specific combining ability variances were important in controlling the inheritance of the traits studied. However, GCA variance was predominating; the relatively higher magnitude of (GCA × Environments) interactions suggested a higher sensitivity of GCA to the environment than that of SCA (Bhathagar and Sherma, 1977).
The importance of the concept of combining ability has been widely appreciated both in plant and animal breeding. The concept is especially significant in a breeding program where it is desired to use genotypes which would combine well in hybrid combinations (Hayes and Paroda, 1974).
Combining ability analysis is important in identifying the best parents or parental combinations for a hybridization program. General combining ability GCA is associated with additive genetic effects while specific combining ability SCA is associated with non-additive genetic effects. GCA is the average performance of a line in hybrid combination and SCA is the deviation of crosses based on an average performance of the lines involved (Makumbi, 2005).
Analysis for GCA and SCA in barley involving nine diverse parents and their 36 F1 and F2 progenies indicated significant differences among the parent for GCA and among crosses for SCA for the traits days to heading (75%), days to maturity (75%), plant height, effective tillers per plant, spike length, number of grains per spike, test weight, biological yield per plant, grain yield per plant and harvest index.The GCA and SCA components of variance were significant for those traits (Kakani et al., 2007).
10 F1 and F2 hybrids were obtained through the diallel crossing of five divergent two-rowed barley cultivars for examination of the mode of inheritance and combining ability for grain weight per barley plant. The analysis of variance of combining abilities was made following the method 2, a mathematical model I, for the incomplete diallel. Highly significant differences were found for the general (GCA) and special (SCA) combining abilities in the F1 generation which showed that the grain weight per plant in these investigations was dependent on genes with additive and non-additive or dominant effects. The GCA variance was higher in the F1 generation than the SCA variance. Positive GCA values were also determined with two of the five parents, the cultivar Jagodinac in F1 generation being the best general combiner for grain weight per plant (Madic et al., 2007).
9
The knowledge of inheritance mode is a permanent requirement in successful plant breeding. Grain weight per plant had been investigated in a trial consisting of 4 divergent barley varieties grown in 4x4 diallel. ANOVA of combining ability showed the crucial importance of the values for GCA and SCA. This indicates the presence of both, additive and non-additive components in the inheritance of grain weight per plant.
The value of the component of additive variance is greater than that of the dominant (H1 and H2), indicating that genetic variance of the mass of grains per plant depends mainly on the effects of genes with additive effects. The results were strongly influenced by parental divergence and complexity of the inheritance system for the trait in a study (Akgun and Topal, 2011).
10
2.3: Gene action:
The choice of an efficient breeding program depends to a large extent on the knowledge of gene action involved in the expression of the character (Eshghi and Akhundova, 2009).
The understanding of gene action is of paramount importance to plant breeders. Alleles with a dominant, additive or deleterious phenotypic effect influence heritability differently depending on whether they are in homozygous or heterozygous condition (Tawfiq, 2004).
Knowledge of various types of gene action and their relative magnitudes in controlling various traits is basic to a maximizing efficiency of a breeding program.To increase the yield of barley requires certain information regarding the nature and magnitude of gene actions involved in the expression of quantitative traits of economic importance in a hybridization program. The diallel analysis also provides a unique opportunity to obtain a rapid and overall pictures of genetical control of a set of parents in the early generation (Acquaah, 2007).
Additive genetic variance is of universal occurrence in plant breeding populations. Non-additive variance also exists, but is general, smaller in magnitude than the additive one. In natural plant populations, additive genetic variance is predominant, which is closely followed by dominance variance. Epistatic variance is the lowest in magnitude (Falconer and Mackay, 1996 and Naryanan and Singh, 2007).
Yap and Harvey (1972) in seven-cultivar of barley diallel cross, reported that a genetic effect was found rather than an environmental effect on the expression of grain yield, tillers per plant, kernel weight, kernels per head, flag leaf area, and culm diameter. Also, additive gene action was the most important contributors to the inheritance of these traits. A five divergent genotypes of two-rowed winter barley have been selected for diallel crossing in order to study the mode of inheritance, the gene effect and the components genetic variance for the productive tillering in F1 and F2 generation. The variability of the investigated trait differed.
11
Different modes of inheritance (partial dominance, dominance, and overdominance) and partial dominance were found in the F1 and F2 generation, respectively. The genetic variance components, an average degree of dominance indicated partial dominance in the inheritance of tillering (Madic et al., 2006).
In a five diverse parents full diallel cross of six-rowed barley and their 20 F1 progenies at Qilyasan, Fatieh (2012) reported the importance of non-additive effect in the inheritance of the characters number days to 50% anthesis, plant height, number of spike per plant, spike length, number of grains per spike, grains weight per spike, average spike weight, spike weight per plant, grains weight per plant, biological weight per plant, harvest index, 1000 grain weight, and flag leaf area. Dominance gene action was important in the inheritance of 1000-grain weight. In another study, (Baghizadeh, et al.), (2003), showed that dominance and additive × additive [i] interaction as well as dominance × dominance [1] epistasis were important for inheritance of this trait Wu and Takeda, (1995), opine that in general 1000-grain weight was governed by additive, dominance and not –allelic interactions. Also, Kularia and Sharma,(2005), Prakash et al., (2005) and Nakhjavan, et al., (2010), reported different types of epitasis for this trait in barley under no- stress and drought conditions.
A significant amount of genetic variation was observed for most of the plant characteristics, days took to heading and maturity, grain filling period, flag leaf area, plant height, spike lenght per spike, grains per spike, biomass, 1000 grain weight and harvest index (Gurmani, et al.,2006).
The role of both additive and non-additive effects to grain yield and its component characters in barley have been reported by (Choo, et al., 1988; Bhatnagar and Sharma 1995; 1998). Both additive and non-additive components were important but dominance components were more predominant than additive components in controlling the inheritance of all the characters under study (Rohman, et al., 2006).
12
2.4: Heritability:
The success of breeders in changing the characteristics of a population depends on the degree of corresponds between phenotypic and genotypic values. A quantitative masseur, which provides information about the corresponds between genotypic variance and genotypic variance, is heritability. The term heritability has been future divided into broad sense and narrow sense, depending weather it refers to the genotypic value or breeding value, respectively. The ratio of genetic variance to phenotype variance ( VG/VP ) is called heritability in the broad sense or genetic determination. It expresses the extent to which individual phenotypes are determined by the genotypes ( Gebre, 2005 ).
There are two conceptions for heritability, the first is broad sense heritability, and the second is narrow sense heritability that used widely in the estimation of selection efficiency, by determination the differences resulted from additive gene action. Heritability has the variable value, changed according to the differences in character studied, genetic materials test, environmental factor that evaluated (Eberhart, 1971 ).
Arnel et al. (2010) noticed, that heritability is the degree of correspondence between the phenotype and the breeding value of an individual for a particular trait.
Recently, Singh (2012) analyzed the data from 60 barley entries including varieties and genotypes conducted in two consecutive years. The estimate of heritability served as a useful guide to the breeder. In the year-I estimated broad sense heritability showed that it was high for all the characters (above 70%). Grain per spike showed the highest heritability. In the year-I, high heritability was observed for grains per spike, grain yield plant ¹ , a length of awn, a length of flag leaf, spike length, ear bearing tillers, ־ peduncle length, a number of tillers plant ¹ and days to maturity. In year-II, more ־ characters had high heritability. The highest heritability estimate was recorded for a number of grains spike ¹ . In the year-II, high heritability coupled with high genetic ־ advance was observed for a number of grains spike ¹ followed by grain yield plant־ ,¹־ 1000 grain weight, plant height, flowering days, peduncle length, a length of a spike, awn length, days to maturity, flag leaf length and rear bearing tillers.
In pooled data, heritability estimates were highest for a number of grains spike ¹ . ־ In this study, high heritability along with high genetic advance was observed for a number of grains spike ¹ while high heritability along with low genetic advance was ־ observed for days to maturity and grain length.
13
Kakani and Sharma (2010) noticed that narrow-sense heritability estimates obtained in component analysis ranged from low to high for different characters. The narrow sense heritability estimates were moderately high for days to heading in E2; flag leaf area in E1, E3 and E4; number of grains per spike in E2 and test weight in E1, while it was low for number of grains per spike in E1 and E4 and moderately low for test weight in E4 for F1, but for F2, it was moderately low for plant height in E1, flag leaf area in all the environments; spike length in E1, E3, and E4; number of grains spike ¹ in ־ E1; test weight in E1 and E4 and grain yield plant ¹ in E־ 2 and low for days to heading in E2.
Heritability estimates as would be expected were, in general, high in F1 in comparison to F2. The results clearly indicated that the degree of heritability was much influenced by the environment and generations. High estimates of heritability in the broad sense were recorded for plant height, the number of grains per spike and number of tillers. These traits can be used for the indirect improvement of yield. If the heritability of a trait is high, we can apply selection to improve that trait. The amount of heritability for yield was 0.55. Most probably, the high genetic variance for this trait has led to calculating its heritability become more than its actual value (Eshghi and Akhundova, 2009).
Okeno, (2001) reported significant genotypic variation, for length and width of flag leaf, plant height and yield per plant, indicated possibility of selection response in these traits in spring barley. The highest heritability was obtained for a number of grains per spike in normal condition and number of tillers in both environments, indicating that these traits are controlled by additive effects. Because of low genetic gain and heritability for grain yield compared to other characters, selection based on yield components is recommended (Eshghi, et al., 2010).
High estimates of heritability in the broad sense were recorded for 1000-grain weight and number of grains per spike followed by biological yield per plant and grain yield per plant. The characters, which showed higher estimates of genetic advance coupled with higher estimates of heritability reflecting additive gene action, were grain yield per plant and number of grains per spike followed by biological yield per plant (Chand, et al., 2008).
14
2.5. Correlation and Path analysis:
A. Correlation:Relationships between two metric characters can be positive or negative, and the cause of correlation in crop plants can be genetic or environmental (Gebre, 2005).
Correlation analyzes indicated that the grain yield was positively and significantly associated with all the yield components except 1000-kernel weight. The highest correlation coefficients were found between grain yield and kernel number per spike (r = +0.406), and between grain yield and harvest index (r = +0.474) (Budaklicarpici and Celik, 2012).
The correlation analysis showed that grain yield had positive and significant simple correlation with number spike/m², harvest index, biological and straw yield, and negative correlation with spike length and awn length. The highest positive correlation was obtained between biological yield and grain yield. Using stepwise regression, 1000 kernel weight, and a number of spike/m², kernel per spike and harvest index was the most important yield component (Drikvand, et al., 2011).
Studies on correlation of yield and its components in Hordeum vulgare L. by Drikvand et al. (2011) in a fifteen genotypes of hulless barley under rainfed condition revealed that grain yield had positive and significant simple correlation with number of spike per m2, harvest index, biological and straw yield, and negative correlation with spike length and awn length. The highest positive correlation was obtained between biological yield and grain yield.
Emine and Necmettin (2012) assessed the correlations between grain yield and
yield components and to measure the direct and indirect effects of yield components on grain yield in ten two-rowed barley under the ecological conditions of the coastal zone of northwest Turkey for two years by using correlation coefficient and path analysis methods, respectively. Correlation analysis indicated that the grain yield was positively and significantly associated with all the yield components except 1000-kernel weight. The highest correlation coefficients were found between grain yield and kernel number per spike (r = +0.406), and between grain yield and harvest index (r = +0.474). Results of path analysis indicated that harvest index had the greatest direct effect (+0.7716) on grain yield followed by spike number per m2 (+0.3359) and kernel number spike-1 (+0.2081). Percentages of their direct effect were 71.97%, 48.47%, and 28.22%, respectively. On the other hand, most of the indirect effects of yield components on grain yield were found to be significant and positive. Because of the significant effects of the harvest index, spike number per m2 and kernel number spike-1 on grain yield, they may be regarded as criteria for barley improvement and breeding programs. Grain yield in barley is a complex trait affected directly or indirectly by every gene present in the plant.
15
B . Path Coefficient Analysis:
Path coefficient analysis was suggested by Wright (1921) and described by Dewey and Lu (1959) which was calculated to detect the relative importance of characters contributing to grain yield (Selvaraja and Nagarajan, 2011).
It has been applied to a vast array of complex modeling areas, including sociology and econometrics (Dodge, 2003).
Miller and Rawling (1967) suggested that intermating population breakage of coupling linkage reduced the correlation while breakage of repulsion linkage increased the correlation. All these results suggest that the linkages in both coupling and repulsion phases are operative in a genetical association of yield and yield components. A path-coefficient analysis is one of the reliable statistical techniques which allow quantifying the interrelationships of different components and their direct and indirect effects on grain yield through correlation estimates.
Bhutta and Ibrahim ( 2005) in a six- rowed barley genotypes, concluded that there were the significant positive correlation between grain yield with 1000- grain weight and a number of spikelets spike-1, grain yield was the negative correlation with days to heading. Path coefficient analysis revealed that positive maximum association between Peduncle length and number of spikelets with grain yield, extrusion length and spike density had maximum negatively association with grain yield.
Ataei (2006) reported that grain number in spike with a direct effect on yield was the most important factor. The direct effect of 1000- kernel weight and a number of the spike on yield were positive also. The path-coefficient analysis is one of the reliable statistical techniques which allow quantifying the interrelationships of different components and their direct and indirect effects on grain yield through correlation estimates.
By means of path analysis of heritability correlation coefficients, researchers found that in barley ear length and grain weight per ear have a great direct influence on plot yield, whereas effective and ineffective grain number per ear have little direct influence on the plot yield but they have considerable indirect negative influence on plot yield through other characters. Total grain number per ear has a considerable direct negative influence on plot yield. Plant height has a considerable indirect positive influence on plot yield through other characters (ShouFu, et al., 1990).
16
Path analyzes indicated that harvest index had the greatest direct effect (+0.7716) on grain yield followed by spike number per m² (+0.3359) and kernel number per spike (+0.2081). Percentages of their direct effect were 71.97%, 48.47%, and 28.22%, respectively. On the other hand, most of the indirect effects of yield components on grain yield were found to be significant and positive. Because of the significant effects of the harvest index, spike number per m² and kernel number per spike on grain yield, they may be regarded as criteria for barley improvement and breeding programs (Budaklicarpici and Celik, 2012). Path coefficient analysis revealed that positive maximum association between peduncle length and number of spikelets with grain yield, extrusion length, and spike density had the maximum negative association with grain yield (Buttha et al, 2005).The direct effect of 1000- kernel weight and number of the spike on yield was also positive. A number of spike /m² had the highest positive direct effect on grain yield, This indicated that regarding the constant of other variables, an increase of this trait, grain yield has been increased (Ataei, 2006 and Drikvand, et al., 2011).
Path coefficient analysis revealed that positive maximum association was found between peduncle length and no of spikelets with grain yield. Extrusion length and spike density had the maximum negative association with grain yield (Bhutta, et al., 2005). Ganusheva, (1992) found that grain number per plant and 1000 grain weight had the greatest direct effect on grain weight per plant.
18 3.1.
Plant and experiment material.
The present study was conducted at Kurdistan region -Iraq, Qilyasan Agricultural Research Station, Faculty of Agricultural Sciences, University of Sulaimani (35° 34′ 307″ N, 45° 21′ 992″ E and 765 masl), 2 Km North west of Sulaimani city. To evaluate the performance of 20 F2s crosses, created by full diallel system prepared previously and their parents at 2014- 2015. Five varieties and pedigree of two – rowed barley (Hordeum distichum L.) were used as fallows:
1-MORA/NB1054/3/MOLA/SHYRI//ARUPO*2/JET/4/…CBSS99M00293TG-5M-1Y-1M-0Y ( hybraed ) 2-ABN-B/KA-B//RAISA/3/ALELI/4/LIMON/5/... CBSS99M00228 T-K-6M1Y - 1M-0Y ( hybraed ) 3-Arabi award 4-Clipper 5-Booth H1
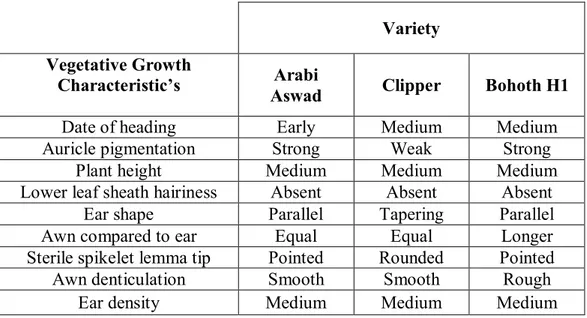
Table 3.1.1. Clasification of barley varaieties acording to some morphological characteristics of the plant during vegetative growth.
Variety Vegetative Growth
Characteristic’s Arabi
Aswad Clipper Bohoth H1
Date of heading Early Medium Medium
Auricle pigmentation Strong Weak Strong
Plant height Medium Medium Medium
Lower leaf sheath hairiness Absent Absent Absent
Ear shape Parallel Tapering Parallel
Awn compared to ear Equal Equal Longer
Sterile spikelet lemma tip Pointed Rounded Pointed
Awn denticulation Smooth Smooth Rough
19
Kamil Mahmood Mustafa to completed this work the seeds were sown in the field experiment on November 15th – 2014 in a randomized complete block design (RCBD) using computer programs (Statistical Social Science, JMP, Ver-7, SAS Institute Inc.). with three replication. Each treatment was three rows of 3-meter length, 40 cm between rows and 20 cm between plants within a row. Statistical analysis using full diallel cross technique were implemented as described by (Griffing, 1956).
All cultural practices were performd normaly in all treatments as recommended for barley prodaction, at rainfed regions. The experimend was harvested on May 15th – 2015.
20
No Diallel, Reciprocal Crosses and Parents Number
Parentage
1 1x2 MORA x ABN
2 2x1 ABN x MORA
3 1x3 MORA x Arabi aswad
4 3x1 Arabi aswad x MORA
5 1x4 MORA x Clipper
6 4x1 Clipper x MORA
7 1x5 MORA x Bohoth H1
8 5x1 Bohoth H1 x MORA
9 2x3 ABN x Arabi aswad
10 3x2 Arabi aswad x ABN
11 2x4 ABN x Clipper
12 4x2 Clipper x ABN
13 2x5 ABN x Bohoth H1
14 5x2 Bohoth H1 x ABN
15 3x4 Arabi aswad x Clipper
16 4x3 Clipper x Arabi aswad
17 3x5 Arabi aswad x Bohoth H1
18 5x3 Bohoth H1 x Arabi aswad
19 4x5 Clipper x Bohoth H1 20 5x4 Bohoth H1 x Clipper 21 1 MORA 22 2 ABN 23 3 Arabi aswad 24 4 Clipper 25 5 Bohoth H1
21
3.2. Climate of the studied area.
In tables ( 3.2.1. and 3.2.2. ) below are shown brief description of the soils and climates under studied.
Table ( 3.2.1. ) Metrological data of Qilyasan location for the season 2014 – 2015.
Parents Source Origin
1 (pedigree line) Center Research of Sulaimani ICARDA 2 (pedigree line) Center Research of Sulaimani ICARDA 3 (cultivar) Center Research of Kalar ICARDA 4 (cultivar) Center Research of Erbil Australia 5 (pedigree line) Center Research of Erbil ICARDA
Data Qiyassan Location
Min Temp ( Cº ) Max Temp ( Cº ) Monthly Avg. Temp ( Cº ) Precipitation Oct. 9.1 34.4 20.4 4.2 NOV. 2.9 22.2 12.0 151.6 DEC. 2.2 17.9 9.2 128.6 JAN. -3.2 16.6 6.8 100 FEB. 0.2 19.8 8.8 65 MAR. 3.2 22.0 12.0 94.8 APR. 5.0 32.2 16.7 29.4 MAY. 11.2 36.9 24.6 19.8
22
Soil properties Qilyasan
PSD Silty clay Sand % 5.92 Silt % 43.28 Clay % 50.8 E.C. (ds.m-1) 0.46 PH 7.17 Organic matter % 1.8 Total Nitrogen % 0.66 Available phosphate (ppm) 5.2 CaCO3 (%) 26.5
Soluble Cations & Anions mmole -1 Ca ++ 2.1 Mg++ 0.9 K+ 0.17 Na+ 0.63 Co3-2 0.00 HCO3-2 2.77 Cl 0.13 SO4-2 0.79
23
Data of agronomic traits were recorded from five plants of each genotype from each replications as fallows:
1.
Plant height: is the average distance in centimeters from the ground to the tip of the spike (excluding the awns) at maturity.2.
Plant tillers number: is the average of total number of tillers counted from each selected plants at harvesting time.3.
Plant spikes number : is the average of total number of spikes counted from each selected plant at harvesting time.4.
Plant spikes weight: is the average weight of the spikes from the plant samples collected during threshing, expressed in metric grams.5.
Spike length: was recorded as the distance in centimeters from the lowest spikelet to the tip of the spike at maturity (without awn).6.
Spike grains number : is the average number of grains spike-1 in each row, harvested.7.
Spike grains weight : is the weight of the grain harvested, expressed in metric grams per spike8.
Average spike weight: is average weight of the spike from the spike sample collected during threshing, expressed in metric grams.9.
1000- grain weight: is the weight of 1000 seeds in grams, from grains samples collected during threshing.10.
Plant grain weight : is the average weight of grains from the plant samples collected during threshing, expressed in metric grams.11.
Plant biological yield : is the above ground biomass per plant which was recorded by weighing the whole plant including straw and grains, from the plant samples collected during threshing, expressed in metric grams.12.
Harvest index (%): is the proportion of grain weight plant-1 to biological weight plant-1.24
3.4.1. General Combining Ability (GCA) variances and effects 3.4.2. Specific Combining Ability (SCA) variances and effects 3.4.3. Reciprocal Effect %
3.4.4. Broad Sense Heritability h2b.s
3.4.5. Narrow Sense Heritability h2n.s
3.4.6. Average Degree of Dominance (ā )
3.5. Statistical analysis.
Once all genotypes data were collected, data from 25 genotypes were utilized to perform all statistical analysis. Genotypes were considered fixed effects while replications were conceded random effects. The linear model utilized for individual analysis was as follows (Al-Mohammad and Al- Youns, 2000)
ij j i ij
Y
r
j
t
i
,...,
2
,
1
,...,
2
,
1
Where: ijY
: The value of observation belongs to the experimental unit designated : The general mean value,
i
: The value of the actual effect of the treatment “ i ”,
j
: The value of actual effect of the block “ j ”, and
ij
: The value of the actual effect of the experimental error belongs to the
observation designated as treatment “i” in the block “j”. ij~ IND (0, σ²)
25
The (GCA) and (SCA) were estimated using the general linear model for the analysis which takes the formula of (Singh and Chaudhary, 2007).
ijk k ij ij j i ijk
bc
r
R
s
g
g
Y
1
Where:Yijk : observed value of the experimental unit,
µ : populations mean,
gi : general combining ability (GCA) effect for the ith parent
gj : general combining ability (GCA) for the jth parent
sij : specific combining ability (SCA) for the diallel crosses involving parents i and j
Rij : specific combining ability (RCA) for the reciprocal crosses involving parents i and j
rk : replication (block) effect, and
: means error effect.
ijk bc
26
effects.
. .
2 ..1
2
1
Y
P
Y
Y
P
g
i
i
j
. . . .
2 ..1
2
1
2
1
Y
P
Y
Y
Y
Y
P
Y
Y
si
ij
ji
i
i
j
j
Y
ijY
ji
ri
2
1
Where :gi :Effect of expected general combining ability for parents I, si: Effect of expected specific combining ability for single diallel Crosses
ij when i = j,
ri: Effect of expected specific combining ability for single reciprocal Crosses ij when i=j,
Yij : F1s mean as a result of crossing parent i with parent j,
Y.. : Sum of the means of all parents and F1s hybrids, and
27
specific combining ability.
2 2 2 2 p e S M g gi i
2 2 2 2 2 ) 2 2 ( s 2 -p 1 s p p p e S M i i
2 r 2 -p 1 ri i2 2 MSe Where:σ²gi : Variance of expected effect of general combining ability for
parent I, σ² si.: Variance of expected effect of specific combining ability for diallel crosses of parent I,
σ²ri. : Variance of expected effect of specific combining ability for reciprocal crosses of
parent i.
3.9. Estimation of standard error for the differences between the
effects of the general combining ability of two parents, two diallel
crosses and reciprocal crosses, respectively.
p e S M E S gi gj ) ( .
. standard error for the differences between the effects of the general combining ability of two parents.
p e S M p E S Sij Sik ) 1 ( .
. ( ) standard error for the differences between the effects of the
specific combining ability of twodiallel crosses.
e
S
M
E
S
ik ij r r )
(.
.
standard error for the differences between the effects of the specific combining ability of tworeciprocal crosses.28
The term heritability has been further divided into broad sense and narrow
sense, broad sense heritability was calculated by dividing genotypic variance by total variance and narrow-sense heritability was caculated by dividing additive genetic variance by total variance (Singh and Chaudhary, 1985).
σ²G σ²A + σ²D 2 σ² gca + Variance of effict of spicific combining ability for diallel crosses
h²b.s = ـــــــــــــــــ = ـــــــــــــــــــــــــــــــــ = ـــــــــــــــــــــــــــــــــــــــــــ
σ²P σ²A + σ²D + σ²e 2 σ² gca + Variance of effict of spicific combining ability for diallel crosses+ σ²e
σ²A σ²A 2 σ² gca
h²n.s = ـــــــــــــــــ = ـــــــــــــــــــــــــــــــــ = ـــــــــــــــــــــــــــــــــــــــــــ
σ²P σ²A + σ²D + σ²e 2 σ²gca + Variance of effict of spicific combining ability for diallel crosses+ σ²e
Where:
h² b.s : Heritability in broad sense,
h² n.s : Heritability in narrow sense,
σ²GCA : The variance of general combining ability,
Variance of effict of spicific combining ability for diallel crosses: The variance of
specific combining ability,
σ² e : The variance of experimental error i.e. environmental variance, σ²A : Additive genetic variance,
σ²D : Non-additive (dominance and epistasis) genetic variance,
σ²G : Total genetic variance, and
29
GCA SCA GCA SCA A D a 2 2 2 2 2 2 2 2 2 If:
ā = zero denote no dominance
ā < 1 denote partial dominance
ā = 1 denote complete dominance
ā > 1 denote over dominance
3.12. Estimation of reciprocal effect.
.
% ( ) 100 Re 1 1 1 F F F E R Effect ciprocal r Where:F1 : the average value of diallel hybrid, F1r : the average value of reciprocal hybrid
30 S.DLocation = ta (dfE) ( a ) 2MS E(a)
tr
where :
Yijk : The value of observation belongs to the experimental unit designated
: The general mean value,
i
: The value of the actual effect of the treatment “ i ”,
pijk :effect of block (j) in location ( k) Y k : location effect value
( )ik :interaction effect value between treatment (i) and location (k)
: experimental error for the observed value of the experimental unit (Yijk)
Locations mean comparisons conducted by using Least significant difference test (L.S.D.) at 5% and 1% significant levels according to the following equation:
31
3.14.1. The correlation coefficients.
The correlation coefficients were calculated to determine the degree of association of traits with yield and also among the yield components themselves in each environment.
Phenotypic correlations were computed by using the formula given by Webber and Moorthy (1952) and Singh and Chaudhary (1985).
n Y Y n X X n Y X XY r 2 2 2 2 Where:n : Number of the treatments,
r : Correlation factor value.
32
The path coefficient techniques involve partitioning of correlation coefficient to direct (unidirectional pathway `P') and indirect effects through alternate path ways (Pathway `P' X correlation coefficient `r') of various variables and grain yield plant-1. Grain yield was considered as the resultant variable and the others as causal variables. The path coefficient analysis was carried out through the equations as suggested by (Dewey and Lu, 1959, Soomro, 2010, Singh and Chaudhary, 1985 and Arbuckle, 2009), through (Analysis of Moment Structures, AMOS Ver. 18 Softwar).
34
4.RESULTS AND DISCUSSION
Data represent in Table [ 4.1. ] indicate to the mean squares due to variance sources of the studied characters. The mean squares due to the genotype were highly significant for all studied characters, confirming the necessity of splitting this variance to its components ( GCA, SCA, and RCA ) according to the design of full diallel analysis for all studied characters.The mean squares of GCA for all studied characters were highly significant except the characters spike length and harvest index, which were significant and plant height which was not significant.The mean squares due to SCA were highly significant for all characters. The mean square due to RCA were highly significant for all characters except average spike weight which was significant, and the characters spike length and weight of grains/spike, which were not significant mean squares due to genotypes were observed previously by Mahmood, (2010); Mohammad, (2012) ; khoshnaw, (2013).
These results were in agreement with those reported by Ali et al (2009) and Aghamiri et al, (2012).
The significant GCA and SCA mean squares recorded previously by ( Verma, A. K.; S. R. Vishwakarma and P. K. Singh 2007, Chaudhary, B. D.; R. K. singh and S. N. kakar 1974 ; Smith, E. L. and J. W. Lambert 1968 ; Schittenhelm, S.; J. A. Okeno and W. Friedt 2008 ).
The deference between parents and their hybrids caused a significant heterosis compared to mid – parental values, including positive and negative heterosis values.These results were in agreement with previous researchers recorded by ( mahmood, 2010 ; khoshnaw, 2013 ; mohammad, 2012 ; Chaudhary, B. D.; R. K. singh and S. N. kakar 1974 ; Verma, A. K.; S. R. Vishwakarma and P. K. Singh 2007; Carleton, A. E. and W. H. Foote 1968 ; Shahnejat-Bushehri, A. A.; S. Torabi; M. Omidi and M. R. Ghannadha 2005 and Crook, W. J. and J. M. Poehlman 1971).
SOV : source of variance D.F : Degree of Freedom Mse´ : Revised mean squares of experimental
GCA : General combining abililty SCA : Spicific combining ability of deallil crosses RCA :Spicific combining ability of reciprocal crosses
Mean Squears S.O.V D.F plant hight (cm) number of tillers /plant number of spike /plant Weight of spikes /plant (g) spike length (cm) number of grains /spike weight of grains /spike (g) average spike weight (g) 1000 grain weight (g) Grain weight /plant (g) Biological weight /plant (g) Harvest Index (%) Blocks 2 0.08 5.26 3.85 3.57 1.89 0.607 0.01 0.04 10.973 9.85 16.30 0.003 Genotypes 24 176.56** 10.564 ** 6.601 ** 22.058 ** 5.067 ** 12.660 ** 0.087 ** 0.152 ** 88.103 ** 20.092 ** 160.789 ** 0.014 ** GCA 4 24.635 n.s 3.3503 ** 2.131 ** 17.831 ** 1.665 * 3.844 ** 0.047 ** 0.039 ** 14.991 ** 11.930 ** 103.436 ** 0.003 * SCA 10 85.137 ** 4.522 ** 2.595 ** 6.739 ** 2.837 ** 6.310 ** 0.037 ** 0.084 ** 48.663 ** 6.511 ** 53.130 ** 0.004 ** RCA 10 46.257 ** 2.588 ** 1.833 ** 3.774 ** 0.55 n.s 2.279 ** 0.014 n.s 0.021 * 15.822 ** 4.790 ** 34.126 ** 0.005 ** Error 48 45.80 2.05 1.28 1.00 1.52 2.20 0.03 0.03 7.765 5.24 7.67 0.004 Mse´ 15.268 0.682 0.426 0.332 0.507 0.733 0.011 0.009 2.588 1.748 2.556 0.001
36
The average of studied characters represent in Table [ 4.2. ] for both diallel and reciprocal crosses and their parents. Regarding to the diallel crosses the cross 1x2 produced maximum values for the characters number of tillers/plant, number of spike/plant and grain weight plant with 13.067, 10.800, and 14.640 g. respectively. The cross 1x3 gave the lowest value for the characters plant height, number of tillers/plant, weight of grain/spike, grain weight/plant and harvest index with 93.933, 8.533, 1.093, 7.259, and 0.224 cm. respectively. While the lowest due to the characters number of spike/plant, spike length and number of grains/spike exhibited by the cross 1x5 with 6.033, 14.033, and 20.833 respectively. The highest value for the character plant height was 115.767 produced by the cross 2x3 and produced the lowest value due to the characters weight of spike/plant, average spike weight and 1000 grain weight with 6.200, 1.000, and 46.33 respectively. The highest value for the characters number of grain/spike and 1000 grain weight recorded by the cross 2x4 with 26.833, and 54.667 respectively. And for the characters weight of spikes/plant and biological weight/plant recorded by the cross 2x5 with 13.00, and 44.467 respectively, while the cross 3x4 exhibited the highest value for the characters weight of grains/spike, average spike weight and harvest index with 1.633, 1.727, and 0.546 respectively. And produced the lowest value for the characters biological weight with 24.333. The maximum spike length was 19.200 recorded by the cross 3x5.Regarding to the reciprocal crosses, the cross 4x1 gave the highest value for plant height with 127.833, and maximum number of tillers recorded by the cross 3x2 with 14.667, while it produced the lowest value for the characters number of spike/plant, weight of spike/plant, number of grains spike, weight of grains/spike, average spike weight, 1000 grain weight, grain weight/plant and harvest index. The cross 5x2 exhibited the highest value for the characters plant height, number of grains/spike, weight of grains/spike, average spike weight, 1000 grain weight and biological weight with 127.833, 27.733, 1.700, 1.900, 55.333, and 48.733 respectively. The cross 5x3 recorded maximum value due to spike length with 19.333, and 5x4 gave maximum value due to number of spike/plant, weight of spike/plant and grain weight/plant with 10.733, 14.067, and 15.978 respectively.
37
Concerning to parental values, parent 1 recorded the lowest value for the characters number of tillers/plant, number of spike/plant, biological weight/plant and harvest index. Parent 2 recorded maximum value for 1000 grain weight with 50.000 g and the lowest value for spike length and grain weight/plant. Parent 3 showed the lowest value for plant height, weight of spike/plant, number of grain/spike and weight of grains/spike. The highest value for the characters plant height, number of tillers/plant, number of spike/plant, weight of spike plant, grain weight/plant and harvest index recorded by parent 4 with 119.400, 13.667, 11.733, 14.267, 13.407, and 0.298 respectively, while recorded the lowest value for average spike weight and 1000 grain weight. Parent 5 recorded maximum value for spike length, number of grains/spike, weight of grains/spike, average spike weight and biological weight/plant with 17.333, 25.833, 1.467, 1.567, and 45.600 respectively.
These results were in a good agreement with those found by privation researchers, whom revealed significant differences amony genotype, indicating the genetic variability in the material and possibility of selection for these traits, Rohman et al. 2006 ;Madic et al. 2009, Mahmood 2012 and Khoshnaw 2013.