INVESTIGATING THE RELATION BETWEEN EDUCATION LEVEL
AND FERTILITY IN WOMAN 15-45 YEARS OLD
(CASE STUDY OF SHOUSHTAR CITY)
Kobra ShahmansouriDepartment of Sociology, Islamic Azad University, Iran Seyyed Alireza Afshani
Department of Sociology, Islamic Azad University, Iran
ABSTRACT
This study was aimed to investigate the relation between education level and fertility in women 15-45 years old of Shoushtar city. Theoretical principles were used based on their themes in different theory of diffusion and cultural backwardness, Davis and Blake’s theories, the theory of social promotion, economic-social theories, cultural views theories and modernization theory related to this field. Methodology in this research was survey and statistical population of this research was all women 15045 years old in Shoushtar city. And 247 of them have been chosen as a sample and they were studied and it was the study tool. Tool validating was conducted by content and for reliability assessing; Cronbach’s alpha coefficient was used[1]. To data analysis, a statistical software SPSS was used and due to the measurement levels, the methods of descriptive statistics such as frequency tables, charts and in inferential statistic, Pearson tests and Spearman and T were used. Results also showed that there is a significant relation between independent variables included the education level of men and women, women’s employment, income, number of children, attitude to the child, family power structure and religious orientation to the dependent variable of fertility.
Keywords: fertility, education, fertility, attitude to the child, family power structure.
KADIN EĞİTİM DÜZEYİ VE 15-45 YAŞINDA DOĞURGANLIK
ARASINDAKİ İLİŞKİNİN İNCELENMESİ
(SHOUSHTAR ŞEHRİNİN VAKA ÇALIŞMASI)
ÖZ
Bu çalışmada, Shoushtar şehrinde 15-45 yaş kadınlarda eğitim düzeyi ve doğurganlık arasındaki ilişkinin araştırılması amaçlanmıştır. Teorik ilkeler difüzyon ve kültürel gerilik, Davis ve Blake teorilerinin, bu alanla ilgili sosyal promosyon, ekonomik-sosyal teoriler, kültürel görünümleri teorileri ve modernleşme teorisinin teorisinin farklı teoride kendi temalar dayalı kullanıldı. Bu araştırmada Metodoloji anket olduğunu ve bu araştırmanın istatistiksel nüfus Shoushtar kentinde 15.045 yaşında tüm kadınlar oldu. Ve bunların 247 örnek olarak seçilmiştir ve bu çalışıldı ve çalışma aracı oldu. Aracı doğrulayan içerik ve değerlendirilmesi güvenilirlik için yapılmıştır; Cronbach alfa katsayısı kullanılmıştır [1]. veri analizi için, istatistiksel yazılım SPSS kullanıldı ve bağlı ölçüm seviyeleri, frekans tabloları, grafikler gibi ve çıkarımsal istatistik, Pearson testleri ve Spearman ve T kullanıldı açıklayıcı istatistik yöntemleri. Sonuçlar aynı zamanda bağımsız değişkenler arasında anlamlı bir ilişki doğurganlık bağımlı değişkene erkekler ve kadınlar, kadınların istihdamı, geliri, çocuk sayısı, çocuk tutum, aile iktidar yapısı ve dini yönelimi eğitim düzeyini dahil olduğunu göstermiştir.
INTRODUCTION
The family is the first social institution through to it a link is created between a woman and man based on society rules. Fertility has ups and downs over the centuries that have attracted the attention of scientists, scholars, philosophers and planners of each society. In spite of this description, human in today world attaches importance to family and fertility that was not observed in any of the periods. Today, family dedicated different issues of regional and national and country and also world programs to itself[2]. Also, in planning related to the sectors of health, education, labor force, employment and housing and other socio-cultural and economic programs, changes were taking place. Which was followed by an evolution lined and it seems needed that in non-developed and industrial countries, revolts were created of the sixteenth century to the twentieth century for the legal status of women and families. Family changes and critical events are estimated and registered accurately by population statistics of government departments and women can influence on these programs[3]. But in developing countries due to their traditional family and community, the statistics are not as follows to be able make a real understanding of childbearing status and we should use indirect methods with sampling estimates and we should use them to estimate the changes of family dimension. Childbearing as a change factor in family and community influences on family functions and its process and also has effect on the age composition of the population, the number of people in work age and family welfare and children maintenance. So measuring and recognition of fertility levels in each country is not only the population predictions which is the basis and foundation of all social, economic and cultural programs but in assessing the economic, social and cultural conditions, it is considered as basic and macro indicators. The approach of “investigating the relation between education level and fertility in woman 15-45 years old of Shoushtar city” was conducted as a Master’s thesis. That hopefully will be an effective step to serve Shoushtar city[4].
METHODOLOGY
In this study, method was survey research and statistical population were all women 15-45 years old of Shoushtar city and 247 of them were selected as sample and they were studied. The questionnaire was the used tool in this study, tool validating is diagnosed contently and to assessing the reliability, Cronbach’s alpha coefficient was used. To data analysis, statistical software SPSS was used and due to the measurement levels, the descriptive statistics methods were used such as frequency tables, graphs and in inferential statistics, Pearson, Spearman and independent T were used.
FINDINGS
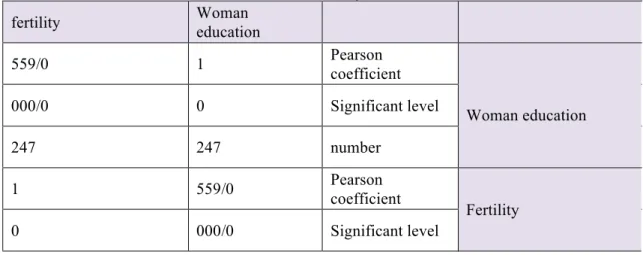
Table 1: the output of Spearman correlation coefficient to test the relation between woman’s educations
with fertility Woman education fertility Woman education Pearson coefficient 1 559/0 -Significant level 0 000/0 number 247 247 Fertility Pearson coefficient 559/0 - 1 Significant level 000/0 0
Number 247
247
As it can be seen from above table, Spearman Coefficient correlation is equal to -0.559 that it shows an inverse relation, besides the significant level is equal to 0.000 and this means that this relation is significant, so hypothesis 1 is confirmed based on this issue that there is a relation between woman education and fertility
This means that if the woman education is higher, fertility is lower.
Table 2: the output of spearman correlation to test the relation between men education with childbearing
Men education childbearing Men education Pearson coefficient 1 480/0 -Significance level 0 000/0 Number 247 247 Childbearing Pearson coefficient 480/0 - 1 Significance level 000/0 0 Number 247 247
As we can from the above table, Spearman correlation coefficient is equal to -0.480 and it shows an inverse relation. It means that significance level is equal to 0.000 and this means that this relation is significance. So hypothesis 2 is confirmed based on this issue that there is a relation between men education and childbearing. It means that if men education is higher, their childbearing is lower.
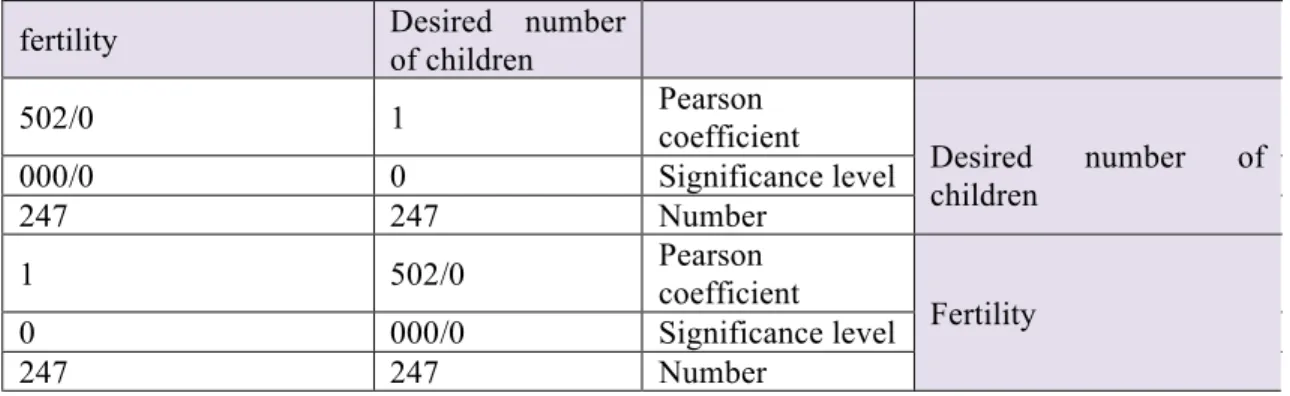
Table 3: the output of Pearson correlation coefficient to test the relation Between desired number of
children with fertility Desired number of children fertility Desired number of children Pearson coefficient 1 502/0 -Significance level 0 000/0 Number 247 247 Fertility Pearson coefficient 502/0 - 1 Significance level 000/0 0 Number 247 247
As it can be seen from the above table, Pearson correlation coefficient is equal to -0.502 and it shows an inverse relation, besides the significance level is equal to 0.000 and this means that this relation is significance. So hypothesis 3 s confirmed based on this fact that there is a relation between desired number of children and fertility. In means that if the number of desired children are more, their fertility is lower.
Table 4: the output of Pearson correlation Coefficient to test the relation between income level with
fertility Income level fertility Income level Pearson coefficient 1 182/0 -Significance level 0 015/0
Number 247 247 Fertility Pearson coefficient 182/0 - 1 Significance level 015/0 0 Number 247 247
As it can be seen from the above table, Pearson correlation coefficient is equal to -0.182 and this represents an inverse relation, besides the significance level is equal to 0.015 and this means that this relation is significance. So the hypothesis 4 is confirmed based on this issue that there is a relation between income level and fertility. And this means that if the income level is higher, their fertility is lower.
Table 5: the output of T test to compare the mean of fertility between employed and unemployed women
variable groups number mean Standard devation t Freedom degree Significance level Employment status Unemployed 87 43/3 808/1 257/1 1 245 000/0 869/0 51/1 160 Employed
According to above table, the fertility mean of unemployed woman (3.43) and has a significance difference (sig=0.000) with the mean of fertility of unemployed woman (1.51). thus, hypothesis 5 is confirmed because it shows that there is a difference between fertility based on employment status of women.
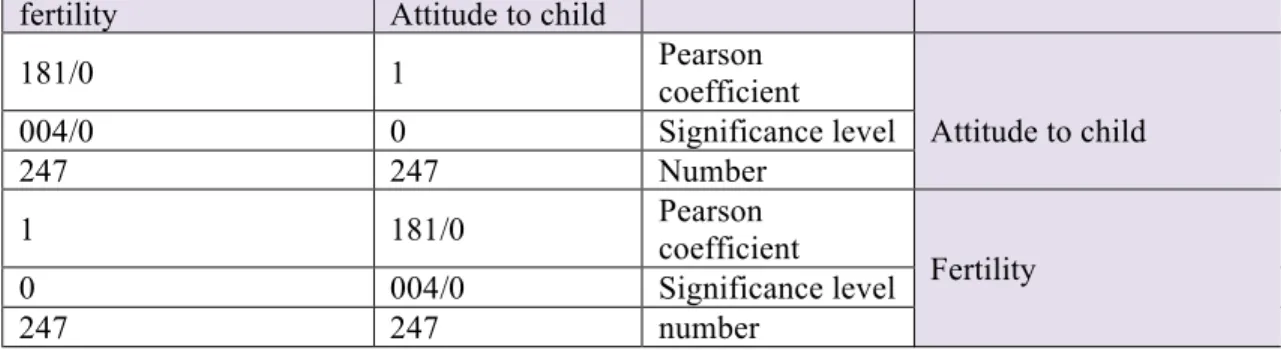
Table 6: the output of Pearson correlation Coefficient to test the attitude to child or fertility.
Attitude to child fertility Attitude to child Pearson coefficient 1 181/0 Significance level 0 004/0 Number 247 247 Fertility Pearson coefficient 181/0 1 Significance level 004/0 0 number 247 247
As it can be seen from the above table, Pearson correlation coefficient is equal to 0.1818 and it shows a direct relation, beside the significance level is equal to 0.004 and it means that this relation is significance. According to this fact that there is a relation between attitude to child and fertility, hypothesis 6 is confirmed. And this means that if the attitude to child is more positive, their fertility is higher.
Table 7: the output of Pearson correlation coefficient to test the religious orientation with fertility
Religious orientation Fertility Religious orientation Pearson coefficient 1 287/0 Significance level 0 000/0 Number 247 247 Fertility Pearson Coefficient 287/0 1 Significance level 000/0 0 Number 247 247
As it can be seen from above table, Pearson correlation coefficient is equal to 0.287 and it shows a direct relation, besides the significance level is equal to 0.000 and this means that the relation is significant. So hypothesis 7 is confirmed based on this fact that there is a relation between religious orientation and fertility. It means that if religious orientation is more positive, their fertility is more.
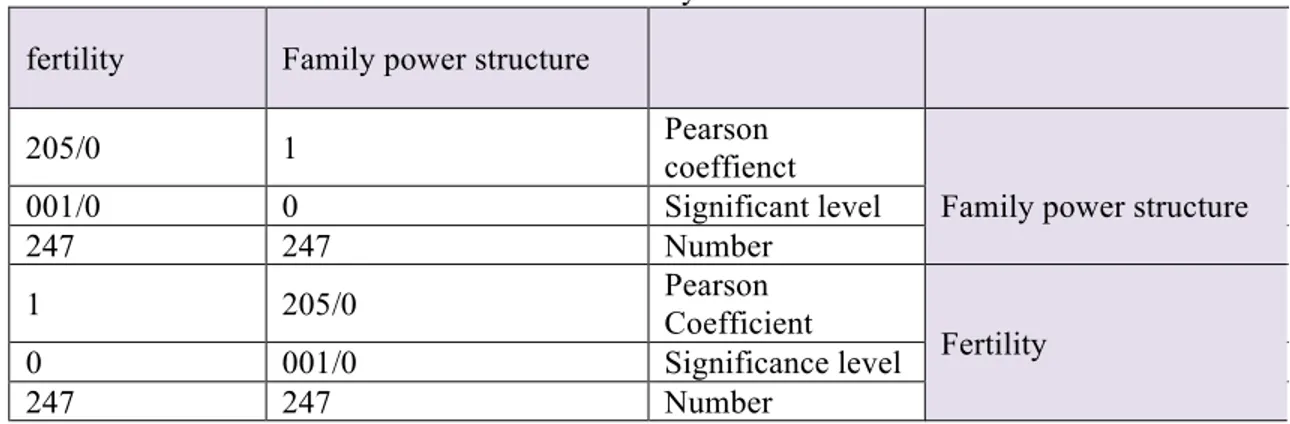
Table 8: the output of Pearson correlation coefficient to test the relation of power structure in family with
fertility Family power structure
fertility
Family power structure Pearson coeffienct 1 205/0 -Significant level 0 001/0 Number 247 247 Fertility Pearson Coefficient 205/0 - 1 Significance level 001/0 0 Number 247 247
As it can be seen from the above table Pearson correlation coefficient is equal to -0.205 that shows an inverse relation, besides the significance level is 0.001 and this means that this relation is significance. So hypothesis 8 is confirmed based on this issue that there is a significance relation between family power structure and fertility[5]. And this means that if family power structure is more democratic and more balanced, their fertility is less.
RESULTS
1.making culture to achieve optimal correction and desired population and aware people about negative consequences of fertility decline, especially under the succession.
2.determining policies, programs and encouragement regulations to achieve appropriate fertility range, desired population, and canceling policies, programs and regulations to reduce fertility[6].
3. The development and adoption of intelligent programs to promote fertility. 4. Appropriate training and emphasis to fertility on appropriate ages.
5.try to improve the population quality through balancing the family fertility range with conditions and requirement of health, their culture and livelihood.
6.stretngthening the woman ability to manage life in various aspects such as education, employment, living and parenting.
7.preparing comprehensive production design and implementing a kind of education, research, communication, presentation and advertising and other mass media programs particularly radio and television and provincial networks with aims to promote the discussion and explain the benefits of fertility and clear the negative effects of fertility reduction by conditions and strategic requirement.
ACKNOWLEDGEMENTS
This paper was extracted from M.A thesis entitled “Investigating the relation between education level and fertility in woman15-45 years old (case study of Shoushtar city)” which is implemented in the Islamic Azad University, Shoushtar Branch, Shoushtar, Iran.
REFERENCES
1.Todaro, M. (1985) "Economic development in the Third World" (translated Dr. Farjadi), published by the Center for Economic and Social Planning and Budget, Tehran.
2. Paydarfr, S. (1354). "The phenomenon of modernity and its relationship to fertility", Isfahan University, Center for Demography.
3. J.-M. (1376). "Principles of Geology", Tehran, Dehkhoda.
4. Old-M. And Rahman, AS. (1383). "Principles of Geology", Islamic Azad University of Zanjan 5- Bhend A. (1995) "Principal of Population Studies" Himalaya. Publishing House" Bomboy.
6- Lucas, David (1994). "The proximat Determirant of Fertility in Beginning population Studies, the Australion National University, canbera, PP.44-55.