Turkish Journal of Field Crops, 2011, 16(2): 190-196
EVALUATION OF TURKISH OAT LANDRACES BASED ON GRAIN YIELD,
YIELD COMPONENTS AND SOME QUALITY TRAITS
Ziya DUMLUPINAR1* Hasan MARAL2 Rukiye KARA3, Tevrican DOKUYUCU1 Aydın AKKAYA1
1
Kahramanmaraş Sutcu Imam University, Agricultural Faculty, Department of Agronomy, Turkey
2
Karamanoglu Mehmetbey University, Ermenek Vocational School, Turkey
3
Kahramanmaras Agricultural Research Institute, Turkey *Corresponding author’s email: [email protected]
Received: 17.08.2011 ABSTRACT
In this study, 196 Turkish oat landraces and three standard cultivars (Checota, Faikbey and Seydişehir) were evaluated for grain yield, yield components and some quality traits for two years. Based on two years experiment data, all investigated traits were significantly different for years, except panicle length and protein ratio. Genotypes varied for grain number per panicle, grain weight per panicle, panicle length, 1000-grain weight, grain yield, groat percentage and protein ratio. However, year x genotype interaction was only important for grain yield, groat percentage and protein ratio. According to the investigated traits, grain yield, grain weight per panicle and 1000-grain weight traits were more promising than 1000-grain number per panicle, panicle length, groat percentage, protein ratio, tiller number per plant and panicle number per m2. These results indicate that, E35, E39, E21, E34, E13, A16, E17, E37, E26, A27, A9, A10, E20, A79, E19, E56 A59, K13, K43, A19, E47, K7, K4, K3 and A7 were some of the genotypes with higher grain yield, 1000-grain weight and grain weight per panicle.
Keywords: Avena sativa; landraces; oat; grain yield; quality traits; yield components
INTRODUCTION
Oat (Avena sativa L.) is a cereal crop is used for human food and livestock feed worldwide (Peterson et al., 2005; Achleitner et al., 2008). As compared to the other cereal crops, oat is broadly adapted to marginal environments with low fertility soils, cool-wet and low rainfall climates (Hoffman 1995; Buerstmayr et al., 2007; Ren et al., 2007).
In recent years, the demand in oat for human consumption has increased because of dietary benefits of whole grain and β-glucan (Achleitner et al., 2008). Oats are rich in water-soluble β-glucan (soluble fiber) that have been known to lower the cholesterol concentration in human blood serum (Becher 2007) and, antioxidantlike compounds, -tocotrienol, -tocopherol, and avenanthramides (Peterson et al., 2005; Yu et al., 2006; Oliver et al., 2010). For human food oat groat is desired, that high in protein, β-glucan and low in oil, whereas high oil and low β-glucan with the high protein is desired for livestock feed to maximize the energy (Peterson et al., 2005).
Plant breeders have measured and selected for agronomic traits (grain yield, plant height, heading date, pest and disease resistance, as well as lodging), grain physical traits (groat and kernel weight, test weight, groat percentage, and milling yield) and grain composition traits (protein, oil, β-glucan and phytochemicals) for many years (Peterson et al., 2005). All these traits are affected by genetic and environmental factors
(Doehlert et al., 2001; Peterson et al., 2005). Breeders also develop oat populations for variety development from crosses within regionally adapted germplasm (Achleitner et al., 2008).
On the other hand, landraces are a good source for expanding genetic variations which allow the development of new cultivars with high quality traits. Turkey is one of the centers of origin of oat (Avena sativa L.) with a large number of landraces. Unfortunately, as compared with the other cereals such as wheat, maize, rice and barley, less attention has been given to oat.
The aim of the current study was to evaluate 196 Turkish origin oat landraces and three standard cultivars based on grain yield, yield components and some quality traits.
MATERIALS AND METHODS
Plant material
The seeds of 196 oat landraces (Avena sativa L.) were obtained from Institute of Plant Genetics and Crop Plant Research Gatersleben, Germany (81) are coded “A”, Aegean Agricultural Research Institute Plant Gene Resources Department Izmir, Turkey (60) are coded “E” and Bahri Dagdas Agricultural Research Institute Konya, Turkey (55) are coded “K”. In addition, three standard oat cultivars (Checota, Faikbey and Seydişehir) were used in the study.
Detailed pedigree and origin information about the genotypes are given in Dumlupinar et al. (2011).
Field trials
Field trials were carried out consecutively for two years (2008 and 2009) at Kahramanmaraş province, located between 37° 53' N and 36° 58' E in East Mediterranean region of Turkey. The experiment was arranged in an augmented split block experiment design with six replications of standard cultivars (Federer 2005). The seeds were planted in two row plots, each row was 1 m. The experiments were carried out in rainfed conditions. Fertilizers were applied at planting (50 kg ha-1 N and 50 kg ha-1 P2O5) and at tillering as topdressing (100 kg ha-1 N). Herbicide (Tribenuron-methyl (DF) 75%) was used for weed control. However, there was no application of chemicals to control pests and diseases.
Investigated traits
In the experiment, grain yield, yield components and some of the grain quality traits were measured. Grain yield and yield components; panicle number per m2 (PN m-2), tiller number per plant (TNP), panicle length (PL), grain number per panicle (GNP), grain weight per panicle (GWP), 1000-grain weight (1000-GW) and 1000-grain yield (GY) were determined as previously described (Bares et al., 1985; Buerstmayr et al., 2007). Grain quality traits; groat percentage (GP), measured after manually de-hulling and accurately weighing of the grain samples (Welch et al., 2000), and protein ratio (PR) were determined by Dumas method (Barbottin et al., 2005).
Statistical analysis
The data across the two years was analyzed as an augmented split block design by ANOVA. The mean values of the 199 genotypes for investigated traits were subjected to genotype-by-trait, principal components (PC) factor analysis and biplot analysis of PC1 and 2 and, Spearman correlation coefficients between mean values of the investigated traits was calculated (JMP 2007).
RESULTS
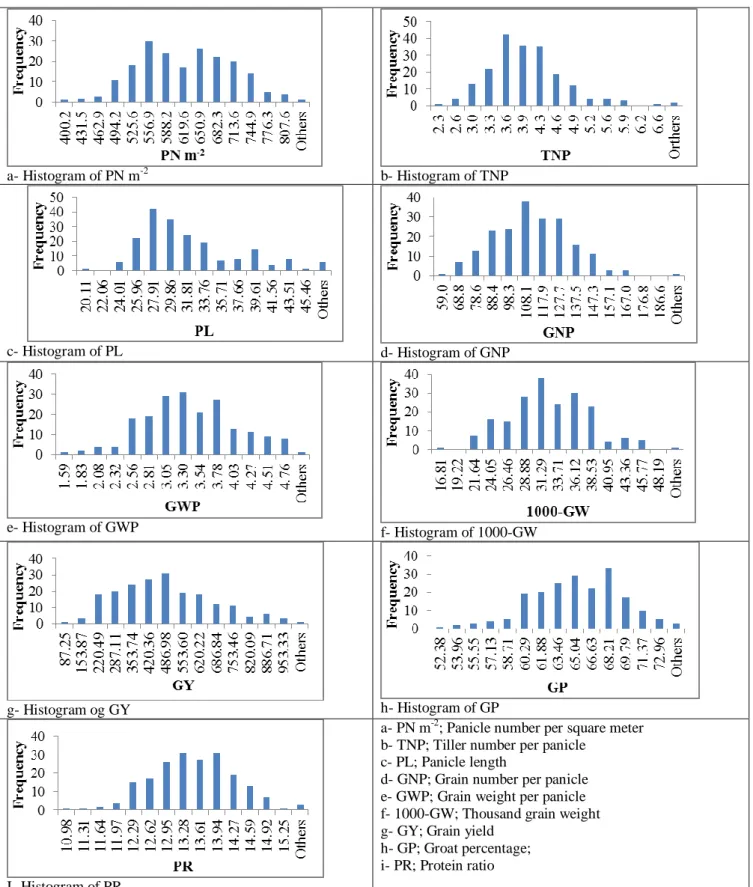
Grain yield, yield components and quality traits Based on two years experiment data, all traits were significantly different for years (P < 0.01) except PL and PR. Genotypes varied for GNP, GWP (P < 0.05), PL, 1000-GW, GY, GP and PR (P < 0.01). However, year x genotype interaction was only significant for GY, GP and PR (P < 0.01) (Table 1). The higher and lower data belong to the genotypes for investigated traits are given in the text instead a huge table and histograms were made to show the distribution of the data across oat genotypes for each investigated traits (Fig. 1).
The mean PN m-2 values of the genotypes were found variable for two years and higher panicle numbers were obtained from A56, K21, K10 and A63 genotypes (835.95, 788.55, 782.30 and 778.15 respectively), while the lower panicle numbers were obtained from A7, A40, K51 and K48 genotypes (400.20, 423.95, 428.95 and 441.45 respectively) Checota cv. had a lower panicle number with 620.00 than the
other standard cultivars Faikbey and Seydişehir with 657.70 and 703.65.
Tiller numbers of the plants varied only between years. E2, A67, E43 and A62 genotypes (6.88, 6.68, 6.39 and 5.74 respectively) were higher in tillering, while A7, A40, A69 and A53 genotypes were lower (2.31, 2.45, 2.55 and 2.57 respectively). However, standard cultivars had average tillering rates (Checota 3.52, Faikbey 4.00 and Seydişehir 4.33). Panicle length was found variable among the genotypes. K36 genotype had the tallest panicle with 47.41 cm and A35 genotype followed this genotype with 46.31 cm. Shorter panicles were obtained from E19, A23 and K8 genotypes (20.11, 22.35 and 22.78 cm respectively). Standard cultivars were similar in respect to panicle length (Checota 26.61 cm, Faikbey 27.88 cm and Seydişehir 29.17cm). Grain number of genotypes varied between years (P < 0.01) and among genotypes (P < 0.05). A48, A69, E7 and K47 genotypes had higher grain numbers (196.40, 163.80, 160.00 and 158.60 respectively), while E46, E20, E19 and E41 genotypes had lower grain numbers (59.00, 62.40, 66.00 and 66.40 respectively). Grain weight varied between years (P < 0.01) and among genotypes (P < 0.05). Higher GWP values were obtained from A48, K42, E9 and K27 genotypes (5.00, 4.73, 4.68 and 4.64 g respectively), while lower GWP values were obtained from E52, K14, E46 and A66 genotypes (1.59, 1.77, 1.77 and 1.98 g respectively). In addition, Seydişehir cultivar had the lowest GWP with 2.70 g among the standard cultivars, while Checota and Faikbey were similar (3.14 and 3.25 g). A measure of 1000-GW varied for years (P < 0.01) and genotypes (P < 0.01). E44, E24 and E26 genotypes (50.60, 45.51 and 44.33 g respectively) were high in 1000-GW compared to others, while A15, A1 and A33 genotypes (16.81, 18.12 and 20.71 g respectively) were low. The Checota cultivar had the highest 1000-GW (36.43 g) compared to other standards Faikbey and Seydişehir (33.30 and 27.71 g). Grain yields of genotypes were found variable according to the year (P < 0.01), genotype (P < 0.01) and year x genotype interaction (P < 0.01). Higher yielding genotypes were E13, E16, E39 and E34 (1019.95, 915.15, 911.18 and 895.68 kg da-1 respectively), while K41, K29, E54 and A6 genotypes (87.25, 123.43, 128.23 and 153.15 kg da-1 respectively) were lower in grain yields compared to others. Among the cultivars, Checota had the highest grain yield (613.23 kg da -1), while Faikbey and Seydişehir had 356.23 and 393.73 kg da-1 grain yields. Groat percentage varied in year (P < 0.01), genotype (P < 0.01) and year x genotype interaction (P < 0.01). A45, K56 and A34 genotypes (% 74.54, 74.30 and 72.97 respectively) had higher GP, while A13, K41 and E56 genotypes (% 52.38, 52.70 and 52.94 respectively) had lower percentages. Seydişehir cultivar was the highest in GP (66.85%), while Checota and Faikbey were similar (65.49 and 65.24%). Protein ratio was variable for genotype (P < 0.01) and year x genotype interaction (P < 0.01). A52, A56, A83 and A71 genotypes (15.58, 15.30, 15.30 and 15.12% respectively) were higher in PR, while E47, A41, E48 and A45 genotypes (10.98, 11.20, 11.32 and 11.33% respectively) were lower. Standard cultivars were similar in respect to PR (Checota 12.90%, Faikbey 13.21% and Seydişehir 13.09%).
a- Histogram of PN m-2 b- Histogram of TNP
c- Histogram of PL d- Histogram of GNP
e- Histogram of GWP f- Histogram of 1000-GW
g- Histogram og GY h- Histogram of GP
I- Histogram of PR
a- PN m-2; Panicle number per square meter b- TNP; Tiller number per panicle
c- PL; Panicle length
d- GNP; Grain number per panicle e- GWP; Grain weight per panicle f- 1000-GW; Thousand grain weight g- GY; Grain yield
h- GP; Groat percentage; i- PR; Protein ratio
Figure 1. Histogram shows the distribution of data across 199 oat lines for grain yield, yield components and some quality traits evaluated for two years.
Relationship among traits
According to mean values of investigated traits, some of the traits were found highly correlated to each other. Also, genotypes were clustered for related traits according to biplot of PC1 and 2. According to PC factor analysis, variation
proportion, accounted for nine components (C) were; C1 23.88%, C2 23.01%, C3 15.73%, C4 12.46%, C5 7.79%, C6 7.70%, C7 5.56%, C8 3.65% and C9 0.18%. Correlations between the selected traits (Fig. 2 and 3) and biplot of PC1 and 2 of 199 oat genotypes based on nine traits are shown in
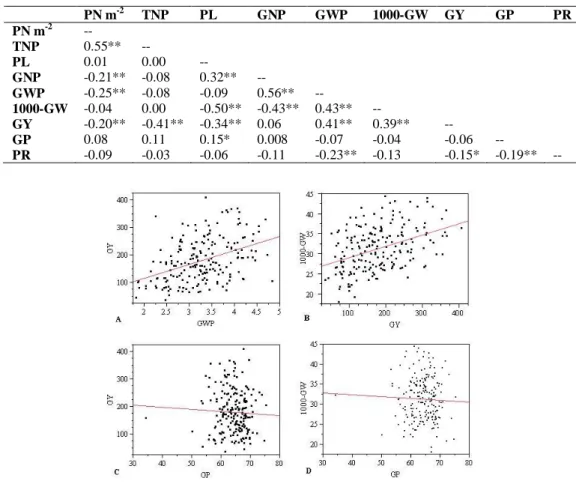
Table 1 Mean squares according to years, genotypes and year x genotype interactions for grain yield, yield components and some quality traits DF PN m-2 TNP PL GNP GWP 1000-GW GY GP PR Years 1 498003** 10.3** 37.4 15549** 11.32** 4532** 116424** 4942** 0.05 Genotypes 198 14729 1.01 51.27** 960.8* 0.79* 56.04** 10803** 44.54** 1.54** Year x Genotype 198 15700 0.71 12.45 549.6 0.481 13.46 6098** 36.33** 1.62** * P < 0.05, ** P <0.01
Fig. 4. In addition, Spearman correlation coefficients of the nine traits are shown in Table 2.
Associations between GY x GWP and GY x 1000-GW were highly correlated (r= 0.41** and r= 0.39**) (Fig. 2A, 2B and Table 2), while GP x GY and GP x 1000-GW were negatively correlated (r= -0.06 and r= -0.04) (Fig. 2C, 2D and Table 2). In addition, relationship between GNP x GWP and GWP x 1000-GW was highly correlated (r= 0.56** and r= 0.43**) (Fig. 3A, 3C and Table 2), while PN m-2 x GWP
and GNP x 1000-GW were negatively correlated (r= -0.25** and r= -0.43**) (Fig. 3B, 3D and Table 2).
In addition, associations between PN m-2 xTNP, PL x GNP and PL x GP (r=0.55**, r=0.32** and r= 0.15** respectively) were positively correlated, while PN m-2 x GNP, PN m-2 x GY, TNP x GY and PR x GWP (r= -0.21**, r= -0.20**, r= -0.41** and r= -0.23** respectively) were negatively correlated (Table 2).
Table 2. Spearman correlation coefficients based on mean values of nine traits.
PN m-2 TNP PL GNP GWP 1000-GW GY GP PR PN m-2 -- TNP 0.55** -- PL 0.01 0.00 -- GNP -0.21** -0.08 0.32** -- GWP -0.25** -0.08 -0.09 0.56** -- 1000-GW -0.04 0.00 -0.50** -0.43** 0.43** -- GY -0.20** -0.41** -0.34** 0.06 0.41** 0.39** -- GP 0.08 0.11 0.15* 0.008 -0.07 -0.04 -0.06 -- PR -0.09 -0.03 -0.06 -0.11 -0.23** -0.13 -0.15* -0.19** --
Figure 2. The correlation between selected traits based on mean values of 199 oat genotypes for GY x GWP, GY x 1000-GW, GY x GP and GP x 1000-GW.
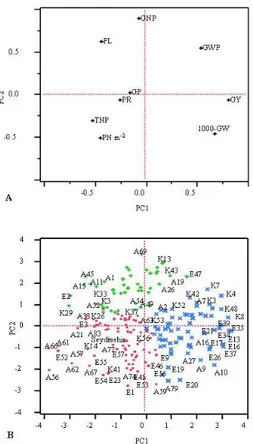
Biplot of principal components 1 and 2 for 199 oat genotypes illustrates a clear separation of genotypes and traits. E35, E39, E21, E34, E13, A16, E17, E37, E26, A27, A9, A10, E20, A79, E19, E56 A59, K13, K43, A19, E47, K7, K4, K3 and A7 were some of the genotypes in the right quadrants with GY, 1000-GW and GWP. However, A69, A45, A1, A11, A15, K33, A54, K37, A49, A56, A62, E52,
A57, A67, E57, A77, K14, Seydişehir, K56 and A83 were some of the genotypes in the left quadrants with PL, GP, GNP, PR, TNP and PN m-2 (Fig 4A and 4B).
However, the upper right quarter of the biplot (positive PC1 and positive PC2) is mainly associated with GWP, the lower right quarter of the biplot (positive PC1 and negative PC2) is mainly associated with GY and 1000-GW, the upper
Figure 3. The correlation between selected traits based on mean values of 199 oat genotypes for GNP x GWP, PN m-2 x GWP, 1000-GW x GWP and GNP x 1000-GW.
left quarter of the biplot (negative PC1 and positive PC2) is mainly associated with PL, GNP and GP, and the lower left quarter of the biplot (negative PC1 and negative PC2) is mainly associated with TNP, PN m-2 and PR. Thus, oat genotypes with the high grain yield and grain weight are located along the right quadrants of the biplot. Oat genotypes associated with the low grain yield, high tillering and long panicles are located along the left quadrants of the biplot (Fig. 4B).
Figure 4. Biplot of principal components 1 and 2 of 199 oat genotypes based on mean values of nine traits.
DISCUSSION
Grain yield, yield components and quality traits Panicle number per m2 and TNP did not vary for genotypes but varied for years. In the first year, germination ratio of the genotypes was lower than year two, due to different seed storage durations in the gene banks, which caused high tillering and differences between years. Peltonen-Sainio et al. (1995) reported sowing density with main stem and tillers were highly correlated with grain yield. Nawaz et al. (2004), Yanming et al. (2006) and Ahmad et al. (2008) also reported tiller number varied among the genotypes, which is not in agreement with our findings. However, oat genotypes varied for panicle length. Our finding is in agreement with Yanming et al. (2006) who reported panicle length was influenced by genetics. Grain number per panicle and GWP varied for year and genotype. Variation in years was due to influence of environmental conditions. Higher precipitation in the second year caused different GNP and GWP values between years. In addition, variation among genotypes was due to genetic influence. However, there was a negative correlation between GNP and GWP. Thus, those two traits cannot be the only selection criteria. Year and genotype varied for 1000-GW. There was a large variation for year one, while there was no variation for year two, which may be due to climatic conditions. This result indicates that variation in genotypes were due to genetic influence. In previous works, Yanming et al. (2006) and Buerstmayr et al. (2007) reported variations among the oat genotypes for 1000-GW. There was a large variation for grain yield. Grain yield performance of the genotypes was higher than the standard cultivars. Differences between years were due to environmental conditions. Year x genotype interaction was significant. This may also be due to climatic conditions. In literature, Corville Baltenberger and Frey (1987) reported that grain yield and test weight differences were influenced by genetics. Robertson and Frey (1987) indicated grain yield and biomass as selection criteria. Doehlert et al. (2001) determined that grain yield was
influenced by environmental factors rather than genetics. Tamn (2003) found that, grain yield was influenced by both climatic conditions and genetics. Nawaz et al. (2004) indicated that grain yield varied for all cultivars. Gautam et al. (2006) determined a large variation for grain yield among genotypes. Buerstmayr et al. (2007) found substantial genetic variation and high heritability for grain yield among the genotypes. Ahmad et al. (2008) also reported that grain yield was influenced by genetics. In oat, one of the most important traits after grain yield is groat percentage. In our study, groat percentage varied for year, genotype and year x genotype interaction. Differences between years and significant year x genotype interaction were due to a higher precipitation in the second year. In previous works, Doehlert et al. (1999) reported groat percentage as an important quality trait in oat (Avena sativa L.), Welch et al. (2000) reported variation for groat percentage within oat species, Doehlert et al. (2001) determined that crown rust decreased groat percentage in oat, Peltonen-Sainio et al. (2004) found that, high hull rate limited oat (Avena sativa L.) using as an animal feed. Protein ratio is one of the important quality traits for oat. In our study, protein ratio varied for year, genotype and year x genotype interaction. Peterson et al. (2005) and Yanming et al. (2006) reported that genetic variation was important for protein ratio, Biel et al. (2009) indicated hulless oats had higher protein ratio than hulled oats. In addition, Welch et al. (2000) reported groat protein ratios varied within oat species. Also, Doehlert et al. (2001) reported protein ratio was equally influenced by both genetics and environmental factors.
Relationship among traits
Tiller number per plant and PN m-2 were found highly correlated and tiller number increased panicle number linearly. However, correlations between TNP x GY and PN m-2 x GY were negative. In contrast to our findings, Gautam et al. (2006) reported positive correlations between tiller number and grain yield. The correlation between GNP and PL was high. Genotypes with longer panicles had higher grain numbers. Also, GNP x GWP was highly correlated, higher grain numbers resulted in higher grain weights. In addition, GWP x 1000-GW, GWP x GY and GY x 1000-GW were highly correlated. Grain weight has an important role to determine grain yield. However, GNP x 1000-GW and GNP x GY were negatively correlated, genotypes with the lower grain number per panicle had higher 1000-GW and GY as expected. Redaelli et al. (2008) found positive correlation between grain weight and grain yield. The correlation between GP x GY was not significant. Buerstmayr et al. (2007) reported a moderate correlation, but also indicated a conflict about different reports for the correlation between GY x GP. However, PR was negatively correlated with GY, GWP and GP. Frey (1998), Martinez et al. (2010) and Peterson et al. (2005) also reported negative correlations between PR x GY.
Biplot analysis indicates the most promising traits as a selection criteria for genotypes used in this study. According to the results, grain yield, GWP and 1000-GW traits fell into the two right quadrants of the biplot, might be more promising than traits (GNP, PL, GP, PR, TNP and PN m-2)
that fell into the left quadrants. Peterson et al. (2005) indicated that biplots can be used to select genotypes that may have favorable combinations of traits for use in breeding programs.
CONCLUSION
In this study, we have evaluated Turkish origin oat genotypes based on grain yield, yield components and some quality traits. Genotypes showed higher performance than standard cultivars for all investigated traits. Our results demonstrate which traits are more promising as selection criteria and, genotypes that are hopeful for use in breeding programs.
ACKNOWLEDGMENTS
This study was supported by The Scientific and Technological Research Council of Turkey (TÜBİTAK). Project Code: TOVAG 106 O 583, 2007.
LITERATURE CITED
Achleitner, A., Tinker, N.A., Zechner, E., H. Buerstmayr, 2008. Genetic diversity among oat varieties of worldwide origin and associations of AFLP markers with quantitative. Theor. Appl. Genet. 117: 1041-1053.
Ahmad, G., Ansar, M., Kalem, S., Nabi, G., M. Hussain, 2008. Performance of early maturing oats (Avena sativa L.) cultivars for yield and quality. J. Agric. Res. 46(4): 341-346.
Barbottin, A., Lecomte, C., Bouchard, C., M.H. Jeuffroy, 2005. Nitrogen remobilization during grain filling in wheat: genotypic and environmental effects. Crop Sci. 45: 1141-1150.
Bares, I., Sehnolova, J., Vlasak, M., Vlach, M., Krystof, Z., Amler, P., Maly, J., V. Berenek 1985. Descriptors List of Triticum Genus. Praha.
Becher, R., 2007. EST-derived microsatellites as a rich source of molecular markers for oats. Plant Breeding. 126: 274-278. Biel, W., Bobko, K., R. Maciorowski, 2009. Chemical composition
and nutritive value of husked and naked oats grain. Journal of Cereal Science. 49: 413-418.
Buerstmayr, H., Krenn, N., Stephan, U., Grausgruber, H., E. Zechner, 2007. Agronomic performance and quality of oat (Avena sativa L.) genotypes of worldwide origin produced under Central European growing conditions. Field Crops Res. 101: 341-351.
Corville Baltenberger, D.C., K.J. Frey, 1987. Genotypic variability in response of oat to delayed sowing. Agron. J. 79: 813-816. Doehlert, D.C., McMullen, M.S., R.R. Baumann, 1999. Factors
affecting groat percentage in oat. Crop Sci. 39: 1858-1865. Doehlert, D.C., McMullen, M.S., J.J. Hammond, 2001. Genotypic
and environmental effects on grain yield and quality of oat grown in North Dakota. Crop Sci. 41: 1066-1072.
Dumlupinar, Z., Dokuyucu, T., A. Akkaya, 2011. Identification of Turkish Oat Landraces (Avena sativa L.) Based on Avenin Proteins by SDS-PAGE Technique. Turkish Journal of Field Crops. 16(1): 76-83.
Federer, W.T., 2005. Augmented split block experiment design. Agron. J. 97(2): 578-586.
Frey, K., 1998. Genetic responses of oat genotypes to environmental factors. Field Crops Res. 56(1-2): 83-185. Gautam, S.K., Verma, A.K., S.R. Vishwakarma, 2006. Genetic
variability and association of morpho-physiological characters in oat (Avena sativa L.). Farm Science Journal. 15(1): 82-83. Hoffmann, L.A., 1995. World production and use of oats, In:
Welch, R.W., (ed.), The Oat Crop-Production and Utilization. Chapman and Hall, London, pp. 34-61.
JMP Institute Inc., 2007. JMP User Guide, Release 7 Copyright© 2007, SAS Institute Inc., Cary, NC.
Martinez, M.F., Arelovich, H.M., L.N. Wehrhahne, 2010. Grain yield, nutrient content and lipid profile of oat genotypes grown in a semiarid environment. Field Crops Res. 116: 92-100. Nawaz, N., Razzaq, A., Ali, Z., Sarwar, G., M. Yousaf, 2004.
Performance of different oat (Avena sativa L.) varieties under the agro-climatic conditions of Bahawalpur-Pakistan. Int. J. Agri. Biol. 6(4): 624-626.
Oliver, R.E., Obert, D.E., Hu, G., Bonman, J.M., O’Leary-Jepsen, E., E.W. Jackson, 2010. Development of oat-based markers from barley and wheat microsatellites. Genome. 53(6): 458-471. Peltonen-Sainio, P., P. Jarvinen, 1995. Seeding rate effects on tillering, grain yield, and yield components of oat at high latitude. Field Crops Res. 40: 49-56.
Peltonen-Sainio, P., Kontturi, M., A. Rajala, 2004. Impact dehulling oat grain to improve quality of on-farm produced feed I. Hullability and associated changes in nutritive value and energy content. Agricultural and Food Science. 13: 18-28.
Peterson, D.M., Wesenberg, D.M., Burrup, D.E., C.A. Erickson, 2005. Relationships among agronomic traits and grain composition in oat genotypes grown in different environments. Crop Sci. 45: 1249-1255.
Redaelli, R., Lagana, P., Rizza, F., Nicosia, O.L.D., L. Cattivelli, 2008. Genetic progress of oats in Italy. Euphytica. 164: 679-687.
Ren, C.Z., Ma, B.L., Burrows, V., Zhou, J., Hu, Y.G., Guo, L., Wei, L., Sha, L., L. Deng, 2007. Evaluation of early mature naked oat varieties as a summer-seeded crop in dryland Northern climate regions. Field Crop Res. 103: 248-254.
Robertson, L.D., K.J. Frey, 1987. Honeycomb design for selection among homozygous oat lines. Crop Sci. 27: 1105-1108. Tamn, I., 2003. Genetic and environmental variation of grain yield
of oat varieties. Agronomy Research. 1: 93-97.
Welch, R.W., Brown, J.C.W., M. Leggett, 2000. Interspecific and intraspecific variation in grain and groat characteristics of wild oat (Avena) species: very high groat (1→3), (1→4) - -D-glucan in an Avena atlantica genotype. Journal of Cereal Science. 31: 271-279.
Yanming, M., ZhiYong, L., YuTing, B., Wei, W., W. Hao, 2006. Study on diversity of oats varieties in Xinjiang. Xinjiang Agricultural Sciences. 43(6): 510-513.
Yu, J., Pressoir, G., Briggs, W.H., Vroh Bi, I., Yamasaki, M., Doebley, J.F., McMullen, M.D., Gaut, B.S., Nielsen, D.M., Holland, J.B., Kresovich, S., E.S. Buckler, 2006. A unified mixed-model method for association mapping that accounts for multiple levels of relatedness. Nat. Genet. 38: 203-208.