Title page
Title: The contribution of testing in the fight against COVID-19: Evidence from Italy
Corresp. Author: Alessandro De Matteis (PhD) University of East Anglia NR4 7TJ Norwich, UK +44 (0)1603 592893
[email protected] [email protected]
Co-Author: Fethiye B. Turkmen Ceylan (PhD) University of East Anglia
Co-Author: Marina Adrianopoli (MSc) World Health Organization
Co-Author: Sibel Ertek (MD) Istinye University
© The Author(s) 2021. Published by Oxford University Press on behalf of the European Public Health Association. All rights reserved.
The contribution of testing in the fight against COVID-19:
Evidence from Italy
Abstract
Background
In response to the COVID-19 epidemic a few countries have rolled out widespread testing of the population, while in other countries only people requiring hospital admission are being screened. After an extensive testing strategy during the initial few weeks in the early phase of the epidemic, the Italian Ministry of Health made its testing policy more stringent. In this study we assess the contribution of the testing policy to containing the spread of the COVID-19 epidemic in Northern Italy.
Methods
The analysis is focused on the evolution of the epidemic and related health intervention in four regions where approximately 80% of the national death toll due to COVID-19 has occurred.
The assumed under-estimation of asymptomatic cases has led us to make use of the number of deaths due to the epidemic to analyse the effectiveness of testing. The analysis is conducted through an autoregressive time-series approach where we use official data from the Ministry of Health.
Results
The results of the analysis confirm a negative relationship between the number of tests carried out and the progression of the epidemic. In particular, results reveal that the tests are particularly effective in breaking the chain of transmission when they are implemented at the early stages of the spread of the virus.
Conclusions
A large-scale testing policy is recommended as a critical contribution to effectively contain the epidemic. In addition, it is highly recommended to set up all necessary measures to enable the quick scale-up of testing capacity whenever required.
Keywords: COVID-19; Testing policy; VAR model; Italy
Introduction
Estimation of the prevalence of COVID-19 is difficult because of both the rapid spread of the infection and the different methods different countries are using to detect and try to control the disease. Infection has a variety of symptoms: it can be completely asymptomatic or may show severe symptoms. Unless asymptomatic cases and patients with mild symptoms are properly tested they will remain unknown, leading to an underestimation of the prevalence of the infection. In addition, the transmission of the virus can occur before symptoms appear and the difficulty of detecting asymptomatic cases contributes to the further spread of the infection.
The response to COVID-19 has generally focused on two priorities. Besides a substantial
strengthening of intensive care unit (ICU) capacity, a variety of containment measures have been put in place, most focusing on social distancing and different degrees of lockdown, in some cases imposing constraints on personal freedom. A few countries have rolled out widespread testing with massive screening of the population, while in other countries only people requiring hospital admission are being screened.
Italy was the first country in Europe to be affected and one of those paying the highest death toll due to the epidemic. While Italy was able to cope with the rapid and continual increase in ICU admissions during the expansion phase of the infection’s first wave, which was mainly
concentrated in a few northern regions, laboratory capacity for testing for COVID-19 reached saturation very early, reducing the ability to make accurate diagnoses.1 After an extensive testing
strategy in the very early phase of the epidemic, on February 25 the Italian Ministry of Health made its testing policy more stringent, prioritizing testing for patients with severer symptoms and those who required hospitalization while drastically reducing testing for asymptomatic people and those with only mild symptoms.2
A few studies have focused on ICUs, and particularly on the ICU capacity/size required to fight the epidemic.3 However, although the relevance of testing and other measures to contain the spread
of the infection has repeatedly been remarked,4 no effort has been made to assess the
contribution of tests and the adopted testing policy to containing the spread of the epidemic.
Boosting disease detection, and particularly early detection, can contribute to the disruption of chains of transmission, which should in turn have a direct impact on the incidence of infections. As mentioned above, the large share of asymptomatic cases affects the capacity to monitor the evolution of the COVID-19 epidemic and the capacity to assess the effectiveness of containment measures. In these conditions fatality rates can provide a suitable proxy to monitor the evolution of the epidemic. Therefore, while testing does not have any direct effect over fatality rates, an increase in testing can improve case detection and the disruption of chains of transmission, with consequent implications on the progression of the disease, which in our case is monitored through the evolution of fatality rates.
Countries have given different weight to the use of tests in the fight against COVID-19, as shown by the set of indicators presented in Supplementary Table 1, each of which is based on a different perspective. For instance, it is interesting to consider that by the time of this study Italy and the US have carried out a similar average number of tests per capita, however the average number of tests per patient in the two cases is significantly different. Along the same lines, although Germany has carried out a lower number of tests per capita than the US, on average Germany has carried more than twice as many tests per patient as the US.5 Nevertheless, the estimation can be further
refined: the consideration that a remarkable share of infected people are asymptomatic and/or remain undetected leads to the assumption that the calculation is biased by the underestimation of the number of infected people. This underestimation is neither irrelevant nor negligible, as asymptomatic cases can transmit the infection and their asymptomatic status can lead to the
undetected spread of the epidemic. Therefore in the absence of clear estimates of the number of asymptomatic cases, a better approximation to measure the adequacy of the number of tests for the severity of the situation is the ratio between the number of tests carried out and the number of deaths caused by the infection. Obviously, even this estimation is imprecise to a certain extent due to possible under-reporting of deaths associated with the virus. Nevertheless, it can be considered a better approximation to the true value. Due to the higher precision of replacing the number of cases with the number of deaths, the range of the new estimates is quite wide and contributes to a more precise measure of the relevance and appropriateness of the use of tests. To put things in perspective, it is necessary to consider that by mid of June, while Italy, the UK and Spain have conducted respectively between 135 and 178 tests per each death caused by the virus, the US has conducted more than 200, Germany more than 500, and South Korea almost 4000 tests. The implications of these results are obvious: the knowledge generated through the tests has put South Korea and Germany in a better position than the other countries listed in the table to contain the spread of the epidemic.6
In this study we analyse the evolution of the epidemic in Italy to assess the relationship between the implementation of tests and the number of deaths due to COVID-19.
Methods
Data
In this study we compare the evolution of the daily number of deaths occurred in a few Italian regions due to COVID-19 against the evolution of the daily number of tests carried out. We make use of data on the number of deaths due to the epidemic, the number of detected cases –
arranged by the severity of the infection – as well as the number of tests carried out. This study covers the period between March 8 and June 13 2020. Data are sourced from the Italian ministry of health (Ministero della Salute).7
Vector Autoregressive approach
The following two considerations suggest the adoption of a time-series approach for the analysis:
a) death is the end of a disease which lasts for several days;
b) the identification of infective cases following positive test results leads to both curative and containment measures that are expected to continue after the test and to achieve results over time, in terms of reducing the number of both new infections and new deaths.
In particular, since case detection and subsequent deaths are between 2-3 weeks apart, reflecting the clinical course of the disease, this study requires a methodological approach which takes into account such a delay. Furthermore, since there is a gap in time between contagion and death and the test can be carried out at any stage of this and even after death, the relationship between the evolution of the number of tests carried out and the evolution of deaths associated with the virus has been analysed using a time-series approach to take into account the delayed relationship between the evolution of the number of tests and that of the number of deaths. In particular, we have processed daily data with a vector autoregressive (VAR) methodology. To our knowledge, this is the first time that a VAR model is used to infer a delayed behaviour of COVID-19 fatality rates in respect to a percentage change in the number of tests administered. Mathematically, the VAR model is a typical linear regression model, which is built on the previous values of multiple variables in order to grasp the underlying dynamics among them through the analysis of the variables’ changes over time. A VAR model presents a series of features which are particularly
valuable in our study. First of all, the functional relationships among the variables are analysed through a systemic approach, which allows to take into account simultaneous and multidirectional links among the variables. A second benefit is the availability of the Granger-causality test, which allows to assess the existence and direction (i.e. unilateral versus bilateral) of causality for each couple or group of variables. In addition, the impulse response functions (IRF) derived from a VAR model allow to estimate and visualize the short-run dynamics of the relationship among each subset of variables.8
Overall, in our case the main benefit of adopting the VAR analytical approach is that it uses the daily dynamics of the data to measure the response of death numbers in respect to the number of tests administered. Hence, even short series of high-frequency data can highlight functional relationships which, otherwise, would be hidden by the delayed evolution of the infection from its early stage into a full-blown case.
In this study VAR models were initially estimated for the entire period covered by this study. Subsequently, the estimation was replicated on a shorter dataset related to the period between March 8 and April 3 2020, which covers the rising tail of the first wave of the epidemic curve experienced in Italy. Finally, IRFs were used to simulate the short-run relationship between tests and fatality rates.
Results
As shown in Supplementary Figure 1, the first wave of the epidemic in Italy has seen a rapid spread of the infection with a sudden increase in the number of deaths and hospital admissions. Pressure
on the ICUs has been mounting, in some cases going beyond the maximum available capacity.9
The number of tests implemented, however, increased at a lower rate than the number of deaths and of detected cases of infection.
The epidemic has mainly affected a few of Italy’s northern regions. We focus here on four regions in which approximately 80% of the national death toll due to COVID-19 has occurred. Figure 1 shows the different levels of testing in each region in relation to the number of deaths. As shown by Figure 1 and Supplementary Table 2, attention to testing has generally been low, with the exception of Veneto, whose share of the overall testing conducted in Italy is approximately three times its share of the total national death toll due to the epidemic. Besides this regional
imbalance, Figure 1 reveals changes over time in the testing policy in each of the four regions and nationally: in all cases during the initial few weeks the number of tests carried out was unable to keep pace with the rapidly spreading epidemic and the increasing number of deaths.
Figure 1 Evolution of the average number of tests conducted per number of deaths
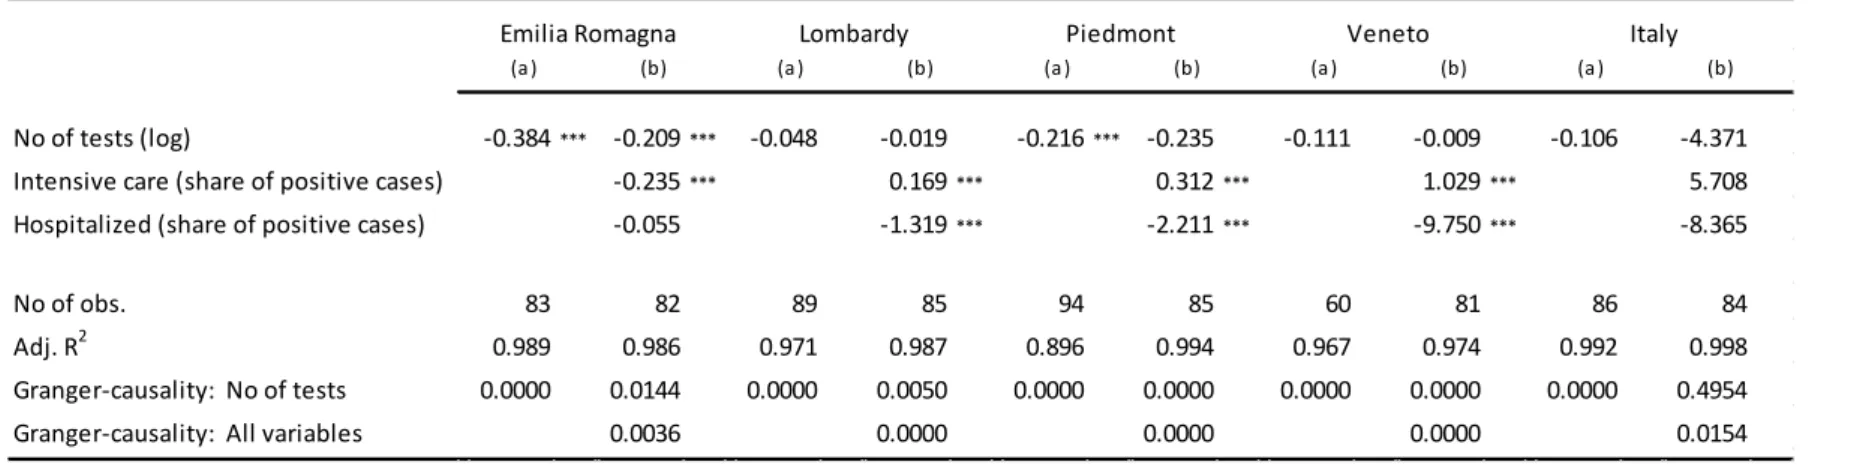
Table 1 reports relevant extracts from the results of the VAR models applied. The variables on the number of tests carried out and on the number of deaths are expressed in logarithmic form and therefore the coefficients can be interpreted as the responsiveness of fatality rates to changes in the number of tests: i.e. the percentage change in the number of deaths associated to a one percent increase in the number of tests carried out. Two versions of the model are presented in Table 1. In (a) the variable about the testing strategy is considered on its own, while in (b) the
same variable is accompanied by two variables aimed at capturing the severity of the patients’ clinical conditions: the share of patients treated in ICU and the share of patients currently
hospitalized, with the two variables remarking respectively critical and milder conditions. While an increase (reduction) of the ICU caseload highlights worsening (improving) conditions, the same does not necessarily apply for the caseload of hospitalized patients, since the latter may refer either to new admissions (reflecting a worsening trend) or to patients newly released from ICU (reflecting an improving trend).
Overall, the results of the analysis highlight a negative relationship between the number of tests carried out and the number of deaths occurring, used in this case as a proxy for the progression of the epidemic.
Table 1 Relationship between the number of tests and the number of deaths
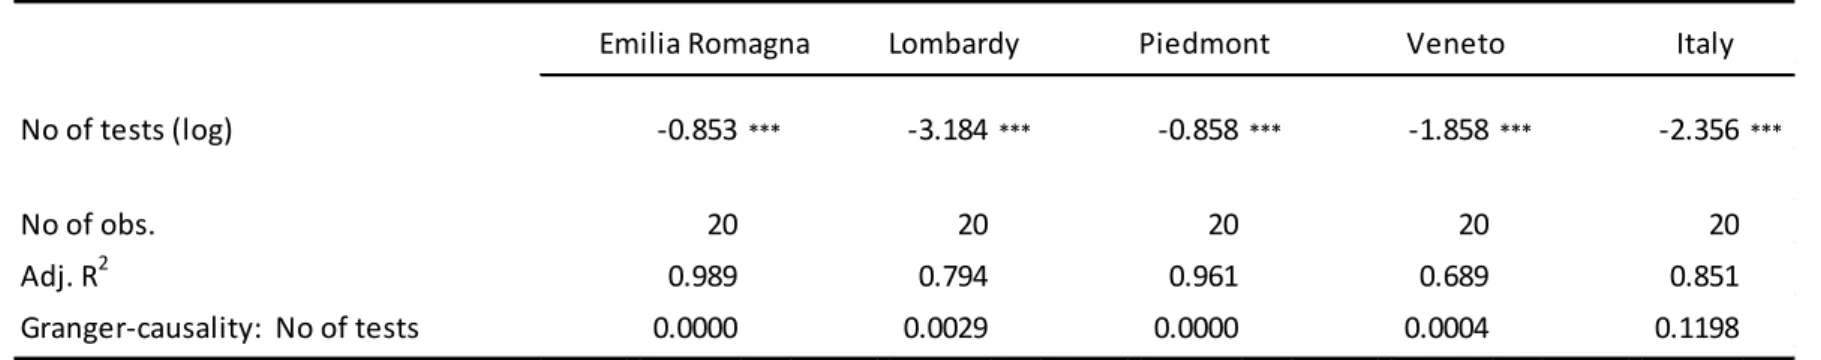
At this stage we move the analysis a step further and focus on the early stages of the progression of the epidemic in order to assess the effectiveness of testing strategy in that phase. Our
expectation is that the exponential progressivity of the infection may reveal a higher effectiveness of the testing strategy when the latter is implemented at the early days of the spread of the virus. Results are reported in Table 2. In this case we have considered only single-variable models – i.e. the equivalent of model (a) in Table 1 – since the timeframe covered may be unable to capture the effectiveness of the treatment modalities considered through model (b).
Table 2 Relationship between the number of tests and the number of deaths during the early phase of the epidemic
Once again the sign of the coefficient of the test variable highlights a negative relationship between the number of tests implemented and the progression of the epidemic. In this case all coefficients are significant. In addition, each coefficient presented in Table 2 is larger than its counterpart in Table 1, remarking the higher effectiveness of early testing.
Finally, about the short-run interaction between tests and fatality rates, the VAR allows us to simulate impulse functional responses, that is how the number of deaths behaves once an external shock is imposed on number of tests. In our case, this means assessing how much a sudden increase in the number of tests conducted would affect the number of deaths related to the epidemic. For this purpose Figure 2 shows the short-term relationship between the number of tests carried out and the number of deaths occurring. In particular, it presents the daily changes in the number of deaths that can be expected to follow a percentage increase in the number of tests carried out. The decreasing trend is evident in Lombardy, Emilia Romagna and particularly Veneto. It is less evident at the national level and finally, it is absent in Piedmont. The IRF related to
Piedmont is characterized by high variability, reflecting unfavourable conditions, maybe due to inconsistent implementation of testing strategy or due to other unfavourable contextual strategic settings. On the contrary, the IRF related to Veneto is quite straight and has a remarkable negative slope, remarking the consistency and effectiveness of the adopted testing strategy as well as of the overall intervention strategy.
Figure 2 IRFs: Changes in the number of deaths over 30 days following a percentage increase in the number of tests conducted on day zero
Discussion
The finding mentioned above about the negative relationship between the number of tests and the number of deaths applies to each of the four regions considered, as well as to the aggregate data for Italy, as remarked by the negative coefficient of the variable related to test numbers. Having said that, while all the coefficients of the test variable have the expected (i.e. negative) sign, in some cases they have no statistical significance. This applies to models about Lombardy and Veneto and about Italy as a whole in Table 1, while all models and coefficients reported in Table 2 are significant.
Granger-causality proceeding from the number of tests to the number of deaths is confirmed for all regions, but not for the aggregate national case, highlighting the geographical concentration of the epidemic during the first wave, which has only mildly affected the central and southern parts of the country.
Overall, the results mentioned above support the argument that an increase in testing can
improve case detection and the disruption of chains of transmission, with consequent implications on the progression of the disease. In particular, the larger value of coefficients related to the rising tail of the epidemic curve remark the higher effectiveness of early testing: since the epidemic
tends to expand exponentially, the earlier the test is conducted the larger is expected to be its contribution in contrasting the expansion of the epidemic.
On the methodological side, this study has shown how the VAR analytical approach can use short series of high-frequency data to highlight functional relationships which, otherwise, would be hidden by the delayed evolution of the infection from its early stage into a full-blown case. However, after considering the favourable features of the VAR modelling framework, it is also necessary to consider that the analytical power of a VAR model is linked to its number of variables. The larger the latter, the stronger is expected to be the analytical power of the VAR model. In our case, collapse in medical care is considered as bias, and therefore the models used above could be further improved by taking into account the degree of utilization of available capacity, particularly in terms of ICU as well as in terms of test administration and processing. Having said that, such variables change slowly overtime and therefore their use in the VAR model would end up constraining substantially the analytical power highlighted earlier on.
Conclusions
This analysis has shown that testing can play an effective role in containing the spread of the epidemic. Italy’s testing strategy in response to the epidemic has been rather inadequate to the size and progression of the latter. The fact that this inadequacy is shared by many other countries cannot be much of a justification.
Overall, the isolation strategy adopted in Italy has been successful. Nevertheless, the transmission of the virus by people with mild or no symptoms reduces the effectiveness of the isolation
strategy. Therefore testing of potential cases needs to be as extensive as health-care resources and diagnostic testing capacity allow. While the limitations of Italy’s laboratories and diagnostic capacities are not new,10 the outbreak of COVID-19 is an opportunity to review Italy and other
countries’ preparedness. Massive strengthening of available diagnostic capacity is of paramount importance to enable the quick scale-up of testing capacity whenever required.
On the analytical side, it is recommended to replicate this study over a longer timeframe and a larger dataset, possibly on a multi-country basis, in order to better capture the relevance of contextual and policy components.
Author statements:
Ethical Approval
Not required (this study did not require ethical approval as it used publicly available secondary data).
Funding
NoneConflict of Interest
NoneContributors
All authors contributed equally.
Key-points:
The transmission of the virus by people with mild or no symptoms reduces the effectiveness of the isolation strategy.
Testing can play an effective role in containing the spread of the epidemic.
Testing of potential cases needs to be as extensive as health-care resources and diagnostic testing capacity allow.
Strengthening of available diagnostic capacity is of paramount importance to enable the quick scale-up of testing capacity whenever required.
References
1 Grasselli G, Pesenti A, Cecconi M. Critical Care Utilization for the COVID-19 Outbreak in
Lombardy. Italy: Early Experience and Forecast During an Emergency Response. JAMA. Published online March 13, 2020. doi:10.1001/jama.2020.4031
2 Onder G, Rezza G, Brusaferro S. Case-Fatality Rate and Characteristics of Patients Dying in Relation to COVID-19 in Italy. JAMA. Published online March 23, 2020.
doi:10.1001/jama.2020.4683
3 Remuzzi A, Remuzzi G. COVID-19 and Italy: What Next? Lancet. Published online March 12, 2020. doi:101016/S0140-6736(20)30627
4 Cecconi M, Forni G, Mantovani A. COVID-19: An Executive Report. Accademia Nazionale dei Lincei; 2020. https://www.lincei.it/it/article/covid-19-executive-report
5 Worldometer. COVID-19 Coronavirus Pandemic. https://www.worldometers.info/coronavirus/
Accessed June 15, 2020
6 Ibidem.
7 Ministero della Salute. COVID-19: Situation Report Update.
http://www.salute.gov.it/portale/nuovocoronavirus/archivioNotizieNuovoCoronavirus.jsp
Accessed June 15, 2020
8 Additional resources about VAR and IRF can be found respectively at
https://www.stata.com/manuals/tsvar.pdf and https://www.stata.com/manuals/tsirf.pdf
9Ministero della Salute. COVID-19: Situation Report Update.
https://www.agenas.gov.it/covid19/web/index.php?r=site%2Fheatmap Accessed June 15, 2020
10 OECD/EU. Health at a Glance: Europe 2018: State of Health in the EU Cycle. Paris: OECD Publishing; 2018. https://doi.org/10.1787/health_glance_eur-2018-en
Figure legends
Figure 1 In all regions considered and in Italy as a whole the number of tests carried out was unable to keep pace with the rapidly spreading epidemic and the increasing number of deaths.
Figure 2 Short-term relationship between the number of tests carried out and the number of deaths occurred in each region and in Italy as a whole. In particular, the graphs provide a comparative view of the daily changes in the number of deaths that can be expected to follow a percentage increase in the number of tests carried out.
Tables
Table 1 Relationship between the number of tests and the number of deaths
(a) (b) (a) (b) (a) (b) (a) (b) (a) (b) No of tests (log) -0.384*** -0.209*** -0.048 -0.019 -0.216*** -0.235 -0.111 -0.009 -0.106 -4.371
Intensive care (share of positive cases) -0.235*** 0.169*** 0.312*** 1.029*** 5.708
Hospitalized (share of positive cases) -0.055 -1.319*** -2.211*** -9.750*** -8.365
No of obs. 83 82 89 85 94 85 60 81 86 84
Adj. R2 0.989 0.986 0.971 0.987 0.896 0.994 0.967 0.974 0.992 0.998
Granger-causality: No of tests 0.0000 0.0144 0.0000 0.0050 0.0000 0.0000 0.0000 0.0000 0.0000 0.4954
Granger-causality: All variables 0.0036 0.0000 0.0000 0.0000 0.0154
Emilia Romagna Lombardy Piedmont Veneto Italy
Significance: *** = 0.01
Table 2 Relationship between the number of tests and the number of deaths during the early phase of the epidemic No of tests (log) -0.853*** -3.184*** -0.858*** -1.858*** -2.356*** No of obs. 20 20 20 20 20 Adj. R2 0.989 0.794 0.961 0.689 0.851 Granger-causality: No of tests 0.0000 0.0029 0.0000 0.0004 0.1198 Italy Emilia Romagna Lombardy Piedmont Veneto
Significance: *** = 0.01
209x297mm (300 x 300 DPI)
297x209mm (300 x 300 DPI)