EKO Varna 2019
IOP Conf. Series: Materials Science and Engineering 614 (2019) 012015
IOP Publishing doi:10.1088/1757-899X/614/1/012015
Flue Gas Desulfurization by Using Calcined Dolomite
S Baslayici1,2, M Bugdayci3, A Turan3, L Oncel4 and E Acma1¹Istanbul Technical University, Faculty of Chemistry and Metallurgy, Metallurgical and Materials Eng. Dep., 34469, Istanbul
²Istanbul Medipol University, Vocational School, Construction Technology Dep., 34810, Istanbul, Turkey
3Yalova University, Chemical and Process Engineering Department, Yalova, 77100, Turkey 4Sinop University, Faculty of Engineering and Architecture, Department of Metallurgical and
Materials Engineering, 57000, Sinop, Turkey
Abstract. SO2 emissions has begun to cause serious problems in industrialized countries.
Today, various methods are used for removal of SO2 gas. SO2 gas is an important raw material
for production of sulfuric acid. However, SO2 content of flue gas must be over 6% to produce
sulfuric acid commercially. Flue gases, which don’t have enough amount of SO2 to produce
sulfuric acid commercially are harmful to the environment and human health and they must be filtered. In this study, calcined dolomite was used to remove SO2 in flue gas which doesn’t
have enough SO2 to produce sulfuric acid but have high emission values. Pyrite was used as
SO2 source and SO2 removal efficiency of dolomite was determined for different experimental
parameters. SO2 capturing system was thermodynamically modeled and SO2 capturing
efficiency was determined as 77.81% in the experiments.
1. Introduction
The increasing population of the world and industrialization leads to an increase in energy needs. Use of fuels with sulfur content has been increasing to meet the rising energy demand. Emission of air-pollutant gases has been rising for that reason [1].
Sulfur dioxide (SO2) is known as the most important air-pollutant gas. Main reasons that causes
arising of SO2 are natural sources and human activities. Microbial activities, volcanic eruptions,
combustion of sulfur-containing fossil fuels, molten sulfur ores and oil refineries are among the causes of SO2 formation. [2-6].
SO2 is highly soluble in water and SO2 in flue gas is used as raw material in sulfuric acid production. On the other hand, SO2 content of flue gas must be over 6% to produce sulfuric acid commercially. It is necessary to filter the flue gases containing SO2 which do not have enough SO2 amount for production of sulfuric acid commercially. It may cause serious irreversible damage if they are released directly into the nature. [7-11]. SO2 gas pollutes the nature and it also increases the risk for cardiovascular diseases and lung cancer [12-14].
Sulfur dioxide is a colorless, sour-scented, fireproof and stifling gas. Taste of SO2 can be detected when its concentration reaches to 785 µgr/m3 and SO2’s smell can be detected when its concentration reaches to 1305 µgr/m3 in the atmosphere. Sulfur dioxide is present in volcanic gases and its level is high in industrialized regions. SO2 is formed with combustion of sulfur-containing coals. This gas is condensed as a colorless liquid when cooled to -10 °C and it is solidified in white crystalline form when cooled to -73 oC [1, 15].
EKO Varna 2019
IOP Conf. Series: Materials Science and Engineering 614 (2019) 012015
IOP Publishing doi:10.1088/1757-899X/614/1/012015 Resea pollutant industry are obtai In other these pro Main in Turke studies w 2. Exper In the ex composi 1. Mine ((H3O)F concentr sphalerit particle s Calci procured shown in Sample Dolomit S P archers have t gases like s , gas-liquid ined by usin situations, c ocesses prod n inorganic so ey, dolomite were compar rimental xperimental s ition of pyrit eralogical ex e3(SO4)2(OH
rate was pyr te, digenite size of pyrite ined dolomit d from Kum n Table 2. Ca e Loss te Sample Pyrite 3 e been worki sulfur dioxid reactions an ng activated c atalysts (gen duce SO2 gas orbent used e is used as red to the pre studies, pyrit te ore is give T F xaminations H)6) minerals
rite and ther and various e was 41 µm te used in e mas Magnezi alcined dolom T on Ignition 9.52 Fe,% 38,18 4 ing on devel de (SO2), nitr nd gas-solid r carbon and l nerally vanad as by produc in this proce inorganic so evious literatu te ore from K en in Table 1 able 1. Chem Figure 1. XR show that s were pres re were trac s silica min m. experimental it Sanayi Co mite’s mean Table 2. Chem CaO% 57.59 S% C 41,67 0 loping cost-e rogen oxide ( reactions are liquid alkali dium pentoxi ct [19]. ess is calcite orbent in thi ure, where c Kure region and XRD a mical compo RD analysis pyrite (FeS sent in the ce amount o nerals. Acoo l studies wa orporation. C grain size w mical analys MgO% 31.00 Cu% M 0,58 0, effective sys (NOX) and c e used for de materials (li ide) are used but in order is study. Res alcite and ac of Turkey w analysis resul osition of pyr of Pyrite ore S2), quartz pyrite conc f chalcopyri ording to pa as Kutahya Chemical an was 42 µm. is of dolomit FeO% 0.12 g% Ca ,38 0,7
stems for dec arbon monox esulfurizing. ime slurry an d to turn SO2 to utilize lar sults obtaine ctive carbon a was used as S lt of pyrite o rite e. (SiO2) and entrate. Mai ite, covelline article size m Yaylababa nalysis of Ya te. Al2O3% Trace a% SiO2 77 9,3 creasing lev xide (CO) [1 . Gas-liquid nd ammonia into sulfuric rge dolomite ed from expe are used. SO2 source. C ore is shown hydronium in mineral e, marcasite measuremen dolomite an aylababa do SiO2% N 1.07 2% K% 33 0,02 els of air 16-18]. In reactions a) [1, 17]. c acid but e reserves erimental Chemical in Figure m jarosite of pyrite , bornite, nts, mean nd it was olomite is Na2O% 0.0086 % 2
EKO Varna 2019
IOP Conf. Series: Materials Science and Engineering 614 (2019) 012015
IOP Publishing doi:10.1088/1757-899X/614/1/012015
Thermo Scientific XSeries 2 ICP-MS was used for chemical analyses of the samples. Bruker D8 Advance was employed for XRD analyses and mineralogical examinations. Roasting operation were carried out in a tube furnace working with 220V electricity. Samples were grinded with ring mill and dehumidified in Binder drying-oven. Samples particle size were measured with Malvern Mastersizer 2000.
In the roasting experiments, ceramic boat was weighed initially and it was weighed again after filling with pyrite. Pyrite was roasted in furnace and weight loss caused by roasting was measured by weighing. Roasting process was carried out with different times and optimum roasting time was
determined. Various air flow rates were used in SO2 capturing experiments. SO2 emissions were
measured after roasting process for every air flow rate used. SO2 emission measurements after roasting
process were repeated for different flow rates with using dolomite for capturing SO2 gas. Then, SO2
capturing results were compared.
Titrimetric method was used in SO2 analysis. In this method, gases released from the flue were kept
in the hydrogen peroxide solution which was in the washing bottle and it was converted to sulfuric
acid. Concentration of SO2 was determined by titration with a base with a known normality.
100 ml. of a 1% H2O2 solution was filled in each of the two gas washing bottles, which were
coupled in series. Gas exited from the flue was transferred to first gas washing bottle. SOX was
oxidized to acid by H2O2 in the washing bottle. SOX gas, which didn’t react in the first washing bottle
moved to second washing bottle and reacted with H2O2. After the process was completed, solutions in
two washing bottles were titrated with alkali (1N Na2CO3) and equivalent SO2 quantity in the flue gas
was determined. Reactions took place in this process are given in Equation 1 and Equation 2.
SO2+ H2O2 SO3+H2O (1)
SO3+ H2O H2SO4 (2)
Total reaction is shown in equation 3.
SO2+ H2O2 H2SO4 (3)
Acid’s titration reaction is given in Equation 4.
H2SO4+ Na2CO3 Na2SO4+H2CO3 (4)
SO2 concentration in the gas mass is calculated as shown in Equation 5. Here, N is normality of the
base and S is base consumption (ml).
SO2 (mg/l) = (32. NNa2CO3. SNa2CO3) / volume of air (l) (5)
SO2 capturing experiments were started after determining the roasting conditions in the first
experimental set. Calcined dolomite was used to capture SO2 in this experimental set. Different air
flow rates were used in SO2 capturing experiments. Initially, SO2 formation amounts were determined
for every air flow rate used. Then, dolomite was used to capture SO2, and capturing efficiencies were
compared. The amount of dolomite was determined by weighing the empty boat and then weighing the boat filled with dolomite. The resulting products were weighed and compared with roasting experiments’ results.
3.Results and Discussion
In the experimental studies,quantity of theoretical air requirement for roasting of pyrite was calculated
initially. Studies were carried out with two times, four times, six times and eight times of the theoretical air quantity. According to Equation 6; in order to obtain 0.0651 mole S, 0.31 mole of air is required. Table 3 represents roasting experiments’ conditions.
EKO Varna 2019
IOP Conf. Series: Materials Science and Engineering 614 (2019) 012015
IOP Publishing doi:10.1088/1757-899X/614/1/012015 Exp. No 1 2 3 Avg.15 4 5 6 Avg. 30 7 8 9 Avg. 45 10 11 12 Avg. 60 Expe calculate quantity with fou process w Figur SO2% w SO2% am 2 shows flow rate o Duration (min.) 15 5 30 0 45 5 60 0 eriments wer ed. Roasting was not eno ur times of th
was not nece re 2 shows e was increased mount remai that optimu e. Ta n Flow Ra (l./min 1 re repeated experiments ough to comp he theoretica essary. effect of roas d exponential ined nearly c um roasting c Figur ble 3. Roasti ate n.) Weig Roa three times s showed tha plete the roa al air quantit sting time on lly when roa constant whe conditions of re 2. Change ing experime ght Before asting (g.) 5.79 5.78 5.30 5.62 5.34 5.25 5.33 5.30 5.17 5.32 5.31 5.26 5.34 5.29 5.17 5.26
s for all roa at 1 l./min. a asting proces ty used and n SO2% form asting time w en roasting ti f pyrite is 30 e of SO2% am ents’ conditio Weight Af Roasting ( 3.93 3.93 3.60 3.82 3.44 3.39 3.43 3.42 3.34 3.43 3.42 3.39 3.44 3.41 3.33 3.39 asting condi air flow rate s. Roasting e it was deter mation. It is was increased ime exceede 0 minutes of mount versus ons. fter (g.) Differ (g. 1.8 1.8 1.7 1.8 1.8 1.8 1.9 1.8 1.8 1.8 1.8 1.8 1.8 1.8 1.8 1.8 itions and a and 2 times efficiency wa rmined that u seen in the f d from 15 m d 30 minutes roasting tim s time. rence .) SO2 A (m 86 3 85 3 70 3 80 3 89 3 86 3 90 3 88 3 83 3 88 3 88 3 86 3 89 3 87 3 83 3 86 3 average valu of the theor was increased using more figure that a minutes to 30 s. Table 3 an me and 1 l./m Amount mg./l.) 2.15 2.08 2.10 2.11 5.52 5.47 5.68 5.55 5.44 5.36 5.47 5.42 5.53 5.45 5.50 5.49 ues were retical air d to 100% air in the mount of minutes. nd Figure min. of air
EKO Varna 2019
IOP Conf. Series: Materials Science and Engineering 614 (2019) 012015
IOP Publishing doi:10.1088/1757-899X/614/1/012015 After 6.2 datab with tem Two and dolo SO2 capt in Table In SO between occurrin Therefor capturing Effec with con capturing doesn’t p capturing Accordin will show When average al. obtai Turkey m dolomite captured using do r roasting ex base. Figure mperature. Fig Figure 3. St boats were u omite was ch turing experi 4 is shared i O2 capturing solid and g ng of reactio re, flue gas
g result was ct of tempera nstant air fl g efficiency. provide info g efficiency ng to these d w insignifica n all results emission val ined 82% S make dolom e can be con d by using ca olomite instea xperiments, S e 3 illustrates gure 3 shows tandard free used in SO2 c harged in the iments. SO2 in Figure 4. g experiment gas is increa ons remain s desulfurizat obtained as ature on SO2 low rate. Re . On the oth ormation abo increased in data, flue ga ant changes d are taken in lues lower th O2 capturing mite a good a nverted into alcite but reg ad of calcite SO2 capturin s standard fr s that dolomi energy of do capturing exp second boat capturing am ts, better res sed at low a same but co tion efficien 77.76% whe capturing ef esults showe her hand, hig ut low temp nsignificantl as desulfuriza due to the na nto consider han 1285µg p g efficiency alternative to sulfuric aci generation o is advantage ng system w free energy o ite will be su olomite-pyrit periments. P t. Table 4 pr mount versus sults were o air flow rate ontact time ncy increase en 0.4 l. /min fficiency wa ed that temp gh temperatu peratures like ly from 77.7 ation efficien arrow temper ration, filteri per hour, 48 by using a o active carb id [20]. Mat f captured S eous [21]. as thermody of dolomite a ulphated and te system cha Pyrite concen resents exper s time curve, obtained at l es. Contact s is increased s at low air n. air flow rat s investigate perature did ures were use
e room temp 76% to 77.8 ncies of the rature range o ing with dol
5 µg per day active carbon bon. In this thieu et al.’s SO2 is not po ynamically m and pyrite co pyrite will b anging with ntrate was cha
rimental para , which was low air flow urface area, d with using r flow rates te was used. ed by using d dn’t have a ed in experim perature. Figu 1% with inc companies u of the flue ga lomite is sui y and 214 µg n but large study, SO2 w s study show ossible in thi modeled via oncentrates be oxidized a temperature harged in the ameters and created by u w rates. Con which is ne g low air flo s. The optim different tem significant e imental studi ure 4 shows creasing tem using sulphu ases.
itable for pla g per year. M dolomite re which is cap wed that SO is method. T FactSage changing at 600 ºC. . first boat results of using data ntact time eeded for ow rates. mum SO2 mperatures effect on ies and it that SO2 mperature. urous fuel ants with Mangun et serves in ptured by O2 can be Therefore,
EKO Varna 2019
IOP Conf. Series: Materials Science and Engineering 614 (2019) 012015
IOP Publishing doi:10.1088/1757-899X/614/1/012015
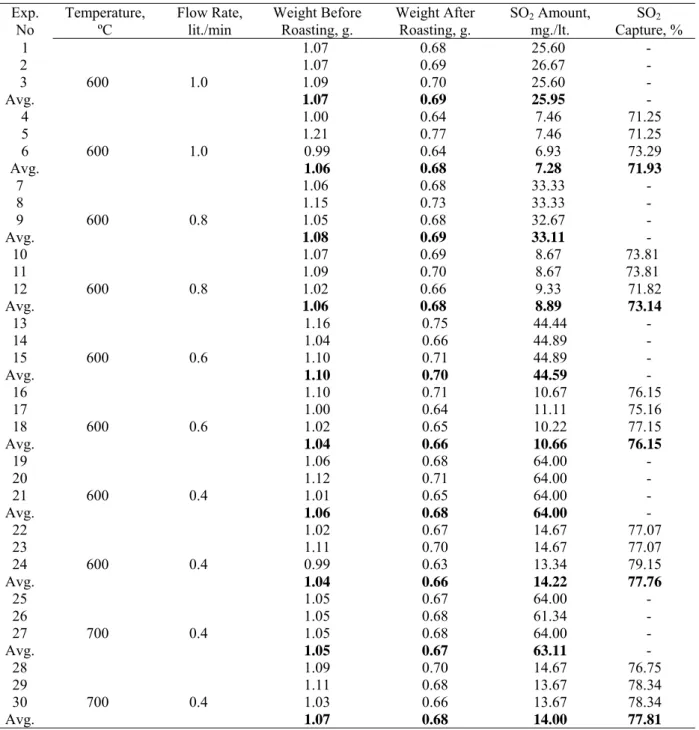
Table 4. Conditions and results of SO2 capturing experiments. Exp.
No Temperature, ºC Flow Rate, lit./min Weight Before Roasting, g. Weight After Roasting, g. SO2mg./lt. Amount, Capture, % SO2 1 600 1.0 1.07 0.68 25.60 - 2 1.07 0.69 26.67 - 3 1.09 0.70 25.60 - Avg. 1.07 0.69 25.95 - 4 600 1.0 1.00 0.64 7.46 71.25 5 1.21 0.77 7.46 71.25 6 0.99 0.64 6.93 73.29 Avg. 1.06 0.68 7.28 71.93 7 600 0.8 1.06 0.68 33.33 - 8 1.15 0.73 33.33 - 9 1.05 0.68 32.67 - Avg. 1.08 0.69 33.11 - 10 600 0.8 1.07 0.69 8.67 73.81 11 1.09 0.70 8.67 73.81 12 1.02 0.66 9.33 71.82 Avg. 1.06 0.68 8.89 73.14 13 600 0.6 1.16 0.75 44.44 - 14 1.04 0.66 44.89 - 15 1.10 0.71 44.89 - Avg. 1.10 0.70 44.59 - 16 600 0.6 1.10 0.71 10.67 76.15 17 1.00 0.64 11.11 75.16 18 1.02 0.65 10.22 77.15 Avg. 1.04 0.66 10.66 76.15 19 600 0.4 1.06 0.68 64.00 - 20 1.12 0.71 64.00 - 21 1.01 0.65 64.00 - Avg. 1.06 0.68 64.00 - 22 600 0.4 1.02 0.67 14.67 77.07 23 1.11 0.70 14.67 77.07 24 0.99 0.63 13.34 79.15 Avg. 1.04 0.66 14.22 77.76 25 700 0.4 1.05 0.67 64.00 - 26 1.05 0.68 61.34 - 27 1.05 0.68 64.00 - Avg. 1.05 0.67 63.11 - 28 700 0.4 1.09 0.70 14.67 76.75 29 1.11 0.68 13.67 78.34 30 1.03 0.66 13.67 78.34 Avg. 1.07 0.68 14.00 77.81
EKO Varna 2019
IOP Conf. Series: Materials Science and Engineering 614 (2019) 012015
IOP Publishing doi:10.1088/1757-899X/614/1/012015 4.Conclu The wor industrie emission develope term. Becau enough authoriti In ex Then, th Experim Roast quantity times of condition the theor In th condition flow rate 5. Refer [1] Ba [2] Li [3] Fo [4] Hu [5] Li [6] M Figure usion rld’s energy es. High SO n values are ed countries. use of the ha amount of ies must be f xperimental hermodynami ments showed ting conditio required wa f the theoret ns vary acco retical amoun he experimen ns. However es. rences aslayici S 2 Istanbul Te i N, Wang Z owler D and u K, Bai G, L i P, Wang X Res 18 (7) Majernik O an e 4. Effect of requirement O2 emissions e high in Tu . SO2 emissi armful effect SO2 to pro filtered. studies, min ic calculation d how theoret ons of pyrit as calculated ical air quan ording to the nt of air. nts, SO2 cap r, it is predic 2014, Flue echnical Univ and Zhang Z Unsworth M Li W, Yan H X, Allinson G 1090-1097. nd Mansfield f temperature t has been in caused by urkey and it on values of ts of SO2 gas oduce sulfuri neralogical a ns were carri tical calculat te concentra d theoreticall ntity was en content of th pturing effic
cted that eff
Gas Desulp versity, Turk Z 2018, Envi M H 1977, Qu H, Hu, Li L a G, Li X, Stag d T A 1970, N
e and air flow ncreasing be
use of fuels t continues f Turkey sho s on nature an ric acid com analysis of Y ied out and i tions were w ate were det ly and determ nough and th he concentra ciency of do ficiency valu phurization b key.
iron Sci Poll
uart. J. R. M and Zhang H gnitti F, Mur Nature 227 3 w rate on SO ecause of the s with sulfu to increase ould be reduc nd human he mmercially b Yaylababa d it was seen th working in pra termined by mined in pra here was no ate and it can olomite was ue may decre by Using C lut Res 25 (3 Met. SOC 105 2014, Plant rray F and X 377-378. 2 capturing a e developme ur content m despite the ced in the sh ealth, flue ga but above th olomite was hat dolomite actice. y experiment actice. It was need to use n be specified reached to ease in small Calcined Dol 5) 35099-35 767-783. Growth Reg Xiong X 201 amount. ent in techno must be redu e downward hort term and
ases which d he limits se s performed e can capture ts. The opti s seen that u e more air. O d as two to fo 77.76% at l amounts at lomite, MSc 108. gul 75 (1) 27 1, Environ S ology and uced. SO2 trend in d the long on’t have et by the initially. SO2 gas. imum air using four Optimum four times optimum t high air c Thesis, 71-280. Sci Pollut
EKO Varna 2019
IOP Conf. Series: Materials Science and Engineering 614 (2019) 012015
IOP Publishing doi:10.1088/1757-899X/614/1/012015
[7] Blakemore F B, Davies C and Isaac J G 1999, Appl Energy 62 (4) 283-295.
[8] Fenger J 2009, Atmos Environ 43 (1) 13-22.
[9] Harnisch J, Borchers R and Fabian P 1995, Environ Sci Pollut R 2 (4) 229-232.
[10] Shepherd M A, Haynatzki G, Rautiainen R and Achutan C 2015, J Air Waste Manag Assoc 65 (10) 1239-1246.
[11] Taieb D and Brahim A B 2013, C R Chim 16 (1) 39-50.
[12] Zhang D, Liu J, Jiang C, Li P and Sun Y 2017, Sens Actuators B Chem 245 560-567. [13] Chaudhary V, Kaur A 2015, Polym. Int. 64 (10) 1475-1481.
[14] Liu X Y, Zhang J M, Xu K W and Ji V 2014, Appl Surf Sci 313 405-410. [15] Azimi M, Feng F and Yang Y 2018, Sustainability 10 (2) 367.
[16] Miller M J 1986, Environ Prog Sustain Energy 5 (3) 171-177.
[17] Wark K, Warner C F, Davis W T 1998 Air Pollution: Its Origin and Control 3rd Edition, (California: Addison-Wesley), p. 573.
[18] Nersesian R L 2007, Energy for the 21st Century: A Comprehensive Guide to Conventional and Alternative Sources, (New York: M. E. Sharpe) New York, p. 456.
[19] Bauer G, Güther V, Hess H, Otto A, Roidl Roller O H, Sattelberger S, Köther Becker S, and Beyer T 2017 Vanadium and Vanadium Compounds (In Ullmann's Encyclopedia of Industrial Chemistry), (Online: Wiley VCH), p. 22.
[20] Mangun C L, Debaar J A and Economy J 2001, Carbon 39 1689–1696.
[21] Mathieu Y, Tzanis L, Soulard M, Patarin J Vierling M and Molière M 2013, Fuel Processing Technology 114 81–100.