w 0 w ~ ~ -§ ~ w ~ ~
categorization
Oliver \"/right
Rilkent University, Turkey
"lhis chapter reports three experimenls detailing the infiuences of stimulus range on color calegorization. The resulls show thal both categorization anJ speed
of categolization of color fol stimuli can be influenced by stimulus rnnge. 1\vo
potential consequences are consldered. fl rst, the influences of stlmulus range on color categorization can help explain inconslste ncies in the color literature relating to the reliability of color categorization. Second, the same influences appear relevant to the interpretation of experiments investigating color categorlcal perception.
e
1. Introduction: Color categorization and range effects~
'lhis chapler reports three experimenls addressing the issue of whether (and to what extent) changed range contexts influence judgments about color. A range effect would be shown if, for instance, a stimulus categorized most often as 'blue' when embedded in one stimulus range is categorized as 'green' mosl oflen when embeJded in a differ--ent stimulus range. Differences in the time taken to calegorize a stimulus contingdiffer--ent on its location in a stimulus range would be anotber kind of range effecl.
Little work has been done investigating the influence of range on color judgments. l'v1itterer and de Ruiter (2008) provide data suggesting that range effects do not influ-ence color categorization. This is somewhat surprising since numerous studies show other kinds of psychological judgments are influenced by slimulus range ( e.g. Crawford,
Huttenlocker & Engebretson 2000; Hollingworth 1910; Parducci 1965; Petzold 1982;
Petzold & IIaubensack 2004; \Vatson 1957).
Stimulus range might influence performance in several different ways. VVhat Hollinbf\vorlh (1910: 462) called the "cenlral tendency of judgment"' suggesls that slimulus eslimates are biaseJ towards lhe center of a presenled range. A relaled idea,
proposed by Parducci (1965) and Petzold (1982), is that participant reference scales
are adjusted to the endpoints of the subjective range, Poulton too (1973, 1974, 1989)
EBSCO eBook Academic Collection (EBSCOhost) - printed on 3/7/2019 5:44 AM via BILKENT UNIVERSITY AN: 398640 ; Biggam, C. P .. ; New Directions in Colour Studies
w 0
has given detailed consideration of range efh.'.cts and their intluence in within-subjects experimenlal designs.
[n studies that show influences of stimulus range on calegorical judgments, the categories used have usually been those for which participants musl eslablish their own standards, such as size judgments (Parducci 1965; Petzold & Haubcnsak 2004), It
is possible therefore that the lack of a range effect for color categorization reported by
lvlitterer and de Ruiler (2008) slerns from differences between color calegories and
other categories, such as size, which have a more arbitrary basis.
Another reason to be interested in the possible effects of range on color categori-zation relates to a lack of clarity concerning the reliability of color categoricategori-zation and
in parlicular the 'sharpness' of category boundaries. Berlin and Kay (1969: 13)
sug--gested that,
Calegory boundaries are nol reliable, even for repealed trials for lhe same inform ant ... In facl, in marked contrasl to the foci, category boundaries proved lo be so unreliable, even for an individual informanl, that they have been accorded a relatively minor place in lhe analysis.
Rosch Heider (1972) makes a similar point, classing stimuli located away from fixal
regions of color space 'internominal', whilst Kay and 1\1kDaniel (1978) proposed that
color categories be considered fuzzy sets.
On lhe olher hand, much evidence suggesls LhaL color space is categorized more
cleanly lhan the previous paragraph suggests (e.g. Boynton & Gordon 196.S; and
par-ticularly Bornslein & Korda 1984), Similarly, Malkrn;, Kay and We!Jsler (2005) founJ
that English speakers identified a boundary between blue and green categories more consistently than the best example of either color.
Such differences may be partially explicable in lerms of differences in response categories available to participants and also by differences in the lighlness and satura--tion of stimuli used in differing experiments. But variasatura--tions in stimulus range used in differing studies of categorization might also help explain the different results ob-tained. Such an explanation, Lhough, would only be valid if slimulus range can lie shown to influence categorization.
Finally, Lhe polenlial influence of stimulus range on color calegorizalion relates Lo color categorical perception (CP). CP is the idea that all other things being equal, discriminations between stimulus pairs belonging to difli:rent categories are made more reliably and/or faster than discriminations made between pairs belonging to the same category. Numerous studies have combined colorful stimuli and tasks such as target detection and visual search (e.g. Drivonikou, Kay, Regier, Ivry, Gilbert Franklin & Davies 2007; Gilbert, Regier, Kay & lvry 2006; Roberson & Davidoff2000), Results show Lhal, allhough performance of these Lasks would not appear Lo require explicil categorization of the stimuli used, calegorizalion nevertheless seems lo inLJuence per-formance. Beller underslanding of Lhe faclors which may influence color calegoriza--tion should lead to a deeper understanding of color CP. 1his, in turn, has a bearing on
w 0 w ~ ~ -§ ~ w ~ ~ ~ ~ C
.s
c
w ~theories of linguistic relativity (e.g. \Vhorf 1956), which suggest that differences in
language lead Lo differences in Lhoughl and perception.
2. .Experi1nents la, band c
Participants in the three experiments reported here were native Turkish speakers. The
experiments were 2-alternative-forced-choice tasks (2-APC). In such experiments participants are required Lo decide which of two descriptors, such as 'green' or 'blue:
most accurately describes a given stimulus. To manipulale stimulus range, each
ex-periment used Lwo conditions. Some stimuli were pre sen Lin botb conditions, others in only one or other of the conditions.
The three experiments difl:i:.'.red primarily in the region of color space from which slimuli were drawn. Stimuli in Experiments la and b came from the region of color
space named 'mavi' and 'yesil' by 'lUrkish speakers. 'l.hese correspond lo .English terms
'green' and 'blue' (Ozgen & Davies, 1998). Stimuli in experiment 1c came from regions
of color space named
'mavi'
and'mor',
corresponding to English term 'purple' (Ozgen& Davies 1998). For Lhe sake of clarily, English color Lerms will be used when referring
lo stimuli used in the experimenls.
2.1 Participants
There were a Lo Lal of 131 participanls diviJed almost equally among Lhe lhree experi--menls. All had normal color vision, tested using pseudoisochrornatic plates ([shihara 2003). Table l gives details of the participant who took partin each of the experiments.
~
-~ 2.2 Experiment la: Apparatus, stimuli and design
•
The experiment was run using a personal computer and a sb::teen inch LG 710S CRT monitor. Display was controlled using a GeForce 6200 LE graphics controller. Colori-melric measuremenls were made using a Cambridge Research Systems colorCAL.
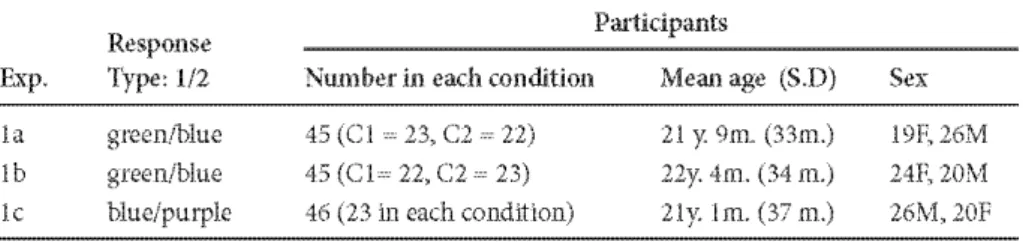
Table 1. Response categories and patticipant details for experiments la, band c. (Abbreviated column headings: Exp.= Experiment)
E~p. la lb le Response Type, 1/2 green/blue greeniblue blueipurplc
~umber in each condition 45(Ct,.23,C2···22) 45 (Cl•• 22, C:2 ·,, 23) 46 (23 in each condit'ton) Participants Mean age (S.l)) 21 JC 9m. (33m.) 22y. 4m. (34 m.) 2ly. Im. (37 m.) Sex 19F, 26M 241', 20'vl 26'vl, 201'
EBSCO eBook Academic Collection (EBSCOhost) - printed on 3/7/2019 5:44 AM via BILKENT UNIVERSITY AN: 398640; Biggam, C. P .. ; New Directions in Colour Studies
w 0
Conversions behveen CLE and lvfonsell color spaces were made using tables provided by Wyszecki and Styles (1982).
Stimuli were nine Munsell defined colors varying only in hue. Hues ranged from 7.SG lo 7..SB in sleps of 2.5 hue units and spanned Lhe green---blue region of color space. Stimuli were of value 7 and chroma 8. Stimulus 7.SG was the greenest-appearing stimuli, 7.SB the bluest Previous research has indicated that 7.SBG marks the
bound-ary between blue and green categories (Bornstein & Korda 1984). Stimuli were pre
senled as 36 mm squares in the center of the display corresponding to a visual angle of ,1.1 ° from the viewing distance of 500 mm. Stimuli were shown singly against a gray background of identical luminance. following the experiment the colorimetric prop-erties of slimuli were rechecked. These measurements confirmed stimuli propprop-erties had remained stable.
2.2.1
Experiment la: Procedure
There were two conditions: 1 and 2. Each condition used seven stimuli. In condition 1
the slimuli were 7.5G, JOG, 2.SBG (1), 5BG (2), 7.SBG (3), JOBG (4) and 25B (5). In
condition 2 slimuli were 2.5BG (1), 5BG (2), 7.5BG (3), IOBG (4), 2.5B (5), SB and
7.SR ~umbers in parentheses indicate labeling of stimuli in Tables 2 and 3. The five italicized stimuli ·were common to both conditions. Thus, in addition to the five
stim-uli common lo both conditions, participanls in condition 1 calegorized two extra
greener stimuli, lhose in condition 2 calegori1.ed two extra bluer stimuli.
Stimuli were presented for categorization singly and in a random order seven times each, making a total of forty-nine trials. Participants were instructed to catego-rize the stimuli as either 'green:' (type 1 response), or 'blue' (type 2 response) using the lefr or right mouse buttons. Response keys were counterbalanced across participants. During slimulus presenlalion, two prompts, in size eighleen black font, appeared on the top left and right of display, indicating·which mouse button corresponded to ·which response. Stimuli remained displayed until a response ·was recorded. A two second unfilled interval followed, after which the nexl slimulus was displayed. Participants sat approximately 500 mm from and al right-angles to the display in a small dark room. Participants were inslructed lo perform the task as rapidly and accurately as possible. For each trial, response type (1 or 2) and response time were recorded.
2.3 Experiments lb and le: Apparatus, stimuli, design and procedure
Experiments lb and le diffCred from experiment la only in the stimuli used. In Ex-periment lb, stimuli were of the same hue as those in ExEx-periment la, but of lower value (6) and saluralion (6). ln .E.xperimenl le, slimuli were of Lhe same value anJ
saturation as in Experiment la, hul of different hues: 7.SB, 108, 2.5PR (1), 5PR (2),
7.SPB (3), lOPB (4), 2.SP (5), SP and 7.5P. Numbers in parentheses indicate labeling of stimuli in Tables 2 and 3. The five ittlicized stimuli ·were common to both conditions.
w 0
present in condition 2 only. Previous research suggests that the boundary between
blue and purple calegories lies around 7.5PB (Franklin & Davies 2004) or 1.0PB
(Rob--erson, Davidoff & Rraisby 1999).
In Experiment lb, the forced choice response categories were the same as those used in Experiment la. In Experiment le, the response categories were 'blue' (type 1)
and 'purple' (type 2), as shown in Table 1.
2.4 Resulls of experimenls 1 a, 1 band le
No participants reported being unable lo categorize stimuli using lhe calegories provided.
The analyses below are confined to data produced by the five stimuli that occurred
in both conditions within each experiment, labeled 1 to 5 in
Tables
2 and 3. Stimulus3 represents the centrally located stimulus within the entire stimulus range used in each experiment. ln Experiments 1aand lh, this is the stimulus with hue of7..SRC;_; in Experirnenl le, the corresponding slimulus hue is 7.SPB.
'fable 2. Proporlion type 2 responses made in .Experimenls la, band c for slimuli 1 io 5.
For each experiment, the average proportion of type 2 responses made by partlcipants ln
condltions 1 and 2 ls shown, as is the comhlned responses ofpartldpants across hoth
conditions. TI1e lowest three rows glve data combined across all experlments, for
condl-tions l and 2 separately (corresponding to Figure l) and, in the bottom row, combined
across all experiments and condltions. Standard deviatlons are ln parentheses. (Abbrevi-ated column headlngs: Exp.= experlment, Cond. = condition, Comh. = combined.)
Stimulus
Exp. Cond. 2 3 4 5 All
a 0.03 (0.09) 0.29 (Cl.31) 0.84 (0.18) 0.97 (0.12) 0.97 (0.10) 0.62 (0.43) 2 0.02 (0.06) 0.02 (0.09) 0.30 (0.36) 0.83 (0.21) 0.99 (0.03) 0.43 (0.46) Comb. 0.02 (0.08) 0.15 (0.26) 0.57 (0.40) 0.90 (0.23) 0.98 (0.07) 0.53 (0.45) b 0.02 (0.05) 0.42 (0.34) 0.85 (0.19) 0.99 (0.04) 1.00 (0.00) 0.65 (0.42) 2 0.02 (0.06) 0.06 (0.13) 0.20 (0.32) 0.79 (0.32) 0.96 (0.07) 0.42 (0.44) Comb. 0.02 (0.05) 0.23 (0.31) 0.56 (0.39) 0.89 (0.25) 0.98 (0.06) 0.54 (0.45) C 0.00 (0.03) 0.06 (0.13) 0.60 (0.30) 0.94 (0.13) 0.98 (Cl.OS) 0.42 (0.45) 2 0.02 (0.05) 0.04 (0.06) 0.27 (0.34) 0.81 (0.34) 0.97 (0.09) 0.54 (0.47) Comb. 0.0 I (0.04) Cl.OS (0.10) 0.48 (0.42) 0.87 (0.27) 0.98 (Cl.OS) 0.48 (0.46)
All 0.02 (0.07) 0.26 (0.31) 0.80 (0.26) 0.96 (0.11) 0.98 (0.07) 0.60 (0.45)
2 0.02 (<l.05) 0.04 (0.10) 0.29 (0.33) 0.81 (0.33) 0.98 (0.09) 0.43 (0.45) Comb. 0.02 (0.06) 0.14 (0.25) 0.48 (0.40) 0.89 (0.25) 0.98 (0.07) 0.51 (0.45)
EBSCO eBook Academic Collection (EBSCOhost) - printed on 3/7/2019 5:44 AM via BILKENT UNIVERSITY AN: 398640 ; Biggam, C. P .. ; New Directions in Colour Studies
w 0
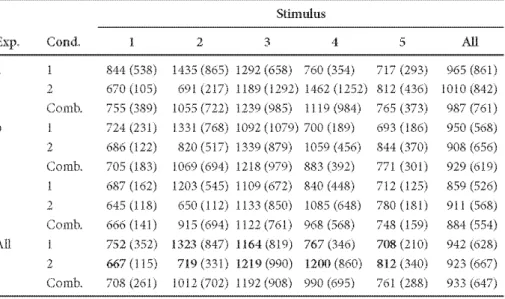
Table 3. Response times (in mllliseconds) made in Experiments la, hand c forstimull 1
to S. For each experiment, average participant response tlmes ln condltions 1 and 2 are
shown separately, as are combined response times across both conditions. The lo1vest three rows glve data combined across all experlments, for condltions 1 and 2 separately ( corresponding to figure 2) and, in the bottom row, combined across all experiments and con<lilions. SlanJard deviations are in parenlheses. (Abbreviated column headings: Exp.
=
experiment, Cond.=
condition, Comb.= combined)Stimulus
Exp, Cofl(t 2 3 4
s
Alla 844 (538) 1435 (865) 1292 (658) 760 (354) 717 (293) 965 (861) 2 670 (105) 60] (217) 1189 (1202) 1462 (1252) 812 (436) 1010 (842) Comb. 755 (389) 1055 (722) 1239 (985) 1119 (984) 765 (373) 987 (761) b 724 (231) l 33] (768) 1092 (1070) 700 (]80) 693(186) 950 (568) 2 686 (122) 820 (517) 1339 (879) 1059 (456) 844 (370) 908 (656) Comb. 705 (183) ]060(694) 1218 (070) 883 (302) 771 (301) 929 (619) C 687 (162) 1203 (545) 1109(672) 840 (448) 712 (125) 859 (526) 2 645 (l 18) 650(112) 1133(850) 1085 (648) 780(181) 911 (568) Comb. 666(141) 915 (694) 1122 (761) 968 (568) 748 (159) 884 (554) All 752 (352) 1323 (847) 1164 (819) 767 (346) 708 (210) 942 (628) 2 667 (1 1 5) 719 (331) 1219 (990) 1200 (860) 812 (340) 923 (667) Comb. 708 (261) ]012(702) 1192(008) 990 (605) 761 (288) 933 (647)
For each parlicipanl, for each stimulus, lhe proporlion of type 2 responses ('blue' for .E.xperimenls la and b, 'purple' for Experimenl le) was calculated. Dala generated were combined across participants within each experimental condition as shm,vn in Table 2. Similarly, for each participant, median response times to each stimulus were calculated and then combined across participants within each experimental condition, as shown in Table 3. Figure 1 shows, combined across experiments, the mean number of type 2 responses made in separate conditions. Figure 2 gives corresponding data for response times. Examination of these figures suggests that, overall, there are different patterns of performance beti-veen conditions.
Data for categorical response limes and categorical responses were analyzed
sepa-rately in 2 (Condilion: 1, 2) X 3 (Experiment: la, lb, le) X 5 (Slimulus: 1, 2, 3, 4, 5)
mixed ANOVAs. Bonforroni corrected t-tests ·were used for subsequent comparisons. The analyses below report only significant main efl:i:.'.cts and interactions.
w 0
c
0 ~~ " ~ ~ C E a 3 .;; rn C TI ·" w ~ u " 0 · " TI ~ 0 ~ u 0 ~ ~ ~ C W ·" ~ iii~ ·2 g ~ ~ C ~~]
~ w 0 " N W N5.
o.s
i""
0 0 Eg_
0 C: ..,....
.---
~!//,/
.t/
I
/ / ~. /
-,,·
0 - - ~ ~ - - - ~ - - - - ~ - - - - ~ - - - ~ 2 3 Stimuli 4s
: ---+-Condition 1 11 Condition 2Figure 1. Combined data from cxpcrimcnl la, band c showing proporlion of lypc 2
{'blue' in experiments 1 a and b, 'purple' in e:x1xTiment 1 c) responses { ±1 S . .E.) in concli-iions l and 2. Data correspond lo lhe numbers in bold in Table 2
1 5 0 0 - - - ~ •o; v 0 0 V
~
.s
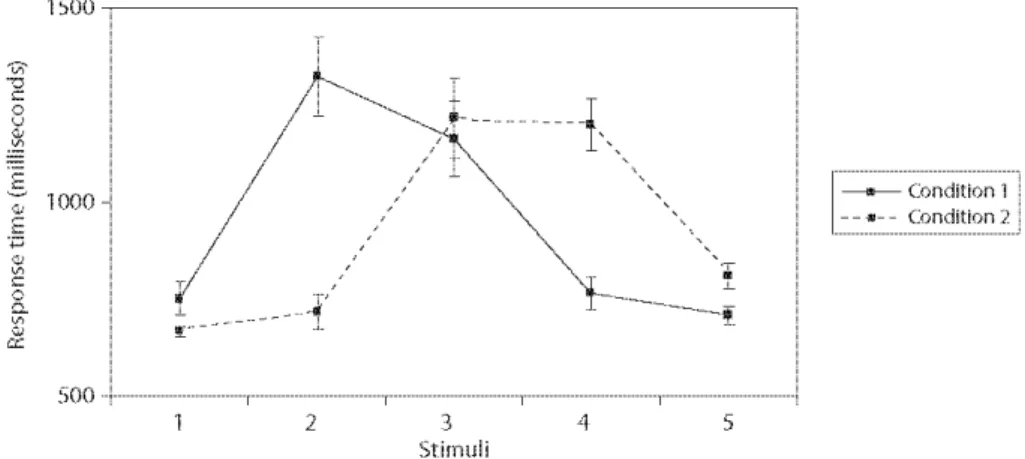
0 1000 E ·;c; ~ 0 0 [;, 0 ~ 5()() ·-: ---T ---T ---1 ---T--2 3 Stimuli 5 --- Condition 1 - Condition 2Figure 2. Combined data from Experiment la, band c shcr<,ving mean response limes (±l S.£.) in conditions 1 and 2. Data correspond to the numbers in bold in Table 3
3. Categorical responses
3.1 Nlain effects
All the main effi.:cts were significant. A main effect of condition, F ( 1, 130)
=
84.49,MS.E
=
262.83,p
< 0.001, indicates participants in condition 2 gave significantly fewertype 2 responses than participants in condition 1. The main effect of experimenl,
EBSCO eBook Academic Collection (EBSCOhost) - printed on 3/7/2019 5:44 AM via BILKENT UNIVERSITY AN: 398640 ; Biggam, C. P .. ; New Directions in Colour Studies
w 0
I' (2,130) - 3.73, 1v1SE - 11.59,
p
< ODS, indicates participants in Experiment le gavefewer Lype 2 responses than parlicipanls in Experiments la or lb, min. t (89) - 3.21,
max" p < O"OS" The main effect of slimulus, F ( 4, S20) ~ 717AS, MSE ~ 1222]8, p< (HJ01, in<licales signiftcanlly different response pallerns belween all stimuli pairs, min.
t
(135)=
3.74, max.p
< 0.01, ·with stimulus 2 receiving more type 2 responses thanstimulus 1, stimulus 3 receiving more type 2 responses than stimulus 2, and so on.
3.2 Condition by slimulus interaclion.
A significant two-way interaction was found between condition and stimulus, F ( 4, 520)
=
42.16, !v'lSE=
71.85,p
< 0.001. '_[his reflecls differences in responses lo slimuli 2, 3and 4 in different condilions, min. t (1.34)
=
3.86, max.p
< 0.001, with fewer lype 2responses to those stimuli being made by participants in condition 2.
3.3 Experiment by stimulus interaction.
A significant interaction found between experiment and stimulus, F (4,520)
=
2.23,1v1SE - 3.80,
p
< 0.025, appears due to stimulus 2 receivingtype
2 responses lessfre-quently in Experiment le than in either Experiment la or lb, mint (89)
=
LJ,1, max.p
< 0"001"1J. Response times
4.1 IV lain e flecl
There was a significanl main effect
or
slirnulus, F (4, 520) = 17.85, MSE = 5358618,p
< 0.001, with significanl Jifferences in response limes between all slimuli, min.t
(135)=
2.83, max.p
< 0.05, except for the following stimulus pairs: 2 and 3, 2 and 4,and 1 and 5. For the significant diflCrences, response times were always higher for stimuli closer to the center of the overall range used in the experiments, that is closer to lhe stimulus numbered 3 in Table 3.
4.2 Condition by slimulus interaclion.
A significant lwo way inleraction between condition and slimulus, F ( 4, 520)
=
16.20,MS.E
=
4861948,p
< 0.001, reflects differences in response to stimuli 2 and 4 indiffer--ent conditions, min.
t
(134)=
4.18, ma-..::.p
<. 0.01. Responses to stimulus 2 ·were slowerin condition 1 (where that stimulus is closer to the center of the stimulus range), with the opposite pallern for stimulus 4.
!i
5. Discussion ~~ rn
~ 5.1 Summary of experiments and results
8
w 0
.Experiments la, band c were forced choice categorization experiments involving color stimuli. Each experiment involved two conditions, with participants in both condi-tions categorizing seven stimuli seven times each. In each experiment five stimuli were common lo both conJilions, the olher lwo were unique Lo each condition.
Comparison of the slimuli common to both conditions in each experiment re-vealed differences lielween condilions in tbe pallerns of calegorizalion, visible in
Figure 1. In Experiment la, for example, participants in condition 1 categorized the
five stimuli common to both conditions as 'blue' more frequently than participants in condilion 2. This difference in performance reflects the influence of the two extra greenish colored stimuli in the stimulus sel named by participants in condition 1.
Response times to individual stimuli also differed depending on condition, as shown in figure 2. In general, responses took longer for stimuli located closer to the cenler of each conJilion's stimulus range.
5.2 Stimulus range and color calegorizalion
Stimulus range influences performance of forced choice color categorization experi-ments oflhe kind described here. The effecls were founJ Lo be broadly similar in three differing regions of color space. Stimulus range inLJuences nol only the frequency with which particular categorical responses are made, but also the time required to produce responses. These influences manifest themselves over the course of only forty-nine lrials. [t seems probable tbat in experiments involving larger numbers of trials, range effects would be larger.
However, there are also significant differences behveen response patterns made in experiments la, b and c. That such diffCrences exist shows, unsurprisingly, that ttsk performance is influenced by factors besides stimulus range.
Tn the introduction, tbree reasons for invesligaling the effects of slimulus range on color categorization were mentioned. One concerned lhe failure of a previous
experi-ment (I\11itterer & de Ruiter 2008) to find such an effect. The second reason relates to
an apparent paradox in the literature on color categorization. \Vhilst some researchers have concluded lhat the divisions belween color categories are dear cut (e.g. Bornstein
& Korda 1984), others (e.g. Berlin & Kay 1969) have drawn different conclusions. Fi nal ly, il was suggested lhat understanding the influences of range on color categoriza--tion can help us understand more about color CP.
There are several potential explanations for the differences between the results of Millerer anJ de Ruiler's (2008) sludy and this one. As is mentioned above, differences in performance between the three experiments described here suggest that faclors he-sides stimulus range influence categorization. Mitterer and de Ruiter (2008) used a
EBSCO eBook Academic Collection (EBSCOhost) - printed on 3/7/2019 5:44 AM via BILKENT UNIVERSITY AN: 398640 ; Biggam, C. P .. ; New Directions in Colour Studies
w 0
wider range of stimuli. 1heir stimulus range also included more prototypical stimuli
-- LhaL is, stimuli consiJereJ Lo lie tbe best examples of Lhe calegories lhey represented.
These factors may be sufficient lo eliminate the effecls of stimulus range on
categoriza-tion. Furlher experimenls coulJ <lelermine Lhe issue. However tbe resulls reported here confirm that psychological judgments about color arc, like many other kinds of
psychological judgments, influenced by stimulus range.
[nfluences of slimulus range can also help explain disagreemenls over lhe catego
rization of regions of color space away from category cenlers. 'lhe results of experi--rnents described here seem to show that, in a 2-AFC task, changing the location of stimuli within a range can influence the consistency with which they are categorized.
Tf <luring a force<l--choice--calegorizalion ex.perimenl, the suspecle<l localion of a
category boundary is located at the center of the stimulus range, then range effects are likely lo influence the resulls. Jn particular, iflhe boundary stimulus is Lhe one al the center of the stimulus range, then it is likely that range effects ·will enhance the appar-ent sharpness of a category boundary. Alternatively, range efli:.'.cts might also lead to a particular slimulus being categorized less consistently than olhers, and hence idenli fted as Lhe stimulus closest to the boundary. Using a different range, a differenl stimu--lus may likewise be identified as that closest to the boundary. Thus a stimustimu--lus identi-fied as being closest to a boundary may only be identiidenti-fied as such in virtue of the conlexl in which il is presented. Range effects may also mask individual differences in color categorization.
Consequenlly, <lisagreemenls over Lhe calegorizalion of colors localed away from category centers may be partially explicable in terms of differences in the range of stimuli used by different researchers, as ·well as differences in experimental techniques (especially multiple versus single lrials involving individual stimuli) which influence participant assessment of stimulus range.
Finally, studies of color CP often include a 2-AFC categorization task prior to a
main task assessing CP (e.g. Gilbert et al. 2006; Roberson & Davidoff2000), using a
stimulus range that straddles the suspected category boundary. Some potential conse-quences of this procedure have just heen mentioned. Jn lhe experimental phase, some-thing similar happens, wilh parlicipanls being ex.posed Lo equal numbers of slimuli belonging to each of the previously established categories,
It;
as is claimed (Gilbert et aL 2006; Roberson & Davidoff2000), CP is underpinnedby active classification of stimuli, then in research using this methodology, the slrength of CP might be enhanced by range effecls --- because slimuli either side of the center of the range are categorized less ambiguously than if they are located at the center of the stimulus range.
On the other hand, time ttken to categorize stimuli increases as stimuli are located closer to lhe cenler of the range. Tf CP is underpinned hy classification of stimuli then range effects mighl be expecle<l Lo reduce the effecl of CP in silualions where Lhe cal--egory boundary is located at the center of the stimuh1 s range and the experimenttl measure is the speed of discrimination. 1he reason is as follows. A CP eflCct is found
w 0
c
0 ~~ " ~ ~ C E a 3 .;; rn C TI ·" w ~ u " 0 · " TI ~ 0 ~ u 0 ~ ~ ~ C W ·" ~ iii~ ·2 g ~ ~ C ~~]
~ w 0 " - wwhen discriminations behveen stimulus pairs belonging to difh.'.rent categories are
made more reliably and/or fasler than discriminations made lielween pairs lie longing
lo the same calegory. Rut
if
stimuli comprising the across--category trials are drawnfrom close to the center of the stimulus range, as is usually the case, categorizing these
stimuli should take longer than
if
they were located tm,vards the ends of the stimulusrange. Conversely wilhin--calegory stimulus pairs are usually drawn from the ends of
the stimulus range, localions where categorization is fasler.
TO investigate, experiments assessing CP could be carried out involving two
con-ditions, one in which the suspected category boundary is located at the center of the stimulus range used, another in which the boundary is located away from the center of Lhe stimulus range. Comparison of Lhe results in each con<lilion would aiJ assessmenl of Lhe influence of range effects on color CP. This in turn can further understanding of the mechanisms driving CP.
References
Berlin, Brent & Paul Kay; 1969. Basic Color Terms: Their universality and evolution. Berkeley: l7niversity of California Press.
Bornstein, ~t H. & N. Korda. 1984. "Discrimination and matching wilhin and bet\veen hues measured by reaclion times: Some implicalions for categorical perception and levels of in--formation processing''. P~t1d1ological Re5earch 46.207 -- 222.
Boynton, R. ~t &
J.
Gordo11 1965. "Bezold--Bri.icke hue shift measured by color-naming lech--nique''. Journal of the Optical Society lfArnerica 55.78---86.Crawford L E., J. Huttenlocker & P. H. Engebretson. 2000. "Category effects on perceplion of stimuli: Perception or reconstruction''. Psychological Science 11.280-- 28°1.
Drivonikou, G. \~, P. Kay, T. Regier, R. B. Ivry, AL. Gilberl, A. Franklin & LR. L Davies. 2007.
"Fmiher evidence for laleralization of VVhorfian effects lo the right visual field''. Proceedings cf tl1e National Academy of Sciences 104.1097 --1102.
Franklin, A. & I. R. L Davies. 2004. "New evidence li:.lr infant color categories''. British Journal of Developrnental Psychology 22.349-- 377.
Gilbert, Aubrey L., Terry Regier, Paul Kay & Richard B. Ivry. 2006. "Whorf h,1•otl1esis is sup--ported in the righl visual lield but not the left': Proceedings cf the 1"\'ational Academy of Sciences 103.489-494.
llo[l'tngvmrth, l l. L 1910. '''[he central tendency of Judgment''. 1he]ournal of Philosophy, P.~-chology and Scinitttic Afet!wds 7.461-469.
lshlhara, S. 200.1. Test.fi1r Colour-Dlindness. Tokyo: Shuppan.
r,..falkoc, C~., P. Kay & M.A. Webster. 2005. ''Variat'ton in Normal Color Vision l V: Un'tque-b'tna-ry hues and hue scallng''. Journal of the C Jptical Society of Amrrica A. 22: 10.2154-2168. Mltterer, I l. & I. P. de Ru'tter. 2008. "Recalihratlng color categor'tes uslng vmrld knmvledge''.
P.~-chological Science 19.629-6.14.
Kay, P. & C. '.vlc Danlel. 1978. '''[ he Hnguistic sign'tficance of the meanlngs of has'tc color terms''. J.anguage 54.6 l 0-646.
EBSCO eBook Academic Collection (EBSCOhost) - printed on 3/7/2019 5:44 AM via BILKENT UNIVERSITY AN: 398640 ; Biggam, C. P .. ; New Directions in Colour Studies
w 0
c
0 ~~ " ~ ~ C E a 3 .;; rn C TI ·" w ~ u " 0 · " TI ~ 0 ~ u 0 ~ ~ ~ C W ·" ~ iii~ ·2 g ~ ~ C ~~]
~ w 0 " - wOzgen, E. & I. R L Davies. 1998. "Turkish color terms: Tests of Berlin and Kay's theory of color
universals and linguistic relativity''. Linguistics 36. 919--9 56.
Parducci, A. 1965. "Category judgement: A range frequency model''. Psychological Review 72.4.07---4.18.
Petzold, P. 1982. "The edge effect of discrimi.nability in categorical judgements''. Journal of Ex-perimental Psychology: Human Perception and PerjOrrnance 7.1371---1385.
--- & G. Haubensak. 2004.. "The influence of calegory membership of stimuli on sequential ctfccts in magnitude _judgment''. Perception & Psychophysics 66.665-678.
Poulton, E. C. l 973. "l;nwantcd range effects from using 1v'tth 'tn-subjccts experimental dcs'tgns''. Pyschological Bulletin 80. l l 3- l 2 l.
- - . l 07 4. "Range effects arc charactcrlst'tc of a person scrvlng in a within-subjects cxpcr'tmcn-tal design - A reply to Rothstc'tn''. Psychological Bulletin 81.20 l-203.
- - . l 080. Bias in Quantifying Judgments. Hove: Er[baum.
Roberson, D., I. Davidoff & -:S. Brais by. l 000. "Simllarity and catcgor'tsation: Ncuropsychologlcal cvldcncc for a dlssoclation ln exp Heit catcgorisat'ton tasks''. Cognition 7 l .1-42.
- - & I. Davidoff. 2000. "The categorical pcrccptlon of colours and facial cxprcss'tons: The ctfoct of verbal interference''. }demory 6 Cognition 28.077-986.
Rosch Hc'tdcr, E. l 072. "Universals in color naming and memory''. _Journal of Experimental Psy-chology 93. l 0-20.
\Vatson, W. A. l 057. "Contrast, assimilatlon, and the effect of central tendency''. American _Jour-nal of Psychology 70.560-568.
\Vhorf, B. L. 1056. Language, Thought and Reality: Essays by B. L. \Vhorf ed. by
J.
B. Caroll Cambr'tdgc, JV!ass.: JV! [T Press.\Vyszccki, G. &