EFFECTS OF PI3K/AKT/mTOR AND VEGFR PATHWAY INHIBITORS ON LIVER CANCER STEM CELLS
AND
BIOACTIVITIES OF NOVEL PYRAZOLIC CHALCONE DERIVATIVES ON LIVER CANCER
A DISSERTATION SUBMITTED TO
THE GRADUATE SCHOOL OF ENGINEERING AND SCIENCE OF BILKENT UNIVERSITY
IN PARTIAL FULFILLMENT OF THE REQUIREMENTS FOR THE DEGREE OF
DOCTOR OF PHILOSOPHY IN
MOLECULAR BIOLOGY AND GENETICS
By
Deniz Cansen Kahraman December 2017
i
EFFECTS OF PI3K/AKT/mTOR AND VEGFR PATHWAY INHIBITORS ON LIVER CANCER STEM CELLS AND
BIOACTIVITIES OF NOVEL PYRAZOLIC CHALCONE DERIVATIVES ON LIVER CANCER
By Deniz Cansen Kahraman December 2017
We certify that we have read this dissertation and that in our opinion it is fully adequate, in scope and in quality, as a thesis for the degree of Doctor of Philosophy.
________________________ Işık Yuluğ (Advisor) ________________________ Rengül Atalay (Co-advisor) ________________________ Özgür Şahin ________________________ Ayşegül Üner ________________________ İhsan Gürsel ________________________ Ayşe Elif Erson Bensan
Approved for the Graduate School of Engineering and Science:
__________________ Ezhan Karaşan
ii
ABSTRACT
EFFECTS OF PI3K/AKT/mTOR AND VEGFR PATHWAY
INHIBITORS ON LIVER CANCER STEM CELLS
AND
BIOACTIVITIES OF NOVEL PYRAZOLIC CHALCONE
DERIVATIVES ON LIVER CANCER
Deniz Cansen Kahraman
Ph.D. in Molecular Biology and Genetics Advisor: Işık Yuluğ
Co-advisor: Rengül Atalay December, 2017
Hepatocellular carcinoma (HCC) is one of the leading causes of cancer-related mortality, such that it the second most frequent cause of cancer death worldwide. Due to its heterogeneous composition and aggressive behavior, it is resistant to conventional therapies and also Sorafenib and Regorafenib which are FDA-approved multikinase inhibitors targeting pathways involved in angiogenesis and proliferation. The mechanisms behind the acquired resistance to Sorafenib were described as activation of compensatory pathways such as PI3K/Akt/mTOR, JAK-STAT, epithelial to mesenchymal transition (EMT), microenvironment and presence of cancer stem cells. Liver cancer stem cells originate from damaged and transformed hepatic progenitor cells (HPCs) which are found responsible for chemo-resistance, tumor relapse, and metastasis. For this reason, the effects of PI3K/Akt/mTOR inhibitors, Sorafenib and DNA intercalators on the enrichment of LCSCs were investigated. CD133+/EpCAM+ population from HCC cells were analyzed by flow cytometry after treatment with inhibitors, and effective inhibitors against LCSCs were further tested for their potential combinatorial effects together with Sorafenib. It was shown that upon treatment with Sorafenib or DNA intercalators the LCSCs were enriched, whereas Rapamycin (mTOR inhibitor), LY294002 (PI3K inhibitor) were able to inhibit the enrichment of LCSCs and
iii
reduced the CD133+/EpCAM+ population ratio. Combination studies revealed that when cells are treated initially with Rapamycin and then with Sorafenib, both the LCSC ratio and the sphere formation capacity of cells were reduced compared to cells treated with Sorafenib alone. To understand the alterations in gene expression induced by the inhibitors, a large panel of genes involved in regulation of cancer pathways were analyzed using Nanostring nCounter Technology. Systematic pathway analysis using Cytoscape Score Flow algorithm application allowed us to identify differential response genes involved in stemness. It was shown that genes involved in regulation of stem cells (Wnt and Notch pathway) were downregulated upon treatment with Rapamycin and DAPT (Notch pathway inhibitor), yet Sorafenib treatment resulted in differential regulation of these pathways, where JAG1 gene was found to be up-regulated. Interestingly, IL-8 expression was upregulated dramatically upon treatment with Sorafenib, but downregulated upon DAPT or Rapamycin treatment. Inhibition of IL-8 signaling resulted in reduction in both LCSC ratio and sphere formation capacity of HCC cells, which could be indicating the role of IL-8 signaling in the conservation of stemness features of LCSCs. For this reason, blockade of IL-8 signaling was suggested to be a promising therapeutic approach for HCC.
Another topic in this thesis focuses on the potential of VEGFR2 TKIs and quinoids to inhibit both liver cancer cells and liver cancer stem cells. VEGFR TKIs such as Sorafenib, are widely studied for the treatment of many cancers, yet as mentioned above, there are many clinical studies providing the evidence that anti-VEGF or anti-VEGFR therapies lead to stable disease, which is then followed by disease progression in different cancer types. In recent years it has also been shown that antiangiogenic agents are increasing cancer stem cell population via generation of tumor hypoxia. Quinoids, on the other hand, are compounds that are selectively active in hypoxic conditions. Thus, the main aim of this study was to evaluate the bioactivities of compounds from each group on liver cancer cells and also to analyze their effects on the enrichment of LCSCs. Our results have shown that VEGFR2 TKIs were cytotoxic at lower concentrations compared to quinoids. However, it was shown that VEGFR2 TKIs are more likely to enrich LCSC population
iv
whereas some of the quinoids were able to reduce this ratio. With this information, a new concept called “aggressiveness factor”, which defines the potential of a compound to cause more aggressive cancer, was introduced.
In the last part of this thesis, bioactivities of pyrazolic chalcone derivatives on HCC cell lines and their mechanism of action were investigated. Chalcones and pyrazolic structures are well known for their anti-cancer activities. Newly synthesized pyrazolic chalcone derivatives were tested against different cancer cells, and selection based on the IC50
values of compounds was made to analyze their effect on a panel of HCC cells. Results have shown that, compounds 39, 42, 49 and 52 were the most effective derivatives which had anti-proliferative activities in less than 5 µM concentrations. Further investigation of cell cycle progression and cell death mechanisms have revealed that compounds 42 and
52 caused cell cycle arrest at the G2/M phase and induced apoptotic cell death. Also,
levels of cell cycle proteins, p21, CDK1, and phospho-CyclinB1 were shown to decrease upon treatment with these compounds.
Keywords: Hepatocellular carcinoma, PI3K/Akt/mTOR, pathway, Sorafenib, liver cancer
stem cells, drug resistance, VEGFR-TKI, quinoids, pyrazolic chalcone derivatives, bioactivity, cell cycle, apoptosis
v ÖZET
PI3K/AKT/mTOR VE VEGFR SİNYAL YOLAKLARI
İNHİBITÖRLERİN KARACİĞER KANSERİ KÖK HÜCRELERİ
ÜZERİNDEKİ ETKİLERİ
VE
PİRAZOLİK KALKON TÜREVLERİNİN KARACİĞER KANSERİ
ÜZERİNDEKİ BİYOAKTİVİTELERİ
Deniz Cansen Kahraman
Moleküler Biyoloji ve Genetik Bölümü, Doktora Tez Danışmanı: Işık Yuluğ
Tez Eş-danışmanı: Rengül Atalay Aralık, 2017
Hepatoselüler karsinom (HSK) kansere bağlı ölüm nedenlerinde en ön sıralarda yer almaktadır. Dünyada meydana gelen kanser ölümleri arasında ikinci sırada yer almaktadır. Heterojen yapısı ve agresif davranışı sebebiyle, kemoterapötik ilaçlara ve FDA onaylı, çoğalma ve anjiyojenez yolaklarını hedef alan, multikinaz inhibitörü Sorafenib ve Regorafinibe karşı dirençlidir. Sorafenibe karşı gelişen direncin arkasında yer alan mekanizmalar, PI3K/Akt/Mtor, JAK/STAT gibi dengeleyici yolakların aktivasyonu, epitelyal mesenkimal geçiş (EMG), mikroçevre ve kanser kök hücrelerinin varlığı olarak açıklanmaktadır. Karaciğer kanser kök hücreleri (KKKH) hasara uğramış ve değişime uğramış hepatik öncü hücrelerden meydana gelmişlerdir ve bu hücreler kemoterapi direnci, tümörün nüksetmesi ve metastazı gibi olaylardan sorumludurlar. Bu sebeple, PI3K/Akt/mTOR yolağı inhibitörleri, Sorafenib ve DNA interkalatörlerinin KKKH üzerindeki etkileri incelenmiştir. Bu inhibitörler ile muamele edilmiş HSK hücre hatlarındaki CD133+/EpCAM+ popülasyonu akış sitometrisi ile analiz edilmiş, KKKH’lere karşı etkili olabilen inhibitörler Sorafenib ile kombinasyon deneylerindeki potansiyelleri belirlenmek üzere test edilmiştir. Sonuçlar göstermiştir ki, Sorafenib veya DNA interkalatörleri ile muamele edilen hücrelerde KKKH’leri zenginleşirken,
vi
Rapamisin (mTOR inhibitörü), LY294002 (PI3K inhibitörü) CD133+/EpCAM+ popülasyonu oranını düşürüp KKKH zenginleşmesine engel olmuştur. Kombinasyon çalışmaları ile hücrelerin öncelikle Rapamisin ile daha sonra ise Sorafenib ile muamele edilmeleri ile , hem KKKH oranının hem de küre oluşturma kapasitlerinin yalnızca Sorafenib ile muamele edilen hücrelere göre azaldığı gösterilmiştir. İnhibitörlerin hücrelerdeki gen ifade seviyelerinde sebep oldukları değişimleri anlamak için, Nanostring nCounter teknolojisinden faydalanarak, kanser yolaklarını regüle eden genlerin analizi yapılmıştır. Cytoscape Score Flow algoritması uygulaması ile gerçekleştirilen sistemik yolak analizi, kök hücreleşme ile ilgili genlerdeki ifade farklılıklarının belirlenmesine yardımcı olmuştur. Rapamisin veya DAPT (Notch yolağı inhibitörü) ile muamele sonrası kök hücrelerin regülasyonunda yer alan genlerin (Wnt ve Notch yolakları) ifadelerinin azaldığı gösterilmiş, fakat Sorafenib ile muamele sonucunda bu yolaklardaki genlerin ifadelerinde farklılıklar (örn. JAG1 geninde artış) gözlemlenmiştir. İlginç bir şekilde, IL-8 ifadesi Sorafenib ile muamele sonucu artış göstermiş, fakat DAPT veya Rapamisin ile muamele sonucu düşüş göstermiştir. IL-8 yolağının inhibe edilmesi, hem KKKH oranında hem de HSK hücrelerinin sfer oluşturma kapasitelerinde azalmaya sebep olmuştur. Bu da IL-8 yolağının KKKH’ların kök hücre özelliklerini koruyucu bir rölü olduğunu işaret ediyor olabilir. Bu sebeple, IL-8 sinyal yolağının bloke edilmesinin HSK terapisi için umut verici bir yaklaşım olduğu belirtilmiştir.
Bu tezde ayrıca, VEGFR2 tirozin kinaz (TK) inhibitörlerinin ve quinoidlerin karaciğer kanseri hücreleri ile beraber KKKH’lerini de inhibe edebilme potansiyelleri ile ilgili çalışmalara odaklanılmıştır. Sorafenib gibi diger VEGFR TK inhibitörleri çoğu kanser çeşidinin tedavisi için yaygın olarak çalışılmaktadır. Fakat, daha önce de belirtildiği üzere, klinik çalışmalar anti-VEGF veya anti-VEGFR terapilerinin farklı kanser türlerinde hastalığı stabile edip daha sonra ilerlemesine sebep olduğu bulguları içermektedir. Son yıllarda anti-anjiyojenik ajanların tümörde hipoksi oluşturarak kanser kök hücre popülasyonunu arttırdığı gösterilmiştir. Buna karşılık olarak, quinoidlerin hipoksik ortama duyarlı ve seçici aktif bileşiklerdir. Bu sebeple, bu çalışmadaki temel amacımız, bu iki grup bileşiklerin HSK hücreleri üzerindeki biyoaktivitelerini belirlemek
vii
ve aynı zamanda KKKH’lerinin zenginleşmesi üzerindeki etkilerini analiz etmektir. Sonuçlar göstermiştir ki, VEGFR2 TK inhibitörleri quinoidlere göre çok daha düşük konsantrasyonlarda sitotoksik etkilerini göstermektedir. Buna rağmen, VEGFR2 TK inhibitörlerinin KKKH hücrelerini zenginleştirdiği, quinoidlerin bazılarının ise bu oranı azaltabildiği gösterilmiştir. Bu veriler ile, bir bileşiğin daha agresif bir kansere sebep olma potansiyelini tanımlayan ve “agresiflik faktörü” adı verilen yeni bir kavram ortaya konulmuştur.
Tezin son bölümünde ise pirazolik kalkon türevlerinin HSK hücre hatları üzerindeki biyoaktiviteleri ve etki mekanizmaları araştırılmıştır. Kalkonlar ve pirazolik yapılar anti-kanser özellikleri ile bilinen bileşikleridir. Yeni sentezlenmiş 41 adet pirazolik kalkon türevleri ilk önce farklı kanser hücreleri üzerinde test edilmiş, ve aralarından IC50
değerlerine bağlı olarak seçim yapılarak, bileşiklerin etkileri HSK hücre paneli üzerinde test edilmiştir. Sonuçlar, 39, 42, 49 ve 52 bileşiklerinin 5 µM dan küçük konsantrasyonlarda anti-proliferatif etkilerini göstermesi ile en etkili türevler olduğunu göstermiştir. Hücre döngüsü ve hücre ölümü mekanizmalarının araştırılması ile 42 ve 52 bileşiklerinin G2/M fazında areste ve apoptotik hücre ölümüne sebep olduğu ortaya çıkmıştır. Buna ek olarak, bileşikler iler muamele sonucunda p21, CDK1 ve fosforile-CyclinB1 gibi hücre döngüsünde yer alan proteinlerin seviyelerinin azaldığı gösterilmiştir.
Anahtar Kelimeler: Hepatoselüler karsinom, PI3K/Akt/mTOR sinyal yolağı, Sorafenib,
karaciğer kanseri kök hücresi, ilaç direnci, VEGFR2 TK inhibitörleri, quinoid, pirazolik kalkon türevleri, biyoaktivite, hücre döngüsü, apoptoz
viii
ix
Acknowledgements
First and foremost, I would like to express my gratitude to my supervisor Prof. Dr. Rengül Çetin-Atalay, for her guidance, support, trust, patience, motivation, and enthusiasm. She has been a great mentor. It was a privilege to be involved in her lab as a Ph.D. student and learn the basis of becoming a good scientist.
I would like to thank my advisor Assoc. Prof. Işık Yuluğ, for sharing her experience and knowledge, and for her patience and enthusiasm throughout the years I spent in Bilkent as an undergrad and grad student.
I would also like to thank my thesis committee members; Assist. Prof. Dr. Özgür Şahin, and Prof. Dr. Ayşegül Üner for sharing their experience and academic knowledge which guided me throughout my thesis. Moreover, I am thankful to Prof. Dr. İhsan Gürsel and Assoc. Prof. Dr. A. Elif Erson Bensan for accepting to become my thesis jury members.
I would like to thank Prof. Sultan Baytaş for her support in our collaborative projects. I am thankful to my past and present MBG and KanSil group members; İrem, Ece, Sezen, Damla, Esra, Tuğçe, Gözde, Begüm, Dilan, Nilüfer, Şahika, Merve Deniz, Gülşah, Dilek, Verda and Merve Mutlu, for their great friendship and support not only in the lab but also in life outside the lab. Many thanks to all MBG family members for their friendship, great working atmosphere, and technical support.
Finally, I would like to express my deepest gratitude to my parents, Nevin, Faruk and to my brother, Tayfun, for their moral support, and patience throughout this long journey. I would like to thank my dear husband and colleague Tamer for his endless support, patience and his help in my Ph.D. work. Without them, these achievements would be impossible to accomplish.
x
Contents
Chapter 1. Introduction ... 1
1.1. Hepatocellular carcinoma ... 1
1.2. Tumor heterogeneity and Cancer stem cells ... 3
1.2.1. Identification of cancer stem cells ... 4
1.2.2. Liver cancer stem cells ... 5
1.2.2.1. LCSCs for the clinical management of liver cancer ... 8
1.3. Sorafenib resistance ... 11
1.3.1. Primary Sorafenib resistance ... 12
1.3.2. Acquired Sorafenib resistance ... 13
1.3.2.1. PI3K/Akt/mTOR pathway and Sorafenib resistance ... 13
1.3.2.2. JAK-STAT pathway and Sorafenib resistance ... 13
1.3.2.3. Epithelial-mesenchymal transition and Sorafenib resistance ... 14
1.3.2.4. Hypoxic microenvironment and Sorafenib resistance ... 15
1.3.2.5. Liver cancer stem cells and Sorafenib resistance ... 16
1.4. Quinones and cancer therapy ... 17
1.5. Pyrazolic chalcone derivatives as potential anti-cancer drugs ... 18
Chapter 2. Objectives and Rationale ... 21
Chapter 3. Materials and Methods ... 24
3.1. Materials ... 24
3.1.1. Cell culture reagents ... 24
xi
3.1.3. Sulforhodamine B (SRB) assay and Real-time cell electronic sensing
(RT-CES) reagents ... 26
3.1.4. Flow cytometry and antibodies for fluorescence staining ... 26
3.1.5. Magnetic cell sorting reagents and materials ... 27
3.1.6. Nanostring nCounter reagents and instruments ... 27
3.1.7. RNA extraction, cDNA synthesis, and polymerase chain reaction (PCR) reagents ... 28
3.1.8. Oligonucleotides ... 28
3.1.9. Agarose gel electrophoresis ... 28
3.1.10. Protein gel electrophoresis ... 29
3.1.11. Antibodies for western blot analysis ... 29
3.1.12. Cell cycle analysis with flow cytometry ... 30
3.1.13. Immunofluorescence staining reagents ... 30
3.1.14. General reagents ... 31
3.2. Solutions and Media ... 31
3.2.1. Cell culture solutions ... 31
3.2.2. Preparation of inhibitor stocks ... 32
3.2.3. Sulforhodamine B assay solutions ... 32
3.2.3. Flow cytometry and immunofluorescence solutions ... 32
3.2.4. Western blotting reagents ... 33
3.3. Methods ... 33
3.3.1. Cell culture methods ... 33
3.3.1.1. Growth and sub-culturing of cells ... 34
xii
3.3.1.3. Thawing of frozen cells ... 35
3.3.2. Sulforhodamine B (SRB) assay ... 35
3.3.3. Real-time cell electronic sensing (RT-CES) system... 38
3.3.4. Flow cytometry analysis for detection of liver cancer stem cells ... 39
3.3.5. Magnetic Cell Separation... 40
3.3.6. Sphere formation assay ... 42
3.3.7. RNA extraction and cDNA synthesis ... 43
3.3.8. Expression analysis with Nanostring® nCounter® Technology ... 45
3.3.9. Cellular pathway analysis using “Pathway Scoring Application” ... 48
3.3.10. Primer design for qRT-PCR ... 49
3.3.11. Expression analysis qRT-PCR ... 49
3.3.12. Agarose gel electrophoresis ... 50
3.3.13. Total protein extraction from cancer cells and Bradford assay ... 50
3.3.14. Western Blot Analysis ... 51
3.3.15. Immunofluorescence for detection of cell death... 52
3.3.16. Cell cycle analysis with flow cytometry ... 52
Chapter 4. Results ... 54
4.1. PART-I: Analysis of PI3K/Akt/mTOR pathway inhibitors on liver cancer stem cells ... 54
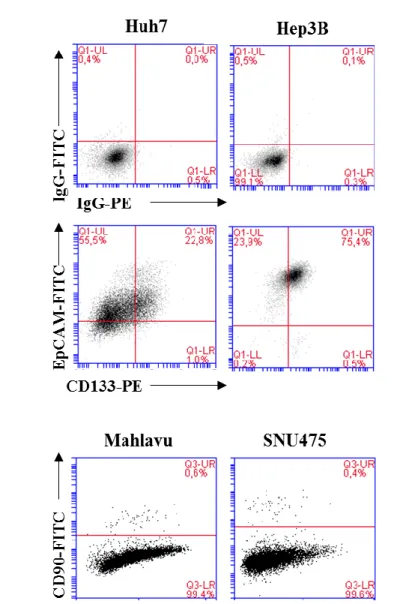
4.1.1. Expression of LCSC markers in HCC cell lines ... 56
4.1.2. Characterization and Isolation of LCSCs in Huh7 and Hep3B cell lines ... 57
4.1.2.1. Sphere formation capacity of isolated LCSCs ... 58
xiii
4.1.3. Anti-cancer activities of PI3K/Akt/mTOR pathway inhibitors, Sorafenib and
DNA intercalators on HCC cell lines ... 60
4.1.4. Differential effects of small molecule inhibitors and DNA intercalators on
LCSCs ... 61
4.1.5. Combinatorial treatment of most potent PI3K/Akt signaling pathway
inhibitors together with Sorafenib ... 67
4.1.5.1. Flow cytometry of cells treated following sequential treatment strategies
... 67
4.1.5.2. Sphere formation analysis of cells treated with Rapamycin, Sorafenib,
their combinations and DAPT ... 70
4.1.6. Large scale gene expression analysis of Huh7 cells treated with Rapamycin,
Sorafenib, their combinations or DAPT ... 72
4.1.6.1. Identification of differentially expressed genes in each treatment group 73 4.1.6.2. Execution of “pathway scoring application” and evaluation of the
activity of signaling pathways involved in cancer ... 79
4.1.7. Effects of IL-8 inhibition on enrichment of LCSCs ... 81 4.1.7.1. Flow cytometry analysis of cells treated with Reparixin only and in
combination with Sorafenib ... 81
4.1.7.2. Sphere formation assay of cells treated with Reparixin only and in
combination with Sorafenib ... 82
4.1.7.3. Western blot analysis of SOX2 and Nanog proteins upon treatment with
Reparixin and in combination with Sorafenib ... 84
4.2. PART-II: Influence of VEGFR2 TKIs and quinones on the fate of HCC and its
cancer stem cells ... 85
4.2.1. Cytotoxic activities of quinoids and VEGFR2 TKIs on HCC cell lines ... 86 4.2.2. Effects of VEGFR2 TKIs on enrichment of LCSCs... 86
xiv
4.2.3. Evaluation of VEGFR2 TKIs and quinones for their ability to inhibit
enrichment of LCSCs... 90
4.3. PART-III: Biological Evaluation of Novel Pyrazolic Chalcone Derivatives as Novel HCC therapeutics ... 92
4.3.1. Cytotoxic activities of pyrazole chalcone derivatives on cancer cells... 92
4.3.2. Real-time cellular response of HCC treated with selected compounds ... 97
4.3.3. Cell death mechanisms induced by pyrazolic chalcone derivatives ... 98
4.3.4. Induction of cell cycle arrest in G2/M phase of HCC cells by pyrazolic chalcone derivatives ... 102
4.3.5. Cellular pathways altered by pyrazolic chalcone derivatives ... 103
Chapter 5. Discussion and Conclusion ... 107
5.1. PART-I ... 107
5.2. PART-II ... 113
5.3. PART-III ... 115
Chapter 6. Future Perspectives ... 117
Bibliography ... 120
Appendix ... 132
xv
List of Figures
Figure 1.1. Inhibition of multiple targets by Sorafenib. ... 2
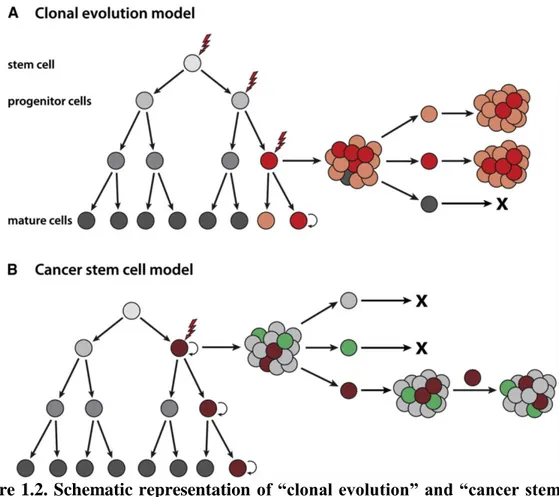
Figure 1.2. Schematic representation of “clonal evolution” and “cancer stem cell” models. ... 4
Figure 1.3. Potential origin of LCSCs. ... 6
Figure 1.4. Features of LCSCs, deregulated pathways and targeting strategies. ... 9
Figure 1.5. Primary and acquired resistance mechanisms to Sorafenib in liver cancer. 12 Figure 1.6. Role of liver cancer stem cells in the development of Sorafenib resistance. ... 17
Figure 1.7. Quinone metabolism. ... 18
Figure 1.8. Schematic representation of molecular targets of chalcones and their analogs... 19
Figure 2.1. Objective of the first part of the study. ... 22
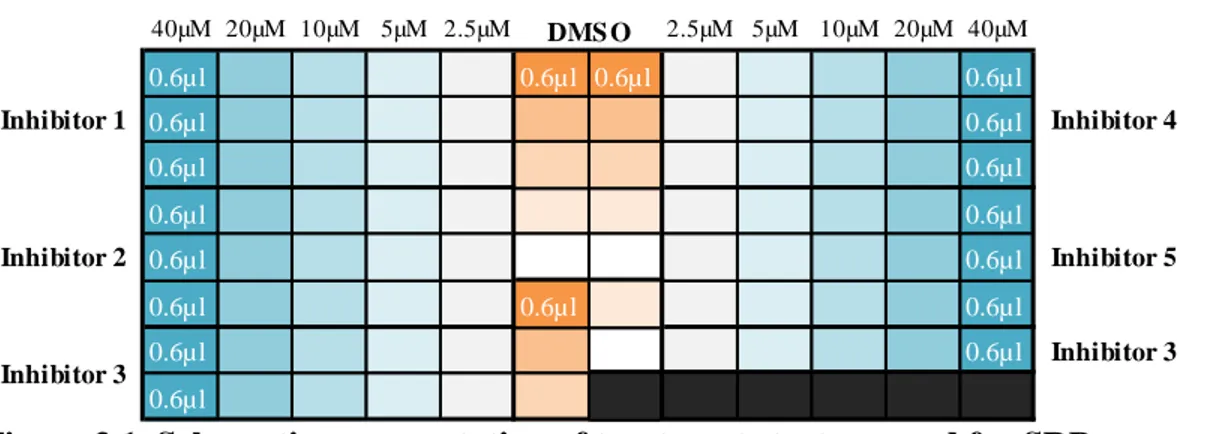
Figure 3.1. Schematic representation of treatment strategy used for SRB assay. ... 37
Figure 3.2. Schematic representation of cellular impedance apparatus and the RT-CES system. ... 38
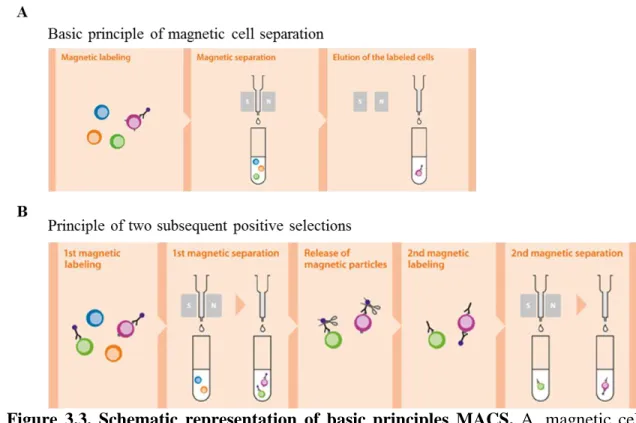
Figure 3.3. Schematic representation of basic principles MACS. ... 41
Figure 3.4. Schematic representation of Nanostring® nCounter® Technology. ... 47
Figure 3.5. Workflow for nCounter XT Gene Expression Assay. ... 48
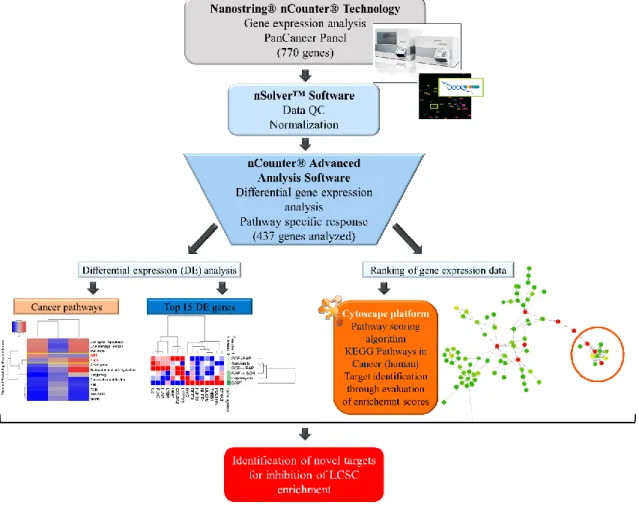
Figure 4.1. Flowchart representing steps followed to analyze the differential expression data and integrate it into the pathway scoring algorithm. ... 55
Figure 4.2. Expression of cancer stem cell markers. ... 57
Figure 4.3. The purity of CD133 and EpCAM marker-positive cells before and after magnetic separation shown by flow cytometry. ... 58
Figure 4.4. Sphere formation capacities of magnetically separated cells. ... 59
Figure 4.5. Expression of stemness markers in magnetically separated populations. ... 60
Figure 4.6. Positivity of LCSC markers in Huh7 and Hep3B cells after treatments with inhibitors. ... 64
xvi
Figure 4.7. Positivity of CD90 in Mahlavu and SNU475 cells after treatment with
selected inhibitors... 66
Figure 4.8. The effect of “sequential treatment strategy A” on LCSCs of Huh7 cells. . 68
Figure 4.9. Positivity of CD133/EpCAM population of Huh7 and Hep3B cells after “sequential treatment strategy B”... 70
Figure 4.10. Sphere formation capacity of Huh7 cells treated following sequential treatment strategy B. ... 71
Figure 4.11. Heatmap of differentially regulated cancer pathways. ... 73
Figure 4.12. Differential expression analysis of genes involved in Notch pathway. ... 76
Figure 4.13. Heatmap representing k-means-clustering of top 15 differentially expressed genes. ... 77
Figure 4.14. Relative expression of IL-8 and NANOG obtained by qRT-PCR... 78
Figure 4.15. Cytoscape representation of differential regulation of IL-8 in Huh7 cells treated with indicated inhibitors. ... 80
Figure 4.16. Expression of LCSC markers after treatment with Reparixin. ... 82
Figure 4.17. Sphere formation capacity of Huh7 cells treated with Reparixin. ... 83
Figure 4.18. Western blot analysis of SOX2 and Nanog in Reparixin treated cells. ... 84
Figure 4.19. Chemical structures of quinoids (1-5) and VGFR2 TKIs (6-10) tested in this study. ... 85
Figure 4.20. Expression of LCSC markers after treatment with quinoids or VEGFR2 TKIs. ... 87
Figure 4.21. Expression of LCSC markers in HCC cells after treatment with quinoids. ... 89
Figure 4.22. Growth curve of HCC cell lines after treatment with selected compounds. ... 98
Figure 4.23. Live images of HepG2 and SNU475 cells after treatment with selected compounds. ... 99
xvii
Figure 4.26. Cell cycle analysis of HepG2 and SNU475 cells after treatment with
selected compounds. ... 103
Figure 4.27. Western blot analysis of cell cycle proteins in HCC cells treated with
selected compounds. ... 105
Figure 5.1. Correlation of IL-8 expression and LCSC enrichment. ... 110 Figure 5.2. Effects of Sorafenib and Rapamycin treatments on LCSCs and tumor
progression. ... 112
Figure 5.3. Schematic representation of effects of IL-8 inhibition on LCSC enrichment.
... 113
Figure 5.4. Schematic explanation of comparative effects of VEGFR2 TKIs and
quinoids on liver cancer cells and LCSCs. ... 115
Figure 5.5. Effects of pyrazolic chalcone derivatives on cell cycle progression. ... 116 Figure A1. MFI values of CD133 and EpCAM staining of Huh7 and Hep3B cells
treated with small molecule inhibitors. ... 133
Figure A2. MFI values of CD90 staining of Mahlavu and SNU475 cells with selected
small molecule inhibitors. ... 133
Figure A3. MFI values of CD133 and EpCAM staining of Huh7 cells treated with
sequential treatment strategy A. ... 134
Figure A4. MFI values of CD133 and EpCAM staining of Huh7 and Hep3B cells
treated with sequential treatment strategy B. ... 134
Figure A5. MFI values of CD133 and EpCAM staining of Huh7 cells treated with
Reparixin alone and in combination with Sorafenib. ... 135
Figure A6. Volcano plots showing gene expression in Sorafenib or DAPT treated cells. Figure A7. Volcano plots showing gene expression in Rapamycin or Rap + Sor treated
cells. ... 137
Figure A8. Volcano plots showing gene expression in Sor → Rap or Rap → Sor treated
xviii
List of Tables
Table 1.1. Advantages and disadvantages of common CSC isolation methods. ... 5
Table 1.2. LCSC surface markers and their functions... 7
Table 1.3. EMT and molecular events involved in the development of Sorafenib resistance in HCC. ... 15
Table 3.1. Reagents used in cell culture. ... 25
Table 3.2. Inhibitors and DNA intercalators used in the first part of the thesis. ... 26
Table 3.3. Antibodies for flow cytometry analysis. ... 27
Table 3.4. Magnetic cell sorting reagents and materials. ... 27
Table 3.5. Primers used in this study. ... 28
Table 3.6. Western blot antibody list... 30
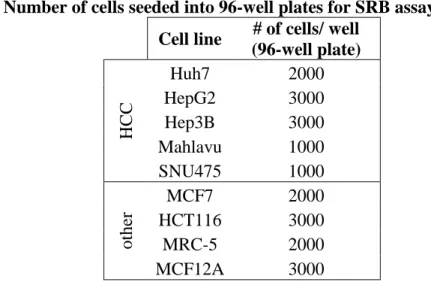
Table 3.7. Number of cells seeded into 96-well plates for SRB assay. ... 36
Table 4.1. IC50 values for the inhibitors involved in this study. ... 61
Table 4.2. IC50 values of quinoides and VEGFR2 TKIs. ... 86
Table 4.3. IC50 values and AF factors of quinoides and VEGFR2-TKIs on HCC cell lines. ... 91
Table 4.4. Chemical structures and IC50 values of compounds 12-53. ... 93
Table 4.5. IC50 values of compounds 39, 42, 49 and 52 on HCC cell lines ... 97
xix
Abbreviations
ATP Adenosine triphosphate
ALDH Aldehyde dehydrogenase
ATRA All-trans retinoic acid
ANXA3 Annexin A3
ABC ATP binding cassette
ABCB5 ATP binding cassette B5
bp Base pair
BMI1 B-cell-specific Moloney murine leukemia
virus integration site 1
BSA Bovine serum albumin
CSC Cancer stem cell
CI Cell index
CXCL1 Chemokine (C-X-C) ligand 1
JNK c-Jun NH2-terminal Kinase
CDS Coding sequence
cDNA Complementary DNA
CTGF Connective Tissue Growth Factor
CDK Cyclin-Dependent Kinase
Cq Quantitative cycle
qRT-PCR Quantitative Reverse Transcription PCR
DNA Deoxyribonucleic Acid
dNTP Deoxyribonucleotide Triphosphate
DMSO Dimethyl Sulphoxide
DTT Dithiothreitol
ddH2O Double-distilled water
DOX Doxorubicin
DMEM Dulbecco's modified Eagle's medium
EGF Epidermal growth factor
EGFR Epidermal growth factor receptor
EpCAM Epithelial cell adhesion molecule
EMT Epithelial-mesenchymal transition
EDTA Ethylenediaminetetraacetic Acid
ECM Extracellular matrix
xx
FGF Fibroblast growth factor
FLNA Filamin A
FACS Fluorescence-activated cell sorting
FDA Food and Drug Administration
GSH Glutathione
GAPDH Glyceraldehyde-3-phosphate Dehydrogenase
g Gram
HPC Hepatic progenitor cell
HBV Hepatitis B virus
HCV Hepatitis C virus
HCC Hepatocellular carcinoma
HNF4α Hepatocyte Nuclear Factor 4 alpha
HIF-1α Hypoxia-inducible factor 1 alpha
IgG Immunoglobulin G
IC50 Inhibitory Concentration 50
ICAM-1 Intercellular Adhesion Molecule 1
IL Interleukin
IL-6 Interleukin 6
IL-8 Interleukin 8
JAK-STAT Janus Kinase/Signal Transducer and Activator
of Transcription
kDa Kilo Dalton
KEGG Kyoto encyclopedia of genes and genomes
LRCC Label-retaining cancer cells
LCSC Liver cancer stem cell
LPC Liver progenitor cell
MACS Magnetic-activated cells sorting
mTOR Mammalian target of rapamycin
Tm Melting temperature
mRNA Messenger RNA
μg Microgram
μl Microliter
miRNA MicroRNA
mg Milligram
MEM Minimum essential medium
MAPK Mitogen-activated protein kinase
MDR1 Multidrug resistance
nm Nanometer
xxi
NF-κB Nuclear factor‐κB
Oligo(dt) Oligodeoxythymidylic Acid
OSM Oncostatin M
OD Optical density
OV6 Oval cell marker 6
PTEN Phosphatase and tensin homolog
PBS Phosphate Buffered Saline
PBS-T Phosphate Buffered Saline with Tween-20
PI3K Phosphatidylinositol 3-kinase
PDGF Platelet-derived growth factor
PDGFR Platelet-derived growth factor receptor
PARP Poly ADP-ribosyl polymerase
PCR Polymerase chain reaction
PVDF Polyvinylidene fluoride
PROM1 Prominin 1
ROS Reactive oxygen species
RT-CES Real-time cell electronic sensing
RNA Ribonucleic acid
RPM Revolutions per minute
RPMI Roswell Park Memorial Institute
S6 kinase S6 kinase
SHP-1 SH2-containing protein tyrosine
phosphatase-1
SDS-PAGE Sodium dodecyl sulfate-polyacrylamide gel
electrophoresis
SRB Sulforhodamine B
THY1 Thymus cell antigen 1
TZ Time zero
TGF-β Transforming growth factor beta
TCA Trichloroacetic acid
TBS Tris Buffered Saline
TBS-T Tris Buffered Saline with Tween-20
TBE Tris-borate-EDTA
TAP Tumor-activated prodrug
TME Tumor microenvironment
TKI Tyrosine kinase inhibitor
UV Ultraviolet
VEGF Vascular endothelial growth factor
xxii
VEGFR Vascular endothelial growth factor receptor
4EBP1 4E-Binding Protein 1
1
Chapter 1
Introduction
1.1. Hepatocellular carcinoma
Liver cancer is one of the leading causes of cancer-related deaths worldwide, with 782,000 new cases and 746,000 deaths reported in 2012 [1]. The prognosis for liver cancer is very poor (overall ratio of mortality to the incidence of 0.95) [2]. Liver cancer has several subtypes, but hepatocellular carcinoma (HCC) is the major histological subtype, accounting for 78% of all the liver cancer cases [3]. The etiological factors associated with HCC are chronic infection by Hepatitis B virus (HBV), Hepatitis C virus (HCV), exposure to aflatoxin, excessive alcohol intake, and obesity [4, 5]. HCC development involves several steps, where cirrhosis occurs as a consequence of hepatic
2
injury, which is followed by continuous cycles of hepatocyte regeneration and cell death. As a result of dysplastic nodule expansion, telomerase reactivation, and genomic instability, cancer occurs.
Depending on the tumor stage, patients with HCC have multiple treatment options such as curative resection, liver transplantation and systemic targeted therapy with Sorafenib (Nexavar, BAY43-9006) or Regorafenib. When transplantation is not an option or the tumor is in advanced stage, the latter is preferred. Sorafenib and Regorafenib is an oral multi-kinase inhibitor approved by FDA which has both proliferative and anti-angiogenic effects on liver cancer cells [6, 7] by inhibiting Raf, VEGFR, and PDGFR kinases (Figure 1.1). Nevertheless, these drugs can prolong patient survival for 2-3 months [8]. Also, the heterogeneous structure of HCC leads to primary or acquired resistance to these therapies. Therefore, discovery of alternative therapies targeting resistance-associated pathways is necessary for effective treatment of HCC.
Figure 1.1. Inhibition of multiple targets by Sorafenib. Sorafenib inhibits VEGFR,
3
Raf/MEK/ERK pathway to exhibit anti-angiogenic, anti-proliferative effects.
(CR#4239001150971)
1.2. Tumor heterogeneity and Cancer stem cells
Tumor heterogeneity has been defined as the existence of subpopulations of cells within a tumor (intra-tumor) or between tumors of the same subtype (inter-tumor) with different genotypes and phenotypes that acquire distinct biological roles [9, 10]. Traditionally explained, tumor heterogeneity arises from clonal evolution of tumor cells caused by continuous accumulation of genetic/epigenetic changes, or the changes in the tumor microenvironment (clonal evolution model). However, recently another description is made, so-called the “cancer stem cell hypothesis”, where tumor heterogeneity is created by a hierarchical organization of tumor cells by stem/progenitor-like cells, known as cancer stem cells (CSCs) [11, 12]. (Figure 1.2) The cancer stem cell model has drawn more attention since resistance to both radiation and chemotherapy, and tumor relapse could be explained reasonably by this theory [13-15]. CSCs are also known as tumor-initiating cells, since they have the potential to self-renew indefinitely, similar to normal stem cells. These cells are highly tumorigenic, metastatic, and resistant to chemotherapy and radiotherapy. Deregulation of the common pathways shared with normal stem cells, such as Wnt, Notch, Hedgehog and advanced DNA repair mechanisms play a vital role in the progression of tumorigenesis. Thus identification of CSC markers and introducing treatment strategies that target CSCs are of vital importance.
4
Figure 1.2. Schematic representation of “clonal evolution” and “cancer stem cell” models. A. Clonal evolution model, where mutations cause selective growth advantage
(red cell) and tumor cells that arise from this clone have the same tumorigenicity, whereas other cells (grey) are not capable of forming tumors randomly. B. The cancer stem cell model is based on a hierarchical organization of cells. A small sub-population of cells (brown cell) is able to form a new tumor (brown and grey cells) and their differentiation (green cells) leads to the heterogeneity of the tumor.
(Reproduced with permission from (scientific reference citation), Copyright Massachusetts Medical Society)
1.2.1. Identification of cancer stem cells
There are multiple ways to detect and isolate cancer stem cells from a heterogeneous population of cancer cells. One of them is the expression of specific cell surface markers on CSC population of most of the solid tumors involving breast, lung, colon, prostate, ovary, and liver. These are; CD133 (PROM1), CD44, CD24, EpCAM (epithelial cell adhesion molecule), THY1 and ATP binding cassette B5 (ABCB5) as well as Hoechst 33342 exclusion [16]. For the isolation of CSCs, sorting strategies using
fluorescence-5
activated cell sorting (FACS) which is capable of sorting via fluorochromes in immunofluorescence staining, and magnetic-activated cell sorting (MACS) which is based on super-para-magnetic and biodegradable microbeads attached to a specific antibody against a CSC marker that allows enrichment of CSCs by running the cells through a column placed in a strong magnetic field, are widely used. Another method is using Aldehyde dehydrogenase (ALDH) which is an intra-cellular marker that is used to isolate CSCs by flow cytometry via the Aldefluor method. Also, Hoechst 33342 dye staining method, which is based on the exclusion of the dye by the ABC transporters of CSCs detected by flow cytometry, is used commonly [17]. Advantages and disadvantages of each method are described in Table 1.1.
Table 1.1. Advantages and disadvantages of common CSC isolation methods.
1.2.2. Liver cancer stem cells
HCC is a histologically heterogeneous disease and contains a subpopulation of cells that are called liver cancer stem cells (LCSCs). As mentioned before, early in the development of HCC, long term hepatocyte regeneration and inflammation cause changes in the pathophysiology of the liver such as expansion of stem/progenitor cells expand as a result of impaired hepatocyte replication. Also, alteration of the microenvironment leads to the infiltration of lymphocytes which produce and secrete cytokines (Wnt, FGF, PDGF, VEGF, TGF-β) to activate stromal cells to promote the development of CSCs [18]. Nevertheless, there are several possible suggestions about the origin of LCSCs (Figure
Isolation Identification Advantages Disadvantages
CSC specific
markers Multiparameter
separation
Low viability of recovered cells-high cost-complexity of equipment-cell suspension
solutions only
ALDH Stability specificity
Hoechst 33342 No need for specific cellular markers
low specificty-lack of purity-do not reflect the entire stem cells-toxicity of dye
MACS Fast and easy Monoparameter separation-cell
suspension solutions only FACS
6
1.3) [19, 20]. The first possibility is the liver stem/progenitor cells which have the ability to self-renew and proliferate to form liver progenitor cells (LPCs) [21]. Malignant transformation of these cells is suggested to cause generation of CSCs through long term TGF-β exposure. Yet, transformed adult hepatocytes, which are able to regenerate during liver damage and differentiate into hepatocytes, are also one of the possible origins of LCSCs [22].
Figure 1.3. Potential origin of LCSCs.
(CR#4239000285365)
There are a number of markers to detect LCSCs which are mostly known for their distinct functions and are involved in the maintenance of CSC features (Table 1.2) [18, 23]. These are CD133, EpCAM, CD90, CD44, CD24, CD13 and oval cell marker OV6, as well as Hoechst dye efflux or ALDH activity, that were previously mentioned. Cells that are positive for these markers were shown to have more tumorigenic features than marker-negative cells in immunodeficient mice. For primary HCC, EpCAM, CD90, and CD133 are markers confirmed for the enrichment of CSCs. It has been shown that EpCAM+ and CD90+ CSCs were different regarding morphology and gene expression. In addition these
7
two markers were not expressed in primary HCC together, where EpCAM+ cells were shown to be associated with high tumorigenic capacity and epithelial stem cell features, whereas CD90+ cells had mesenchymal features with high metastatic capacity and activation of c-Kit signaling [24]. EpCAM has been shown to enhance Wnt signaling [25, 26] and CD133 expression maintains stemness through neurotensin/IL-8/CXCL1 signaling [27]. While CD13 takes role in the prevention of cell damage induced by genotoxic reagents [28], CD44 is found to control intracellular level of reduced glutathione (GSH) and regulate ROS defense and tumor growth [29].
Table 1.2. LCSC surface markers and their functions.
Apart from surface markers, the maintenance of CSCs are regulated by different transcription factors, such as Oct4, Sox2, NANOG, c-Myc, Klf4, etc. It has been reported that dysregulation of these factors promotes LCSC propagation and tumorigenesis [30-33].
Cell surface marker Function in CSCs Phenotypes of marker-positive
CSCs Cell lines
CD133 Neurotensin/IL-8/CXCL1 signaling Tumorigenic, chemoresistant PLC8024, Huh7, Hep3B, primary HCC EpCAM Activation of Wnt signaling Tumorigenic, invasive,
chemoresistant, circulating
Huh1, Huh7, primary HCC
CD44 Regulation of redox status through
xCT Tumorigenic, invasive PLC, PLC/PRL/5, HLF
CD90 Not reported Tumorigenic, metastatic,
circulating
HepG2, Hep3B, 20, 116, 125,PLC, Huh7, MHCC97L, MHCC97H, primary
CD13 ROS-induced DNA damage
reduction
Tumorigenic, cell cycle arrest, chemoresistant PLC/PRL/5, Huh7, Hep3B CD24 STAT3-mediated NANOG regulation Tumorigenic, chemoresistant, metastatic PLC/PRL/5, HLE, Huh7, primary HCC
DLK1 Not reported Tumorigenic, chemoresistant Hep3B, Huh7
OV6 Not reported Tumorigenic, chemoresistant,
invasive, metastatic
Huh7, SMMC7721, primary HCC
8
1.2.2.1. LCSCs for the clinical management of liver cancer
The fact that conventional HCC therapies target differentiated and growing HCC cells, and fails to eliminate CSCs, it has become more important to develop alternative methods to predict patient survival as well as potential therapies that achieve eradication of cancer. At this point, LCSC concept is suggested to contribute and improve HCC treatment greatly.
CSC markers, such as EpCAM has been used for the early diagnosis of lung cancer and to predict patient survival through FDA-approved CellSearch system, which determines the EpCAM+ circulating tumor cells [34]. Similarly, another research has examined CD45-CD90+ cells in blood samples of HCC patients and suggested that the detection of these cells could be a diagnostic method for HCC [35]. Another study has achieved to isolate circulating LCSCs from blood of HCC patients for the diagnosis of HCC. Thus novel diagnostic approaches for HCC might be available which aims to detect circulating hepatoma cells that express LCSC markers.
LCSC existence has been found to correlate with the patient prognosis as well. Research has reported that enhanced cytoplasmic expression of CD133 is a prognostic factor for recurrence of HCC and an indication of poor patient survival especially at the stage III and IVA HCC patients [36]. In addition, high expression of CD90 or OCT4 has been shown to predict a poor prognosis in HCC and that their combination presents higher sensitivity in the prediction of prognosis [37, 38]. CD24, CD44 and ICAM-1 expression have also been reported to correlate with aggressive HCC behavior and poor clinical outcome of patients [39-41]. Apart from the prognostic value of the surface markers, high expression of stemness-associated genes, such as Sox2, Oct4 and NANOG has also been shown to reflect CSC abundance and are suggested to be indicative of poor prognosis in HCC [42, 43]. Altogether, LCSC markers have also been regarded important regarding predicting the prognosis of HCC patients.
9
Apart from the diagnostic and prognostic potential of LCSCs in HCC, novel therapeutic strategies that aim to eradicate these cells have also been explored by many studies (Figure 1.4) [44, 45]. These strategies include ablation of cell surface markers, blockade of CSC related pathways, and disruption of the microenvironment, self-protection such as anti-immune evasion therapies.
Figure 1.4. Features of LCSCs, deregulated pathways and targeting strategies.
(CR#4239000761427)
Studies have revealed that directly targeting the LCSC surface markers such as CD133, CD90, EpCAM, CD44 through the administration of a marker-specific antibody conjugated with a cytotoxic drug or RNAi mediated silencing could potently inhibit hepatoma cells from propagating and even increased the sensitivity of HCC cells to Sorafenib [46-49].
10
Another strategy which aims to block the stemness-related pathways, involve several alternatives such as anti-self-renewal, anti-tumor growth, and induction of cell differentiation.
A genome-wide screening study has identified a microRNA (miRNA-181) which directly targets the Wnt/β-catenin signaling in EpCAM+ LCSCs and repress expression of stemness-related genes. Another study has demonstrated that targeting BMI1 with small molecule inhibitors could impair cell viability, reduce migration and sensitized HCC cells to 5-fluorouracil (5-FU) [50, 51]. Apart from impairing self-renewal, many studies are focusing on inhibiting the growth of LCSCs. For instance, targeting PTEN [52], TGF-β family proteins such as IL-6 [53, 54], have been shown to be potential therapeutic strategies for treatment of HCC. In addition, studies inducing differentiation of LCSCs in combination with conventional chemotherapy is suggested to be effective for HCC treatment. For instance, all-trans retinoic acid (ATRA) is found to induce differentiation of EpCAM+ LCSCs which was shown by a reduction in the CSC marker expression. In addition, combination of ATRA and cisplatin were shown to have a better therapeutic effect than cisplatin alone [55]. Another study introduced nuclear factor-4α (HNF4α), which is a regulator of hepatocyte differentiation and maintenance of hepatic function, to induce differentiation of CD133+/OV6 LCSCs [56, 57]. Oncostatin M (OSM), which is a cytokine that activates STAT3 and induces differentiation of hepatoblasts, was shown to differentiate EpCAM+ LCSCs. In addition, the combination of OSM and 5-FU was shown to eliminate both LCSCs and non-CSC cells synergistically [58].
Chemoresistance of LCSCs is another issue confronted in clinics which is mainly caused by the quiescent characteristics of LCSCs and their drug efflux ability. Therefore, many studies have identified potential targets to overcome this problem. One of them is the Akt/PKB signaling, which was found to be required for the CD133+ LCSCs. Upon inhibition of Akt, the chemoresistance of LCSCs was reported to be eliminated and cells became sensitive to DOX and 5-FU treatment [59]. Lupeol, which is a chemical
11
signaling which leads to suppression of self-renewal mechanisms of CD133+ LCSCs and sensitized them to DOX and Cisplatin treatment [60]. Another study revealed that silencing β-catenin signaling sensitized LCSCs to cisplatin [61].
Targeting the LCSC niche is another strategy which does not involve direct targeting of LCSCs, but effects the stem cell niche factors. For instance, blocking Akt/HIF-1α/PDGF-BB autocrine signaling was shown to weaken the chemoresistance of LCSCs and liver cancer cells under hypoxic condition [62]. On the other hand, anti-angiogenic therapy including VEGF or VEGFR inhibitors (Vatalanib and Cediranib), and the monoclonal antibody Bevacizumab, and multikinase inhibitors (Sorafenib, Sunitinib, Brivanib, and Linifanib) are found to suppress formation of tumor vasculature and effect self-renewal capacity of CSCs [63, 64]. Yet, their effects on LCSCs remains unclear.
Immunotherapy for CSCs has been an attractive topic for many researchers in recent years. Indeed, there have been studies conducted for glioblastoma [65], ovarian cancer [66], colorectal cancer [67]. A targeted immunotherapy study regarding HCC has revealed that Annexin A3 (ANXA3) which was found to be expressed in LCSCs, once transfected into dendritic cells, caused activation of T cells and killed LCSCs [68, 69]. Another recent study, which involves targeting of CD47 through a specific antibody, revealed that inhibition of CD47 increases phagocytosis of HCC cells by macrophages and suppresses tumor growth in xenograft models of HCC [70]. Therefore, it is suggested that immunotherapy might be an effective option for the eradication of LCSCs.
1.3. Sorafenib resistance
Sorafenib and Regorafenib are the only drugs used to treat advanced HCC which are approved by FDA, and they are effective in prolonging median survival time of HCC patients. Yet, recent studies have revealed that Sorafenib may cause primary resistance or acquired resistance in some patients (Figure 1.5) [71].
12
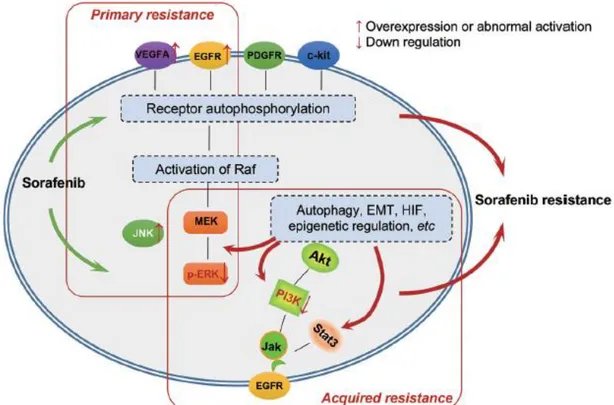
Figure 1.5. Primary and acquired resistance mechanisms to Sorafenib in liver cancer.
(CR#4239001150971)
1.3.1. Primary Sorafenib resistance
Primary resistance to Sorafenib is caused by genetic heterogeneity of HCC where some HCC cells and patients are initially resistant to Sorafenib. Although the exact mechanism that causes primary resistance remains unclear, several explanations may help to understand the mechanism. One of them is the evidence that nearly half of the HCC patients have over-expression or abnormal activation of EGFR or its ligand [72]. Other than EGFR signaling, the Ras/Raf/MEK/ERK pathway might be important for Sorafenib resistance. It is well known that in HCC this pathway is activated and the MAPK levels affect the sensitivity to treatment. It is reported that down-regulation of pERK might be causing Sorafenib resistance [73]. In addition c-Jun N-terminal kinase (JNK), which is also a member of MAPK family, was reported be used as a marker in the prediction of sensitivity Sorafenib treatment [74]. Another candidate biomarker that is suggested by
13
another study is amplification of VEGFA, which provides a distinct sensitivity to Sorafenib in patients [75].
1.3.2. Acquired Sorafenib resistance
Although Sorafenib is effective in blocking multiple cellular signaling pathways, it has been reported by many studies that it also activates the compensatory pathways and addiction switches at the same time or sequentially in HCC patients. The pathways and mechanisms involved in acquired resistance to Sorafenib are; PI3K/Akt/mTOR and JAK-STAT pathways, epithelial-mesenchymal transition (EMT), hypoxic microenvironment and cancer stem cells. [71, 76]
1.3.2.1. PI3K/Akt/mTOR pathway and Sorafenib resistance
PI3K/Akt and MAPK pathways which are involved in cancer progression and development of HCC are activated or overexpressed in most of the HCC patients. Although Sorafenib targets the MAPK pathway, PI3K/Akt pathway remains unaffected. Thus, PI3K/Akt signaling pathway acts as a compensatory pathway and causes Sorafenib resistance. It has been reported that Sorafenib activates Akt and causes upregulation of its downstream components such as S6K and 4EBP1 in HCC cells. Thus it is suggested that inhibition of Akt may be effective in sensitizing HCC cells to Sorafenib and induce apoptotic cell death [77-79].
1.3.2.2. JAK-STAT pathway and Sorafenib resistance
JAK/STAT pathway is also involved in the regulation of cell proliferation, differentiation, survival, and apoptosis in liver. It has been found that STAT3 is activated in HCC and
14
that its knockdown resulted in improved therapeutic results on HCC [80]. The activation of SHP-1 by Sorafenib treatment has been reported to inhibit phosphorylation of STAT3 and inhibit JAK/STAT pathway. However in cells that acquire Sorafenib resistance the expression of phosphorylated STAT3 has been shown to increase, which further cause a decrease in the expression of SHP-1 and pSHP-1 levels. Thus it is suggested that abnormal activation of STAT3 might play a role in acquired Sorafenib resistance.[81]
1.3.2.3. Epithelial-mesenchymal transition and Sorafenib resistance
Epithelial-mesenchymal transition (EMT) is the transformation of epithelial cells to a mesenchymal phenotype which is well known as a vital event involved in embryonic development and wound healing. It causes cells to acquire migratory and invasive properties and maintains stemness and causes immunosuppression [82]. It also participates in the progression and invasion of many cancer types including HCC [83, 84]. During EMT, downregulation of E-cadherin and cytokeratins together with the cell-cell adhesion molecules are observed, whereas the transcriptional repressors of E-cadherin (Snail, Twist, and Zeb) are upregulated. These events cause transformation to mesenchymal phenotype, which is reported to be the resistant state of cells to Sorafenib treatment due to upregulation of upstream PI3K/Akt and MAPK pathways. However, there are multiple pathways that regulate, induce and reverse EMT which contribute to the resistance of HCC to Sorafenib (Table 1.3) [85].
15
Table 1.3. EMT and molecular events involved in the development of Sorafenib resistance in HCC. “–“ stands for negative correlation with Sorafenib efficacy.
Pathways Molecules Regulates/induces Sorafenib
efficacy
Wnt
Frizzled, GSK-3β, β-catenin, TCF
Tumor cell proliferation, metastasis, EMT, alteration of microenvironment
-
TGFβ Smad, TIP30
Cell proliferation,
differentiation, apoptosis, EMT, tumor invasion, metastasis
-
RTK-Ras Raf, MEK,
ERK
Tumor microenvironment, tumor
development and progression -
RTK-PI3K Akt, mTOR EMT, motility and metastasis -
Hedgehog Gli, PTCH1,
Snail/Slug
Cancer cell proliferation, metastasis, EMT, stromal fibrosis
-
TNFα IκB, NF-κB EMT, metastasis, invasion, Twist expression↑ -
IL-1β IRAK, TRAF,
NF-κB
Tumor cell migration, invasion, angiogenesis, tumor growth, tumor progression,
inflammation, EMT
-
IL-6 HSP27, STAT3 Proliferation, EMT, metastasis,
inflammation -
Notch Snail, Slug,
Jagged1
Snail↑, Slug, EMT, E-cadherin↓, tumor cell migration, invasion, chemoresistance ↑
-
1.3.2.4. Hypoxic microenvironment and Sorafenib resistance
For the development of tumors, tumor microenvironment (TME) plays a critical role since it is composed of different type of cells and structures including blood vessels, the extracellular matrix (ECM), normal cells (stromal, fibroblasts, immune cells, pericytes, and adipocytes) and signaling molecules [86]. Unfortunately, anti-angiogenic drugs cause contraction of the tumor blood vessels which reduces the blood flow and the oxygen levels. This is called tumor hypoxia, which is closely related with resistance to many anti-cancer drugs including Doxorubicin in HCC [87, 88] since the survival of hypoxic cells
16
inside solid tumors has increased survival abilities due to their adaptive responses to hypoxia (regulation of genes involved in glucose uptake, metabolism, and proliferation). Sorafenib was found to downregulate the synthesis of hypoxia-inducible factor (HIF)-1α in HCC cells [89]. However, studies suggested that the adaptive responses may cause expansion of drug-resistant cells and lead to activation of multidrug resistance 1 (MDR1) gene activation, which encodes for P-glycoprotein, further decreasing the concentration of Sorafenib [90]. In addition, while Sorafenib inhibits HIF-1α synthesis (upstream inducer of VEGF), it causes a hypoxic response switch that relies on the HIF-2α pathways which activate TGF-α/EGFR pathway and causes resistance of HCC cells [91].
1.3.2.5. Liver cancer stem cells and Sorafenib resistance
As mentioned previously, LCSCs are capable of proliferating, differentiating and are highly resistant to drugs. Acquired resistance to Sorafenib can be explained by the capacity of differentiation of LCSCs into a new tumor by remaining undamaged from Sorafenib treatment and cause cancer recurrence (Figure 1.6) [85]. This was first demonstrated by a study which describes a subset of cancer cells named “label-retaining cancer cells (LRCCs),” which are highly enriched in HCC cells after Sorafenib treatment and displayed more resistance to toxicity of Sorafenib treatment by activating ERK or Akt signaling [92].
Altogether, the mechanisms discussed are essential in overcoming Sorafenib resistance and in designing alternative therapies for HCC patients.
17
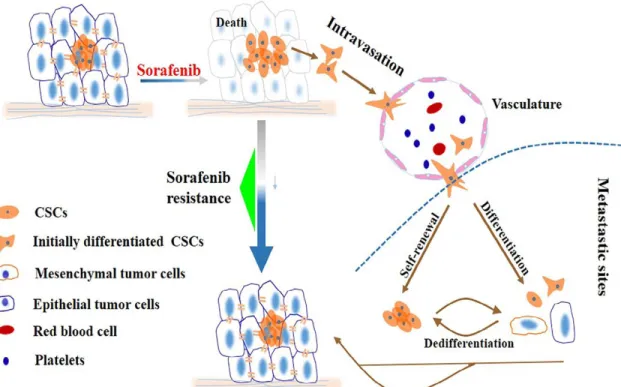
Figure 1.6. Role of liver cancer stem cells in the development of Sorafenib resistance.
Upon treatment with Sorafenib, most of the tumor cells are killed, and LCSCs remain. These cells are able to reconstitute the tumor on their own by differentiation leading to tumor relapse and even more malignant tumors. Another mechanism involves the migration LCSCs into blood vessels and metastasis into distal sites to differentiate and form a tumor with acquired resistance to Sorafenib.
(CR#4239001340400)
1.4. Quinones and cancer therapy
Quinones are a class of cyclic organic compounds that are derived from aromatic compounds and are known for their anti-tumoral activity [93]. They are used as tumor-activated prodrugs (TAP) to selectively kill tumor cells by getting tumor-activated in tumor tissue [94, 95] (Figure 1.7). In fact, mitomycin C is the most popular quinone-based hypoxia-activated prodrug [96]. Since it shows only a modest selectivity to hypoxia, the analog porfiromycin was shown to have higher selectivity. These prodrugs are activated by one-electron reduction and transform into DNA-crosslinking agents that form guanine-guanine crosslinks in the major groove [97]. In fact, a clinical study of porfiromycin in
18
combination with radiation therapy was reported to be useful in therapy of head-and-neck cancer [98].
Figure 1.7. Quinone metabolism. Quinones undergo one-electron reduction by
cytochrome C P-450 reductase to the semiquinone radical anion which can be oxidized back in normal cells.
In terms of HCC, several studies are emphasizing the potency of quinone derivatives as anti-tumor drugs. For instance, plumbagin, a medicinal plant-derived naphthoquinone, was shown to restrain angiogenesis-mediated tumor growth in HCC through inhibition of PI3K-Akt, VEGF/KDR, and Angiopoietins/Tie2 pathways together with angiogenic factors such as VEGF, bFGFi and CTGF [99]. However, it has been reported that quinones and quinone-like compounds are mainly organotoxic and that minor changes in the side chains of their structure cause variation in the toxicity of the compounds [100, 101]. Therefore, it is critical to model quinoid derivatives that cause minimum possible toxicity and highest inhibitory effect on cancer cells. In addition, the effects of quinones and quinone-containing alkylating agents on cancer stem cells haven’t been studied so far.
1.5. Pyrazolic chalcone derivatives as potential anti-cancer drugs
Chalcones are aromatic compounds are highly abundant in many plants such as tea, beer, vegetables and fruits and are reported to be cytotoxic in vitro [102]. They also have anti-inflammatory, analgesic and antipyretic effects and some are shown to have bactericidal,
19
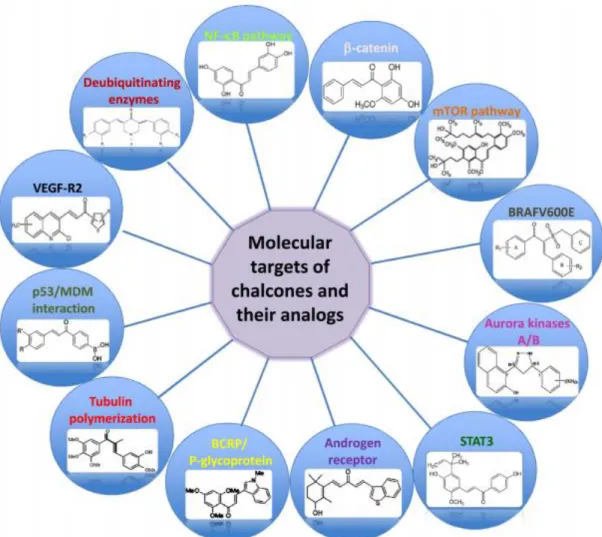
anti-fungal and insecticidal or antimutagenic activity [103, 104]. Chalcones belong to the flavonoid family which are intermediates in the flavonoid biosynthesis. Their chemical structure which contains a 1, 3-diphenyl, propenone template can be modified, which alters their molecular targets and provides various biological activities. In fact, chalcones having different structural changes have been investigated for their potential in cancer prevention and therapy in many studies (Figure 1.8) [105]. These include chalcones that target the p53 pathway, tubulin polymerization, proteasomal activity, multidrug resistance transporters, or tumor vasculature; modulate cell cycle progression; induce cell death and affect the NF-κB, androgen, and estrogen receptor pathways.
Figure 1.8. Schematic representation of molecular targets of chalcones and their analogs.
20
On the other hand, pyrazolic structures are commonly known for their analgesic, antipyretic and anti-inflammatory actions, they have also been shown to possess a wide range of anti-proliferative, and anti-leukemic activities [106-112]. However, the selectivity of these structures is highly dependent on the type of peripheral substituents of the pyrazole skeleton.
Thus synthesis and determining the antiproliferative effect of novel pyrazolic chalcone derivatives have been under investigation for different cancer types including leukemia, lung, colon and liver cancer. [113, 114]
21
Chapter 2
Objectives and Rationale
Hepatocellular carcinoma has a very heterogeneous nature, and the onset of cancer progression involves viral infections of the liver by HBV and HCV, exposure to chemicals, alcohol intake and obesity. Upon liver injury, hepatic progenitor cells (HPCs) are damaged and transformed into cells that carry stem cell features, so-called liver cancer stem cells (LCSCs). Known as one of the most important factors that cause chemo-resistance, tumor relapse and metastasis, LCSCs have also been reported to be involved in Sorafenib resistance, and they can be identified by their positivity for the cancer stem cell markers (CD133, CD90, EpCAM, CD44, etc.). Therefore, discovery of novel
22
therapies targeting both tumor cells and liver cancer stem cells is of vital importance. For this purpose, the first and the second part of this thesis comprehensively focuses on the investigation of potential targets and inhibitors that affect the LCSC enrichment and possible combination treatment strategies to overcome Sorafenib resistance (Figure 2.1).
Briefly, in the first part, characterization of cancer stem cells of Huh7 and Hep3B cells were done and a panel of PI3K/Akt/mTOR pathway inhibitors together with Sorafenib and clinically used chemotherapeutics (Doxorubicin and Camptothecin) were tested against HCC cell lines and their CD133+/EpCAM+ (LCSCs) populations, to introduce potential small molecule inhibitors that prevent the enrichment of LCSCs. Additionally, several combinatorial treatment strategies using Sorafenib together with selected inhibitors were performed. A panel of cancer pathways related genes were also analyzed to identify genes that may play a role in the conservation of stem cell features.
Figure 2.1. Objective of the first part of the study.
The second part of the study focuses on the differential effects of VEGFR2 tyrosine kinase inhibitor derivatives and quinones on liver cancer cells and LCSCs. This part of the study was designed to emphasize the importance of evaluating novel compounds not
23
only in terms of their cytotoxic potential but also in terms of their ability to eliminate tumor-initiating cells inside the cancer cells. For this reason, compounds that were able to display such effect were accepted to be superior to the compounds that did not fulfill both actions.
The third part of the study focuses on the anti-cancer effects of novel pyrazolic chalcone derivatives on HCC cells and the investigation of underlying molecular mechanisms involved. For this part of the study, initially, all compounds were tested against a panel of cancer cells for their cytotoxic activities. Then, molecules that were potent especially against HCC cells were further tested against a panel of HCC cells. The effects of compounds on cell proliferation, cell cycle and the mechanism of cell death induced were determined. And finally, the affected pathways were analyzed through western blot analysis. Together with all the experimental procedures described, the mechanism by which the pyrazolic chalcone derivatives induce their anti-cancer effect is thereby introduced.
24
Chapter 3
Materials and Methods
3.1. Materials
3.1.1. Cell culture reagents
All reagents used in cell culture are listed in (Table 3.1) Cell culture petri dishes, plates, cryovials were from Corning Life Sciences Incorporated (USA). Serological pipettes and sealed-cap polycarbonate centrifuge tubes were from Costar Corporation (Cambridge, UK)
25 Table 3.1. Reagents used in cell culture.
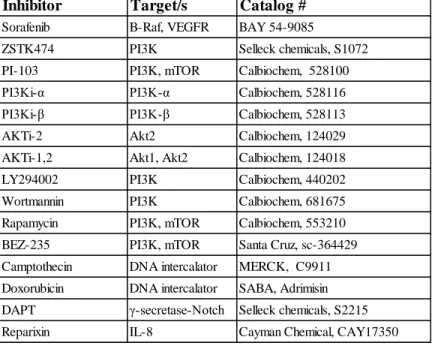
3.1.2. Kinase inhibitors and DNA intercalators
The kinase inhibitors and DNA intercalators used for the first part of the thesis are listed in Table 3.2. The list involves 10 different inhibitors targeting the PI3K/Akt/mTOR pathway, 1 inhibitor targeting the Notch pathway (DAPT), 1 inhibitor of IL-8 signaling (Reparixin), 2 different DNA intercalators (Doxorubicin and Camptothecin), and Sorafenib, a multikinase inhibitor targeting both VEGFR/PDGFR kinases and RAF/MEK/ERK pathway.
Name Company Catalog # Storage
conditions
Dulbecco's modified Eagle's medium (DMEM) GIBCO, Thermo Fisher Scientific 31885 +4°C
Roswell Park Memorial Institute (RPMI) 1640 medium GIBCO, Thermo Fisher Scientific 31870 +4°C
DMEM/F12 medium GIBCO, Thermo Fisher Scientific 21331-02 +4°C
Minimum Essential Medium (MEM) GIBCO, Thermo Fisher Scientific 10370 +4°C
Penicillin/straptomycin GIBCO, Thermo Fisher Scientific 15140-122 -20°C
Trypsin-EDTA GIBCO, Thermo Fisher Scientific 25200 -20°C
Non-essential amino acid (NEAA) Lonza BE12-114E +4°C
Fetal bovine serum (FBS) GIBCO, Thermo Fisher Scientific 10270 -20°C
L-glutamine GIBCO, Thermo Fisher Scientific 25030 -20°C
B27 supplement GIBCO, Thermo Fisher Scientific 10889038 -20°C
Epidermal growth factor (EGF) Thermo Fisher Scientific PHG0311 -20°C
Fibroblast growth factor (FGF) MERCK F0291 -20°C
Heparin MERCK H3149 +4°C
Insulin MERCK I-6634 -20°C
26
Table 3.2. Inhibitors and DNA intercalators used in the first part of the thesis.
3.1.3. Sulforhodamine B (SRB) assay and Real-time cell electronic sensing (RT-CES) reagents
Sulforhodamine B (SRB) sodium salt was from Sigma Aldrich, trichloroacetic acid (TCA) was from MERCK, and Tris was from Amresco. CloneFill Instrument for washing the 96-well plates was from Genetix and the plate reader ELx800 was from Biotek. The Real-time cell analyzer Instrument (single plate) and the E-plates (96-well) were from ACEA Biosciences.
3.1.4. Flow cytometry and antibodies for fluorescence staining
For the flow cytometric analysis BD Accuri™ C6 Cytometer (BD Biosciences) and Novocyte® flow cytometer (ACEA Biosciences) instruments were used. The fluorescence
antibodies used are listed in Table 3.3.
Inhibitor Target/s Catalog #
Sorafenib B-Raf, VEGFR BAY 54-9085
ZSTK474 PI3K Selleck chemicals, S1072
PI-103 PI3K, mTOR Calbiochem, 528100
PI3Ki-α PI3K-α Calbiochem, 528116
PI3Ki-β PI3K-β Calbiochem, 528113
AKTi-2 Akt2 Calbiochem, 124029
AKTi-1,2 Akt1, Akt2 Calbiochem, 124018
LY294002 PI3K Calbiochem, 440202
Wortmannin PI3K Calbiochem, 681675
Rapamycin PI3K, mTOR Calbiochem, 553210
BEZ-235 PI3K, mTOR Santa Cruz, sc-364429
Camptothecin DNA intercalator MERCK, C9911 Doxorubicin DNA intercalator SABA, Adrimisin DAPT γ-secretase-Notch Selleck chemicals, S2215