Contents lists available atScienceDirect
Journal of Physics and Chemistry of Solids
journal homepage:www.elsevier.com/locate/jpcsControlled modulation of 1D ZnO nano/micro structures: Evaluation of the
various e
ffects on the photocatalytic activity
Osman Arslan
a,b,⁎, Yüksel Abal
ı
aaChemistry Department, Celal Bayar University, 45100, Manisa, Turkey
bBilkent University, National Nanotechnology Center (UNAM), Ankara 06800, Turkey
A R T I C L E I N F O
Keywords: ZnO nano/microstructures HMTA 1D materials PhotocatalysisA B S T R A C T
Effects of the concentration, temperature and precursor type on the fabrication of the elongated ZnO nano/ micro structures were comprehensively investigated. Analytical investigations such as SEM and statistical analysis of the elongated ZnO nano/micro structures provided wide information about the growth behavior and final geometries. Different temperatures for the 1 D ZnO formation clearly revealed that hexagonally grown ZnO nanorods were obtained. Especially low crystal diffraction characteristics at low temperature (55 °C) implied that ZnO nano/micro rod formation requires some minimum conditions for the formation of an efficient photocatalyst. All XRD investigations together with SEM and TEM supported the ligand ordered elongation conducted by diverse beginning concentrations. Since temperature found as a highly dominant actor for morphology and surface sequence as manifested in crystallinity, morphology and photocatalytic results, we have systematically summarized the growth conditions of the ZnO nano/micro rods from same precursor.
1. Introduction
Zinc oxide (ZnO) in its amorf or nano form is a very important commercial material and it is used in commercial paints, as catalyst in rubber processing and UV preventing agent in sunscreen creams and also in many different emerging areas [1–3]. Especially ZnO thin films and nanostructures are very useful for nanoelectronic applications like solar cells or piezoelectrical applications. It is known that ZnO has a very wide band gap (3.37 eV) energy as a semiconductor and also has a large exciton binding energy (60 meV). In addition to that, exciton Bohr radius in ZnO is in the range of 1.4– 3.5 nm [4–6]. As one of the most important morphological mod-ification, one dimensional ZnO nanowires and nanorods show unique structural one-dimensionality and measurable quantum confinement effects. Therefore it can find also different application areas such as room-temperature ultraviolet (UV) lasers, photode-tectors and gas sensors[7–9].
Within the diverse nanostructures of ZnO one-dimensional ZnO synthesis has been studied widely due to its facile growth character-istics along the c axis of the wurtzite crystal, which has a hexagonal unit cell. Since polar faces are electrostatically unstable, (as known like Tasker type III surfaces) {0001} planes have the highest energy for further growth. Therefore c axis of the ZnO is the fastest growing direction. In case of the kinetically controlled surfaces for example
solution-phase syntheses, growth of the ZnO can be promoted by using ligands that preferentially attach to specific crystal faces. Still, one dimensional ZnO nanostructures are mostly synthesized by gas phase techniques such as chemical vapor deposition (CVD), chemical vapor transport (CVT) or pulsed laser deposition (PLD) [10–16]. Instead of gas phase reactions, solution based techniques such as hydrothermal or solvothermal methods or chemical precipitation or controlled reflux are highly attractive and don’t require high temperatures ( < 300 °C). This aspect lead us to study synthesis of ZnO nanorods by using aqueous conditions of by different molecular precursors. Zn(NO3)2·6H2O as Zn source and hexamethylene tetra-mine (HMTA) was selected as ligant for present study. In the literature similar studies of hydrolysis for zinc nitrate [Zn(NO3)2· 6H2O] in water with the addition of HMTA was also intensively studied[17].
In the present work, we focused to the temperature and con-centration effect on the formation of 1D ZnO nano/micro structures. By facile and easy to apply synthesis method, 1 D ZnO structures were fabricated and their compositional, geometrical and photo-catalytical features were examined. Obtained 1D structures were analysed by SEM, TEM, XPS and other analytical methods to observe the surface and morphology effects for a general evaluation of the on the formation of the 1D ZnO nano/micro structures.
http://dx.doi.org/10.1016/j.jpcs.2017.04.017
Received 22 February 2017; Received in revised form 25 April 2017; Accepted 29 April 2017
⁎Corresponding author.
E-mail address:[email protected](O. Arslan).
Available online 30 April 2017
0022-3697/ © 2017 Elsevier Ltd. All rights reserved.
2. Experimental
2.1. Materials
Zinc nitrate hexahydrate (Zn(NO3)2.6H2O, 98% purity), hexam-ethylene tetraamine (HMTA, 99% purity Alfa Aesar) were used as purchased. Technical EtOH and aceton and deionized water (DI) were used for the washing and drying procedures.
2.2. General procedure for ZnO nanorod synthesis
For the synthesis of the elongated ZnO structures, both 0.5 M Zn(NO3)2·6H2O and 0.5 M HMTA stock solutions were prepared and stored. Required amount of the solution from these stock solutions was taken and diluted with water to the 230 ml Teflon beakers. Solution was ultrasonicated for 5 min and placed into an oil bath which was heated previously to the required temperature. After 24 h solution was centrifuged and solid structures were washed with EtOH and aceton 2 times. There was no stirring during 24 h. All samples were dried in oven at 110 °C before the measurements (Fig. S1). List of the as-synthesized 1 D ZnO nanostructures and synthesis conditions were presented inTable S1.
2.3. Concentration effect on the 1D ZnO synthesis
Concentration effect on the formation of the ZnO nanorods from Zn(NO3)2·6H2O was studied with different (0.05 M, 0.025 M and 0.0125 M) Zn2+/HMTA (1/1) concentrations. General procedure was applied for each sample.
2.4. Temperature effect on the 1D ZnO synthesis
Temperature variation on the formation of the 1D ZnO was studied in different (95 °C, 85 °C, 75 °C and 55 °C) temperatures with 0.0125 M concentration for same Zn2+/HMTA ratios. During synthesis, oil bath temperature arranged very finely ( ± 1 C) and obtained solid structures were prepared as mentioned above.
2.5. Characterization
The powder X-ray diffraction (XRD) patterns of as-synthesized and thermally treated ZnO nanorods were measured with a STOE-STADI MP vertical system in transmission mode using Cu Kα (α=0.15406 nm) radiation. FT-IR and SEM analyses were conducted with Perkin Elmer-Spectrum 400 and NovaSEM 430 respectively. Samples were placed over a Cu tape for SEM and sputtered with 5 nm Au using PECS-682.
UV–visible measurements and nanorod size analysis were carried out using Perkin-Elmer Lambda 950 and Image J programme respectively. XPS was used for ZnO nanorod surface analysis. Experiment was performed by X-ray photoelectron spectroscopy (XPS, Thermo Scientific). XPS spectra was obtained by a flood gun charge neutralizer system equipped with a monochromated Al Kα X-ray source (hν=1486.6 eV) by using a 400 mm spot size. TEM investigation was obtained by JEOL-JEM 2100 high-resolution transmission electron microscope using 200 nm mesh Cu grids. EtOH solution of ZnO structures were dropped on Cu grid and dried at room temperature. No sputtering was applied.
2.6. Photocatalytic activity evaluation
The photocatalytic performance of the obtained 1D ZnO structures were evaluated based on the degradation reaction of methylene blue (MB) aqueous solution. Before photocatalytic application, blank cor-rections were made for catalytic activity study. After that, MB solution (1.10–4M) was prepared in water and 1D ZnO nanorods (1 mg) were dispersed with stirring at 100 rpm, 5 min. To ensure the adsorption of the methylene blue, solution was stirred with 250 rpm at dark condition (in a closed closet) for 1 h before the experimental procedure. Subsequently 50 ml solution was irradiated with mercury lamp (352 nm, distance=15 cm) and sample aliquots were taken to observe the concentration by UV–vis spectroscopy. The measured absorption values for methylene blue wasfitted with an exponential decay (ln (C/ C0)=-kt) where t is the exposure time and k is the decay constant, C0 and C are the concentrations of methylene blue at the time of 0 (beginning) and t. Particles were centrifuged and separated before the UV–vis measurements. An additional experiment was conducted for the general dye adsorption onto the ZnO structures in every experiment to avoid the experimental errors.
3. Results and discussion
3.1. General evaluation of the 1D ZnO synthesis
It is widely known that aqueous solutions of easily soluble zinc salts form Zn2+cations by solvation via water molecules but these conditions differ when dilute solutions are prepared. Because zinc(II) can exist as hydroxyl species such as ZnOH+
(aq), Zn(OH)2(aq), Zn(OH)3-(aq) and Zn(OH)42-(aq)[18]. Therefore concentration of the prepared solutions must be controlled for these complexes which are dependent on the pH and solution temperature. When solutions become saturated and solid ZnO nuclei formation is started, ZnO crystal can grow more by the diffusion of the available precursors. Furthermore hydroxyl complex
Fig. 1. a) Selective adsorption of HMTA during ZnO nano/micro rod formation b) XRD patterns of the ZnO nanorods synthesized with different concentrations at 95 °C.
(intermediate) plays a role in the condensation and particle formation process. By utilization of the surface directing agents such as HMTA or some other amines, hydrolysis and condensation reactions of zinc salts result in one-dimensional ZnO nano crystals. Observations revealed that wire shaped structures were formed at pH > 9 and this process does not additional additives. Additionally basic conditions are vitally important since divalent metal cations do not readily hydrolyze in
acidic media and form necessary structures. It has been suggested[19] that additives like HMTA decomposes during the reaction and in-creases the pH to above 9 at the crystal surface and therefore acts as promoters or inhibitors for nucleation and growth. In a similar study it has been revealed that counter ions like nitrate, acetate, chloride, formate, sulphate modulate the morphology of the fabricated ZnO crystals but concentration, zinc to HMTA proportion, method,
strate features and synthesis conditions were completely different[15]. In previous studies hydrolysis of zinc nitrate resulted that HMTA concentrations should be less than 0.1 M within the 5 < pH < 8 and especially temperature should be > 80 °C for a regular elongated ZnO species. HMTA is a nonionic cyclic tertiary amine and acts as a Lewis base which capable of bidentate complex formation with two zinc(II) ions in solution[20–25]. Additionally its hydrolysis produces suitable conditions and formaldehyde and ammonia in the necessary pH range. It is also known that HMTA and ammonia can kinetically control species in aqueous solution by the help of coordinated zinc(II). If concentration in the ZnO formation is low this allows us the opportu-nity of the selective growth for the selected precursors[20–24]. 3.2. Effects of concentration on the ZnO nanorod formation
Fig. 1a describes the formation of 1D ZnO and attachment of the HMTA for the growth reactions. Concentration effect on the growth of the ZnO nano-micro structures were analysed by XRD (Fig. 1b) and SEM (Fig. 2). ZnO-1 represents the highest concentration in the denotation. Chemical reactions and equations which are anticipated during the formation of the ZnO structures were presented by Eqs.(1)– (5). HMTA + 6H O ⇌ NH + 6HCOH2 3 (1) H NH +3 2O ⇌ NH4++OH− (2) Zn2++4NH ⇌ [Zn(NH ) ] 3 3 42+ (3) Zn2++2OH ⇌ Zn(OH)− 2 (4) H Zn(OH) ⇌ ZnO +2 2O (5)
When concentration effect on the growth and crystallinity is compared, XRD results showed that at 95 °C there is no big difference on the specific facets of the ZnO nano-micro rods. Especially in [002] peaks which correspond to the c axis, similarity is seen between the 5×10⁻³M (ZnO-1), and 2.5×10⁻³M (ZnO-2) together with 1.25×10⁻³M (ZnO-3) concentrations of zinc salt and HMTA. Other [100] and [001] peaks show the analog behavior. This results revealed that it is possible to use the lowest (1.25×10⁻³M) concentration of the zinc salt and HMTA for the synthesis of ZnO nano-micro rods. Analysis of the SEM images provided detailed information about the obtained structures at this concentration. SEM images of the highest 1:1 concentration (ZnO-1) reveals cone shape of the elongated nano-micro ZnO structures. Different size and diameter distribution was detected
which may form due to the small regional concentrationfluctuations. Results showed that generally decreasing precursor concentration slightly increases the diameter and length of the ZnO structures obtained but some variations can be observed. In higher concentrations of the precursor, ZnO structures formed urchin like branched mor-phology and as the concentration decreased, longer and less branched ZnO cones are observed. Generally cone structures becomes dominant and branches disappear. It can be observed that if concentration decreases, appeared XRD peaks are less in their intensity and (001)/ (002) ratio decreases too. All the obtained XRD diffraction patterns showed no different peaks from the JCPDS card number 36-1451. The peaks in the XRD spectra could be assigned to the (100), (002), (101), (102), (110), (103), (112), and (004) crystal planes of ZnO nanorods with wurtzite crystal structure respectively.
1D ZnO structures (nano-micro rods) showed conical shape and they are well-ordered but (002) XRD peak is not the most highest in intensity which shows that the growth pattern is not exactly along the c-axis direction. SEM images proved that elongated structures form urchin type structures which broader side attach together. Additionally aggregation and attachment of tail-to-tail is visible. Dimensional comparison with different concentrations have been summarized in Fig. 3. By combining the SEM results, it is clear that increasing concentration increases the length and diameter of the nanorods. Variation in the diameter is slightly smaller but it is also changing with different concentrations. Due to its nano/micro regime dimen-sions, lower agglomeration, less bi or multimodal morphology variation and sustainable conical morphology, lowest concentration can be Utilized for the fabrication of 1D ZnO structures. These acicular morphology under micrometer range seems forming almost no urchin type structures providing better dispersibility and easy to measure characteristics.
3.3. Effect of the temperature on the 1D ZnO formation
After the analysis of the concentration effect for the formation of 1D dimensional ZnO structures controlled by counter NO3-anion, in the next step, temperature parameter was investigated. Therefore same three concentration were used but temperature was decreased to 85 °C. Again, all the obtained XRD diffraction patterns showed no different peaks from the JCPDS card number 36-1451 (Fig. 3). According to the literature, when Zn(NO3)2·6H2O is used as the precursor together with HMTA, obtained structures were rod-shaped whereas ZnCl2resulted with acicular morphology. It should be noted that temperature, concentration, volume and some other parameters are always different and these results therefore only can give a rough anticipation about the 1D ZnO structure fabrication.
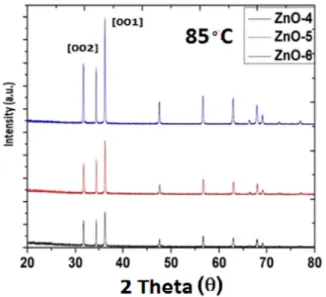
It was found that Zn2+cation and other available species form some intermediate molecules like Zn5Cl2(OH)8 in the ZnCl2 case and decrease in pH value can form the individual needles or prismatic microcrystals. According to XRD patterns inFig. 3(001) peak shows its highest intensity in the lowest (0.00125 M) concentration. Interestingly if concentration is changed to 0.0025 M (ZnO-5) and 0.005 M (ZnO-4), (001)/(002) peak ratio decreases remarkably. Especially at this tem-perature (85 °C) when concentration is 0.00125 M (ZnO-4) highest (002) intensity is observed. Additionally size and diameter investiga-tion of the obtained 1D nanostructures (Fig. 4) were also conducted.
According to the results presented inFig. 4, diameter of the 1D ZnO nano/micro structures do not show a remarkable morphology variation. Fluctuations are about ± 15 nm when we compare these three (ZnO-4, ZnO-5, ZnO-6) structures. On the other hand if we analyze the average length values, we observe a non uniform variation. At low concentrations of Zn(NO3)2·6H2O:HMTA (1:1) mixture, 3270 nm average value for the obtained 1D ZnO structures were detected but this value was decreased to 3030 nm when the concentration was increased two-fold. Interestingly again, at highest 0.005 M concentration, average length value was increased to a point (3206 nm) similar to ZnO-4.
Fig. 3. XRD patterns of 1D ZnO structures obtained with different concentration proportions at 85 °C.
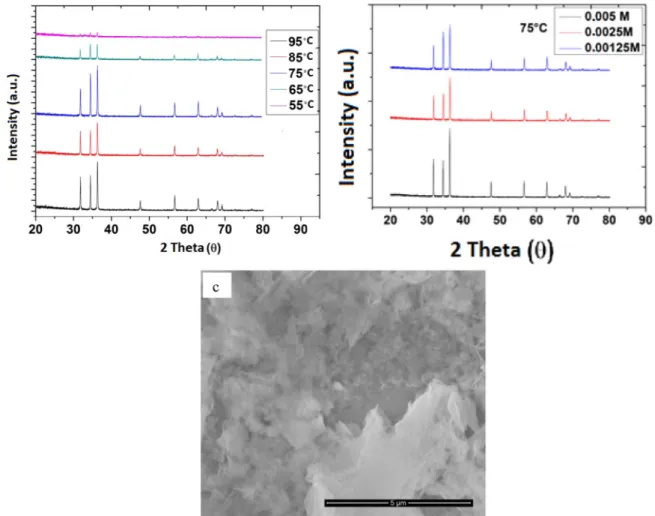
InFig. 5a temperature effect on the crystallinity between the range of 55 °C and 95 °C is observed with 0.00125 M precursor values. Concentration was kept similar but when the temperature was
decreased to 55 °C it is clear that crystallinity of the obtained ZnO nanostructures was remarkably low and almost no crystalline struc-tures were observed (Fig. 5c). Morphological observation of the same
phenomena can also be monitored by SEM pictures for 75 °C, 65 °C and 55 °C. 75 °C is still efficient for the formation of the 1D ZnO nano/ micro structures as XRD patterns showed at different concentrations (Fig. 5b). But at 65 °C, instead of the [001] facet, [002] becomes more dominant and at 55 °C not an XRD peak pattern was observed. SEM pictures for 55 °C showed that there is no 1D ZnO formation and relatively bulk structures are seen (Fig. 5c).
3.4. Surface and optical properties of the 1D ZnO nano/micro structures
XPS was used to investigate the surface composition of the obtained ZnO nanorods. For investigation of the 1D ZnO surfaces, ZnO-3 was selected as model structure.Fig. 6reveals the XPS survey and high resolution O 1s, Zn 2p and N 1s spectra. N 1s region was scanned with high resolution parameters to investigate if HMTA is still attached to the surface or any nitrogen is available on the ZnO surface.
As observed, there is no observable peak for the high resolution N 1s range. According to the survey spectra (Fig. 6a), all of the peaks can only be ascribed to Zn, O, and C elements as labeled. No other impurities were observed except C as impurity. All the XPS spectra was calibrated with the binding energy of carbon C1s peak (284,7 eV) as reference. Thermo Avantage v4 programme was used for the raw data. The deconvolutions of the XPS peaks for the O1s core level line from washed/dried ZnO 1D nanorods are shown in Fig. 6b. In this figure, the deconvolutions show the presence of two different O1s peaks in the fabricated 1D ZnO structures. The peak centered at 531.4 eV (O1) is associated to the Zn bonded oxygen in the wurtzite nanos-tructure surrounded by the Zn metal atoms with their full complement
of nearest-neighbor O2- ions. Additionally peak at 533.6 eV is attrib-uted to the presence of OH bonds, i.e. ZnO(OH). High resolution XPS spectra of the Zn atom was shown inFig. 6c. The deconvolutions of the Zn 2p spectra showed that Zn 2p3/2 and Zn 2p1/2 peaks are positioned on 1021.2 and 1044.6 eV respectively. Obtained peaks are asymmetrical, densities are different and peaks are relatively broad. For a good fit to the experimental data, we have applied the deconvolutions of two Gaussians for the spectras. It can be speculated that almost same type of Zn species exist on the surface of the ZnO nanorods. The observed peak with binding energy of 1021.2 is associated to Zn species in ZnO but very smallfluctuation around the binding energy of 1022 eV could correspond to Zn in ZnO(OH) but there is no clarity on this issue.
Fig. 7shows the TEM and HR-TEM images of the ZnO-3. From images we can see the diameter of the 1D ZnO structure is around 2 µm and crystallinity is high. In HR-TEM, it is possible to observe the [002] d-d spacing as 0.26 nm with 2 nm scale bar. Images reveal that 1D ZnO structures have high crystal orientation throughout the structure. As interplanar spacing also confirmed, ZnO growth and crystallinity are consistent with the speculated experimental results.
FT-IR results (Fig. 8a) of the Zn precursor and elongatedfinal ZnO structure revealed the pure and clean surface. Peak at 540 cm-1 belongs to the Zn-O and at 3300 cm-1 belongs to the water (-OH) peak in the zinc precursor. Spectra shows no residue of the HMTA adsorption or any other organic molecules on the final 1D ZnO. Complexfingerprint peaks of the HMTA is quite characteristic and generally belong to the N-H or N-C bonding. Butfinal structure does not contain any of these peaks proving a clear ZnO surface.Fig. 8b reveals the temperature effect on UV–vis absorption spectras of the 1D
Fig. 5. a) Effect of the temperature on the XRD patterns of the different ZnO nano/micro rods b) Concentration effect on the XRD patterns of the 75 °C synthesized ZnO nano/micro rods c) SEM image for the ZnO structures obtained at 55 °C.
ZnO nano/micro structures. It is widely known that optical absorption edge has a tendency to shift upper or lower wavelengths with variation in growth temperature, concentration and other counter ions. According to the UV–vis absorption spectra maximum point of the absorption is around 394 nm and relatively broad as seen in the Fig. 8b. Interestingly UV absorption peak for 65 °C showed a very small absorption maximum but 55 °C shows almost no absorption. This is
also another effect of the temperature on the 1D ZnO formation under mentioned conditions. Zeta potential measurement was conducted for ZnO-3 to investigate the surface character in aqueous conditions. At very neutral conditions (pH=6.9) synthesized structures gave an average −34 mV (Fig. 8c) value which means a negatively loaded ZnO surface structure in water. Possibly oxygen dominant composition and utilized precursors provided measured value.
Fig. 6. a) XPS investigation of the ZnO-3 nanostructure as model structure a) Survey XPS b) High resolution Zn region c) High resolution O region d) High resolution N 1s region.
Investigation of the photocatalytic activities of as-synthesized 1D ZnO structures were conducted on degradation of the methylene blue (MB). Beginning concentration (C0) of MB solution was analysed by the maximum absorption peak at about 662 nm (λmax) by UV–vis spectro-scopy. As stated earlier, in every experiment adsorption of the MB was excluded to derive the exact value of the decomposition degree. If there was no UV light irradiation, beginning concentration of MB was unchanged (not shown here). In Fig. 9 variation of degradation processes with the assistance of 1D ZnO nano-micro structures were presented. Obviously a continuous decrease of MB absorption by increasing irradiation time was observed. Additionally no new peak observed during the decomposition process indicating the degradation of possible intermediate products. InFig. 9photocatalytic degradation of MB was presented as a function of irradiation time with different 1D ZnO nano/micro structures. According to the continuous degradation of the MB, it can be revealed that degradation of MB can be described by Langmuir–Hinshelwood mechanism. In this equation C0is initial concentration of used MB, C is the concentration of MB depending on irradiation time, and k is reaction rate constant. Therefore if there is an increase in –In(C/C0) this will correspond to a decrease in the degradation of MB. It is clear that ZnO-3 and 4 shows the best activity and decomposed about 96–97% of MB after 90 min irradiation. When compared to other obtained ZnO structures, ZnO-5 shows the weakest photocatalytic activity.Supporting Table 1, presents the decomposition rates of the methylene blue with fabricated ZnO structures. When kinetic behaviors of these 1D ZnO structures studied, an obvious linear relationship between the value of ln(C0/C) and the irradiation time can
be observed with slight variations. Whole photocatalytic process can be regarded as pseudofirst-order reaction obeying the presented expres-sion. According to the results ZnO-4 has the highest k constant with 8.2×10⁻³min-1 value which was also noticeable during the experi-mental conditions. Accordingly ZnO structures which were obtained at 55 °C and 65 °C were not compared since their observation is speculative due to the low crystalline character.
Additionally ZnO-1 and ZnO-2 showed relatively weak photocata-lytic efficiency. After a thoroughly investigation, it can be concluded that reasons such as; a) local agglomerations, b)lower surface area due to the urchin type 1D ZnO structure formation c) bigger size/lower adsorption (decomposition) capacity can be the reason for the lower activity. Especially SEM images clearly support this estimation. Since lower agglomeration and higher adsorption of the dye and higher surface area is available for the ZnO-3, decomposition values are better as compared to other structures. Same derivatization can be done for the ZnO-4. ZnO-6 also shows also an efficient photoactivity (92% decomposition) while blank samples are almost remained unaffected. Comparing the activity results we can simply conclude that the photocatalytic activity is affected by different parameters for the formation of 1D ZnO nano-micro structures.
Temperature effect onto the obtained ZnO nano/micro structures can be seen atFig. 9c. It was observed that ZnO nano/micro structure photocatalytic efficiency was relatively poor when compared to pre-vious compositions. Especially photocatalytic efficiency test for the ZnO nano/micro structures obtained at 65 °C and 55 °C resulted with very low values. Probably low crystallinity caused no efficiency and obtained
Fig. 8. a) FT-IR investigation as model 1D ZnO structure (ZnO-3) b) Temperature effect on the UV–vis absorption properties of 1D ZnO nano/micro structures c) Zeta potential measurement (−34 mV) of the ZnO-3 at pH=6.9.
results are the adsorption of the MB dye onto the ZnO structures. As a results, we have revealed that, temperature has an enormous effect on the formation of surfactant facilitated 1 D ZnO structures. Crystallinity and optical properties together with morphological and surface characteristics showed that, highly crystalline structures can be obtained till 75 °C under the mentioned conditions. After this temperature, possibly there is no enough energy for the aligned growth of the ZnO nano/micro structures. Instead, amorphous geometries were observed. XPS spectroscopy and TEM investigation proved that surface contain no HMTA agent which is a clear proof for the formation of clean and catalytically active 1D ZnO structures.
4. Conclusion
Results for the formation of the ZnO structures have showed that temperature and concentration have a huge effect on the growth habits of the elongated ZnO nano/micro structures as analytical analysis revealed. Specific intensity increase in [001] XRD peak was observed in the decreased temperature with lowest concentration of the reacting species. Slightly nano/micrometer sized structures or cone shaped structures with urchin type formations were observed. XPS results revealed no nitrogen availability and decomposition results showed varying decomposition profiles for as-synthesized ZnO structures. Temperature examination revealed that under low temperature condi-tions (55 °C) crystal formation was not observed and photocatalytic activity was also inefficient.
Acknowledgment
Dr. Arslan gratefully acknowledges the Celal Bayar University for infrastructure and The Scientific & Technological Research Council of Turkey (TUBITAK), BIDEB Fellowships for 2232 programme (project no. 115C095).
Appendix A. Supporting information
Supplementary information associated with this article can be found in the online version atdoi:10.1016/j.jpcs.2017.04.017.
References
[1] D.C. Reynolds, D.C. Look, B. Jogai, C.W. Litton, T.C. Collins, W. Harsch, G. Cantwell, Neutral-donor–bound-exciton complexes in ZnO crystals, Phys. Rev. B 57 (1998) 12151–12155.
[2] M. Law, J. Goldberger, P.D. Yang, Semiconductor nanowires and nanotubes, Annu. Rev. Mater. Res. 34 (2004) 83–122.
[3] M.H. Huang, S. Mao, H. Feick, H.Q. Yan, Y.Y. Wu, H. Kind, E. Weber, R. Russo, P.D. Yang, Room-temperature ultraviolet nanowire nanolasers, Science 292 (2001) 1897–1899.
[4] J. Goldberger, D.J. Sirbuly, M. Law, P.J. Yang, ZnO nanowire transistors, Phys. Chem. B 109 (2005) 9–14.
[5] H. Kind, H.Q. Yan, B. Messer, M. Law, P.D. Yang, Nanowire ultraviolet photo-detectors and optical switches, Adv. Mater. 14 (2002) 158–160.
[6] Q. Wan, Q.H. Li, Y.J. Chen, T.H. Wang, X.L. He, J.P. Li, C.L. Lin, Fabrication and ethanol sensing characteristics of ZnO nanowire gas sensors, Appl. Phys. Lett. 84 (2004) 3654–3656.
[7] M. Law, L.E. Greene, J.C. Johnson, R. Saykally, P.D. Yang, Nanowire dye-sensitized solar cells, Nat. Mater. 4 (2005) 455–459.
Fig. 9. a) Photocatalytic efficiency of the as-synthesized (for 95 °C and 85 °C) 1D ZnO structures b) An example UV decomposition plot of the MB for the ZnO-3. c) Temperature effect onto the photocatalytic evaluation of the ZnO structures obtained at 75 °C, 65 °C and 55 °C.
[8]N.S. Norberg, K.R. Kittilstved, J.E. Amonette, R.K. Kukkadapu, D.A. Schwartz, D.R. Gamelin, Synthesis of colloidal Mn2+:ZnO quantum dots and high-T
C
ferromagnetic nanocrystalline thinfilms, J. Am. Chem. Soc. 126 (2004) 9387–9398.
[9]P.W. Tasker, The stability of ionic crystal surfaces, J. Phys. C: Solid State Phys. 12 (1979) 4977–4984.
[10] X.M. Chen, Y. Ji, X.Y. Gao, X.W. Zhao, Ag-doped ZnO nanorods synthesized by two-step method, Chin. Phys. B. 21 (2012) 116801.
[11] G. Kenanakisa, M. Androulida, E. Koudoumas, C. Savvakis, N. Katsarakis, Photoluminescence of ZnO nanostructures grown by the aqueous chemical growth technique, Superlattices Microstruct. 42 (2007) 473–478.
[12] E. Rokhsat, O. Akhavan, Improving the photocatalytic activity of graphene oxide/ ZnO nanorodfilms by UV irradiation, Appl. Surf. Sci. 371 (2016) 590–595. [13] F.S. Chien, C.R. Wang, Y.L. Chan, H.L. Lin, M.H. Chen, R.J. Wu, Fast-response
ozone sensor with ZnO nanorods grown by chemical vapor deposition, Sens. Actuators B 144 (2010) 120–125.
[14] L.W. Ji, S.M. Peng, Y.K. Su, S.J. Young, C.Z. Wu, W.B. Cheng, Ultraviolet photodetectors based on selectively grown ZnO nanorod arrays, Appl. Phys. Lett. 94 (2009) 203106.
[15] J.X. Wang, X.W. Sun, Y. Yang, H. Huang, H.Y. Lee, O.K. Tan, L. Vayssieres, Hydrothermally grown oriented ZnO nanorod arrays for gas sensing applications, Nanotechnology 17 (2006) 4995.
[16] W.I. Park, G.C. Yi, M.Y. Kim, S.J. Pennycook, ZnO nanoneedles grown vertically on Si substrates by non-catalytic vapor-phase epitaxy, Adv. Mater. 14 (2002) 1841–1843.
[17] J.J. Wu, S.C. Liu, Low-temperature growth of well aligned ZnO nanorods by chemical vapor deposition, Adv. Mater. 14 (2002) 215–218.
[18] P.D. Yang, H.Q. Yan, S. Mao, R. Russo, J. Johnson, R. Saykally, N. Morris, J. Pham, R.R. He, H. Choi, Controlled growth of ZnO nanowires and their optical properties, J. Adv. Funct. Mater. 12 (2002) 323–331.
[19] B.D. Yao, Y.F. Chan, N. Wang, Formation of ZnO nanostructures by a simple way of thermal evaporation, Appl. Phys. Lett. 81 (2002) 757–759.
[20] Y. Sun, G.M. Fuge, M.N.R. Ashfold, Growth of aligned ZnO nanorod arrays by catalyst-free pulsed laser deposition methods, Chem. Phys. Lett. 396 (2004) 21–26. [21] L.E. Greene, M. Law, J. Goldberger, F. Kim, J.C. Johnson, Y.F. Zhang,
R.J. Saykally, P.D. Yang, Low-temperature Wafer-scale production of ZnO nano-wire arrays, Angew. Chem., Int. Ed. 42 (2003) 3031–3034.
[22] B.D. Yuhas, D.O. Zitoun, P.J. Pauzauskie, R. He, P. Yang, Transition-metal doped zinc oxide nanowires, Angew. Chem., Int. Ed. 45 (2006) 420–423.
[23] L.E. Greene, M. Law, D.H. Tan, M. Montano, J. Goldberger, G. Somorjai, P.D. Yang, General route to vertical ZnO nanowire arrays using textured ZnO seeds, Nano Lett. 5 (2005) 1231–1236.
[24] K. Govender, D.S. Boyle, P.B. Kenway, P.J. O’Brien, Understanding the factors that govern the deposition and morphology of thinfilms of ZnO from aqueous solution, Mater. Chem. 14 (2004) 2575–2591.
[25] H. Deyi, Z. Weili, G. Xiao, F. Yongming, H. Haoxuan, S. Jing, X. Lili, L. Baodan, X. Xinyu, High piezo-photocatalytic efficiency of CuS/ZnO nanowires using both solar and mechanical energy for degrading organic dye, ACS Appl. Mater. Int. 8 (2016) 21302–21314.
![Fig. 7. TEM and HR-TEM investigation with [002] spacing measurements for ZnO-3.](https://thumb-eu.123doks.com/thumbv2/9libnet/5650928.112602/7.892.125.770.667.974/fig-tem-hr-tem-investigation-spacing-measurements-zno.webp)

