PAPER
The role of positive and negative pressure on cavitation nucleation in
nanodroplet-mediated histotripsy
To cite this article: Eli Vlaisavljevich et al 2016 Phys. Med. Biol. 61 663
Manuscript version: Accepted Manuscript
Accepted Manuscript is “the version of the article accepted for publication including all changes made as a result of the peer review process, and which may also include the addition to the article by IOP Publishing of a header, an article ID, a cover sheet and/or an ‘Accepted Manuscript’ watermark, but excluding any other editing, typesetting or other changes made by IOP Publishing and/or its licensors” This Accepted Manuscript is © © 2016 Institute of Physics and Engineering in Medicine.
During the embargo period (the 12 month period from the publication of the Version of Record of this article), the Accepted Manuscript is fully protected by copyright and cannot be reused or reposted elsewhere.
As the Version of Record of this article is going to be / has been published on a subscription basis, this Accepted Manuscript is available for reuse under a CC BY-NC-ND 3.0 licence after the 12 month embargo period.
After the embargo period, everyone is permitted to use copy and redistribute this article for non-commercial purposes only, provided that they adhere to all the terms of the licence https://creativecommons.org/licences/by-nc-nd/3.0
Although reasonable endeavours have been taken to obtain all necessary permissions from third parties to include their copyrighted content within this article, their full citation and copyright line may not be present in this Accepted Manuscript version. Before using any content from this article, please refer to the Version of Record on IOPscience once published for full citation and copyright details, as permissions will likely be required. All third party content is fully copyright protected, unless specifically stated otherwise in the figure caption in the Version of Record. View the article online for updates and enhancements.
The Role of Positive and Negative Pressure on Cavitation Nucleation in
1
Nanodroplet-Mediated Histotripsy
2 3
Eli Vlaisavljevich1, Omer Aydin1, Kuang-Wei Lin1, Yasemin Yuksel Durmaz2, Brian Fowlkes1,3, Mohamed 4
ElSayed1,4*, Zhen Xu1,5* 5
6
1 - Department of Biomedical Engineering, University of Michigan, Ann Arbor, MI 7
2- Department of Biomedical Engineering, Schools of Engineering and Natural Science, Istanbul Medipol 8
University, Istanbul, Turkey 9
3 - Department of Radiology, University of Michigan, Ann Arbor, MI 10
4 - Macromolecular Science and Engineering Program, University of Michigan, Ann Arbor, MI 11
5 - Department of Pediatrics and Communicable Diseases, Division of Pediatric Cardiology, University of 12
Michigan, Ann Arbor, MI 13
14 15 16
*Corresponding Author: *Corresponding Author:
17
Mohamed E.H. ElSayed, Ph.D. Zhen Xu, Ph.D.
18
University of Michigan University of Michigan
19
Department of Biomedical Engineering Department of Biomedical Engineering 20
1101 Beal Avenue 2107 Carl A. Gerstacker Building
21
Lurie Biomedical Engineering Building 2200 Bonisteel Boulevard 22
Room 2150 Ann Arbor, MI 48109, USA
23
Ann Arbor, MI 48109, USA Phone: + 1 (734) 647-4961
24
Phone: + 1 (734) 615-9404 Fax: + 1 (734) 939-1905
25
Fax: + 1 (734) 647-4834 E-mail: [email protected]
26
E-mail: [email protected] Web:www.bme.umich.edu/labs/xulab/ 27 Web: www.bme.umich.edu/centlab.php 28 29 30 31 32 33 2 3 4 5 6 7 8 9 10 11 12 13 14 15 16 17 18 19 20 21 22 23 24 25 26 27 28 29 30 31 32 33 34 35 36 37 38 39 40 41 42 43 44 45 46 47 48 49 50 51 52 53 54 55 56 57 58
Abstract
1
Nanodroplet-mediated histotripsy (NMH) is an ultrasound ablation technique combining 2
histotripsy with acoustically sensitive perfluorocarbon (PFC) nanodroplets that can be selectively 3
delivered to tumor cells for targeted tumor ablation. NMH takes advantage of the significantly 4
reduced cavitation threshold of the nanodroplets, allowing for cavitation to be selectively generated 5
only in regions containing nanodroplets. Understanding the physical mechanisms underlying the 6
nanodroplet cavitation process is essential to the development of NMH. In this study, we 7
hypothesize that cavitation nucleation is caused by the negative pressure (p-) exposed to the PFC, 8
and the NMH cavitation threshold is therefore determined by the incident p- of the single-cycle 9
pulses commonly used in NMH. This paper reports the first study that separately investigates the 10
effects of negative and positive pressure on the NMH cavitation threshold using near half-cycle 11
ultrasound pulses with dominant negative (negative-polarity pulses) or positive (positive-polarity 12
pulses) pressure phases. Tissue phantoms containing perfluorohexane (PFH) nanodroplets were 13
exposed to negative-polarity and positive-polarity pulses generated by a frequency compounding 14
transducer recently developed in our lab, and the probability of generating cavitation was measured 15
as a function of peak negative (p-) and peak positive (p+) pressure. The results showed close 16
agreement in the p- cavitation threshold for PFH phantoms exposed to negative-polarity (11.4±0.1 17
MPa) and positive-polarity (11.7±0.2 MPa) pulses. The p+ at the cavitation threshold, in contrast, 18
was measured to be significantly different for the negative-polarity (4.0±0.1 MPa) and positive-19
polarity (42.6±0.2 MPa) pulses. In the final part of this study, the experimental results were 20
compared to the cavitation threshold predicted by classical nucleation theory (CNT), with results 21
showing close agreement between simulations and experiments. Overall, the results support our 22
hypothesis and provide significant insight into the physical mechanisms underlying NMH. 23
Keywords: Nanodroplet, histotripsy, ultrasound, nucleation, cavitation, acoustic droplet vaporization
24 2 3 4 5 6 7 8 9 10 11 12 13 14 15 16 17 18 19 20 21 22 23 24 25 26 27 28 29 30 31 32 33 34 35 36 37 38 39 40 41 42 43 44 45 46 47 48 49 50 51 52 53 54 55 56 57 58
Introduction
1
Histotripsy is a noninvasive tissue ablation method that controllably fractionates soft tissue 2
through cavitation generated by high pressure, short duration ultrasound pulses (Parsons et al., 3
2006a; Roberts et al., 2006; Xu et al., 2005). Histotripsy is currently being studied for many clinical 4
applications where non-invasive tissue removal is desired including benign prostatic hyperplasia 5
(Hempel et al., 2011), deep vein thrombosis (Maxwell et al., 2011), congenital heart disease 6
(Owens et al., 2011; Xu et al., 2010), fetal interventions (Kim et al., 2011; Kim et al., 2013), and 7
cancer (Styn et al., 2010; Vlaisavljevich et al., 2013b). Although histotripsy has shown promise for 8
many clinical applications including tumor ablation, this approach is limited to applications in 9
which the target tissue can be identified and imaged prior to treatment, which is often not feasible in 10
cancer patients with many small tumor nodules and micro-metastases. Histotripsy also requires very 11
high pressure (p->20MPa), which may not be achievable in some target tissues with limited acoustic 12
access. Due to these limitations, our group has recently developed a targeted ablation approach 13
combing polymer encapsulated nanodroplets with histotripsy (Vlaisavljevich et al., 2013a; Yuksel
14
Durmaz et al., 2014). Nanodroplet-mediated histotripsy (NMH) takes advantage of the significantly 15
reduced cavitation threshold of the nanodroplets, allowing for cavitation to be selectively generated 16
only in regions containing nanodroplets (Vlaisavljevich et al., 2013a). By synthesizing nanodroplets 17
in a size range (~100-400 nm) in which they can diffuse through the leaky tumor vasculature and 18
preferentially accumulate in the tumor, NMH has the potential for selective ablation of tumors 19
(Vlaisavljevich et al., 2013a; Yuksel Durmaz et al., 2014). Previous work has demonstrated that 20
NMH can be used to create well-defined ablation similar to histotripsy but at significantly lower 21
pressure and has the potential to be used for simultaneous multi-focal ablation (Vlaisavljevich et al., 22 2013a). 23 2 3 4 5 6 7 8 9 10 11 12 13 14 15 16 17 18 19 20 21 22 23 24 25 26 27 28 29 30 31 32 33 34 35 36 37 38 39 40 41 42 43 44 45 46 47 48 49 50 51 52 53 54 55 56 57 58
Understanding the physical mechanisms underlying the NMH cavitation process is essential 1
for the development of NMH therapy. Previous studies on acoustic droplet vaporization (ADV) 2
have shown that the ADV vaporization thresholds do not appear to follow the trends predicted by 3
classical nucleation theory (CNT), which predicts that cavitation will be nucleated inside the 4
droplets directly from the applied negative pressure (p-) (Arvengas et al., 2011; Caupin and Herbert, 5
2006; Fisher, 1948; Herbert et al., 2006; Kripfgans et al., 2004; Kripfgans et al., 2000; Schad and 6
Hynynen, 2010; Sheeran and Dayton, 2012; Williams et al., 2013). These studies have led to the 7
hypothesis that nanodroplet nucleation in ADV is caused by a different mechanism than what is 8
predicted by CNT, such as droplet deformation, hydrodynamic cavitation, or acoustic heating 9
(Kripfgans et al., 2004; Kripfgans et al., 2000; Sheeran and Dayton, 2012). However, these ADV 10
studies used larger droplets, higher frequency ranges, and pulses with more acoustic cycles than 11
those used in NMH therapy (Kripfgans et al., 2004; Kripfgans et al., 2000; Schad and Hynynen, 12
2010; Sheeran and Dayton, 2012; Vlaisavljevich et al., 2015a; Vlaisavljevich et al., 2015b; 13
Vlaisavljevich et al., 2013a; Williams et al., 2013; Yuksel Durmaz et al., 2014). Furthermore, 14
recent work reveals that the decrease in the ADV threshold at higher frequencies is due to 15
superharmonic focusing, which significantly increases the amplitude of the p- inside the droplet and 16
is enhanced at higher frequencies and in larger droplets (Li et al., 2014; Shpak et al., 2014). 17
Therefore, it is possible that ADV nucleation does in fact follow the predictions of CNT, once the 18
effects of pressure focusing are accounted for. 19
In NMH, cavitation bubbles are generated from nanodroplets <600 nm in diameter using 20
single-cycle ultrasound pulses at frequencies in the hundreds of kHz to low MHz range, resulting in 21
cavitation thresholds significantly higher than the vaporization thresholds previously measured for 22
ADV (Kripfgans et al., 2004; Vlaisavljevich et al., 2015a; Vlaisavljevich et al., 2015b; 23
Vlaisavljevich et al., 2013a; Yuksel Durmaz et al., 2014), with the trends appearing the follow the 24 2 3 4 5 6 7 8 9 10 11 12 13 14 15 16 17 18 19 20 21 22 23 24 25 26 27 28 29 30 31 32 33 34 35 36 37 38 39 40 41 42 43 44 45 46 47 48 49 50 51 52 53 54 55 56 57 58
predictions of CNT (Arvengas et al., 2011; Caupin and Herbert, 2006; Fisher, 1948; Herbert et al., 1
2006; Vlaisavljevich et al., 2015c). For example, previous work has demonstrated a significant 2
reduction in the histotripsy cavitation threshold for both perfluoropentane (PFP) and 3
perfluorohexane (PFH) nanodroplets exposed to single cycle histotripsy pulses (Kawabata et al., 4
2010; Maxwell et al., 2013; Vlaisavljevich et al., 2015a; Vlaisavljevich et al., 2015b; Vlaisavljevich 5
et al., 2015c). The NMH cavitation threshold decreases at lower frequencies (Vlaisavljevich et al., 6
2015a; Vlaisavljevich et al., 2015b), in contrast to the increasing ADV threshold with higher 7
frequency observed using micron sized droplets (Kripfgans et al., 2004; Kripfgans et al., 2000; 8
Schad and Hynynen, 2010; Williams et al., 2013). The NMH frequency dependence appears to 9
agree with CNT, which predicts that lower frequency will decrease the cavitation threshold due to 10
the longer duration of the applied p- and the larger focal zone at lower frequencies (Arvengas et al., 11
2011; Caupin and Herbert, 2006; Fisher, 1948; Herbert et al., 2006; Vlaisavljevich et al., 2015a; 12
Vlaisavljevich et al., 2015b; Vlaisavljevich et al., 2015c). Furthermore, a slight increase in the 13
NMH cavitation threshold has been observed for PFH nanodroplets compared to PFP droplets due 14
to the increase in the surface tension and boiling point of PFH, which also agrees with the 15
predictions of CNT (Arvengas et al., 2011; Caupin and Herbert, 2006; Fisher, 1948; Herbert et al., 16
2006; Vlaisavljevich et al., 2015a; Vlaisavljevich et al., 2015b; Vlaisavljevich et al., 2015c). 17
Based on these previous studies, we hypothesize that NMH bubbles are generated after 18
cavitation is nucleated inside the droplets directly from the incident p- (tensile portion of the 19
incident wave), similar to histotripsy bubbles generated without nanodroplets when the negative 20
pressure directly exceeds the intrinsic threshold (Maxwell et al., 2013; Vlaisavljevich et al., 2015c; 21
Lin et al., 2014a). In order to test this hypothesis, in this study we separate the effects of negative 22
and positive pressure on NMH cavitation nucleation using near half-cycle ultrasound pulses with 23
dominant negative (negative-polarity pulses) or positive (positive-polarity pulses) pressure phases. 24 2 3 4 5 6 7 8 9 10 11 12 13 14 15 16 17 18 19 20 21 22 23 24 25 26 27 28 29 30 31 32 33 34 35 36 37 38 39 40 41 42 43 44 45 46 47 48 49 50 51 52 53 54 55 56 57 58
This paper reports the first study that separately investigates the effects of negative and positive 1
pressure on the NMH cavitation process. The generation of near monopolar pulses was made 2
possible by using a frequency compounding transducer recently developed in our lab, which aligns 3
the positive or negative phases of multiple-frequency components while destructive interference 4
occurs elsewhere in space and time, leading to pulses with a single dominant negative or positive 5
pressure phase (Lin et al., 2014a). Tissue phantoms containing PFH nanodroplets and control 6
phantoms without droplets were exposed to negative-polarity and positive-polarity pulses, and 7
optical imaging was used to measure the NMH cavitation threshold as a function of peak negative 8
(p-) and peak positive (p+) pressure. The NMH cavitation threshold definition is similar to the 9
ADV threshold, with the difference being in the type of bubble that is generated from the 10
nanodroplets (i.e. transient cavitation bubble vs. stable ADV bubble). Finally, to help explain the 11
experimental results, CNT was used to theoretically investigate the expected cavitation thresholds 12
for samples with and without PFH nanodroplets, with the CNT results compared to the 13
experimentally observed thresholds. Overall, the results of this study will improve our 14
understanding of the physical mechanisms underlying the NMH cavitation process, which is 15
essential for the development of NMH therapy. 16
17
Methods
18
Nanodroplet Formulation and Characterization 19
Polymer encapsulated perfluorohexane (PFH, SynQuest Lab, > 98%) nanodroplets were 20
used for this study based on recent work demonstrating that PFH droplets have many benefits for 21
NMH therapy (Vlaisavljevich et al., 2015a). A PEG45-b-PAA12-b-P(HDFMA8-co-MMA20) triblock 22
copolymer was synthesized using a combination of atom transfer radical polymerization (ATRP) 23
and “click” coupling chemistry to prepare PFH-loaded nanodroplets following our published 24 2 3 4 5 6 7 8 9 10 11 12 13 14 15 16 17 18 19 20 21 22 23 24 25 26 27 28 29 30 31 32 33 34 35 36 37 38 39 40 41 42 43 44 45 46 47 48 49 50 51 52 53 54 55 56 57 58
method (Yuksel Durmaz et al., 2014). Formulation of PFH-loaded nanodroplets started by 1
dissolving the polymer in tetrahydrofuran (THF) (0.2% w/v) and cooling the solution down to 0oC 2
before adding PFH (2% v/v) while vigorously stirring the reaction mixture. An equal volume of 3
deionized water was added drop-wise to this solution to initiate micelle formation and the mixture 4
was stirred for 1 hour in an ice bath. The micelles solution was transferred to a dialysis bag 5
(MWCO of 1 KDa, Spectrum, Rancho Dominguez, CA) and dialyzed overnight against ice-cold 6
MES buffer solution (pH 5.5) to remove the THF solvent and get a milky solution of non-cross-7
linked PFH-loaded nanodroplets. The milky nanodroplets solution was transferred to a round 8
bottom flask and mixed with the 2,2`-(ethylenedioxy)-bis(ethylamine) cross-linker to react with the 9
carboxyl groups of the central PAA block in the polymer backbone via NHS/EDC coupling 10
chemistry forming cross-linked nanodroplets with a flexible polymer shell. Shell cross-linked 11
nanodroplets were dialyzed against ice-cold water for 12 hours to remove unreacted cross-linker 12
and reaction byproducts . 13
Concentration and size distribution of the nanodroplets were measured using Nanoparticle 14
Tracking Analysis (NTA). Briefly, the NanoSight™ LM10 (Malvern Instruments, Amesbury, UK), 15
equipped with a temperature-controlled 405 nm laser module, high sensitivity Scientific 16
Complementary Metal–Oxide–Semiconductor (sCMOS) camera (Hamamatsu, Orca, Hamamatsu 17
City, Japan), and a syringe pump was used for the collection of NTA data. Upon diluting the 18
nanodroplet solution to the appropriate particle concentration with deionized (DI) water (Thermo 19
Scientific, GenPure, Waltham, MA, USA), image capture and analysis was carried out using the 20
NTA software (Version 3.0, Build 0066, Malvern Instruments, Amesbury, UK) at 37°C. The 21
samples were measured by capturing 60s videos (5 videos per each sample). These values were 22
determined in order to collect sufficient data such that the shape of the histogram no longer changed 23
significantly with additional data (i.e. NTA analyzed hundreds or thousands of particles in order to 24 2 3 4 5 6 7 8 9 10 11 12 13 14 15 16 17 18 19 20 21 22 23 24 25 26 27 28 29 30 31 32 33 34 35 36 37 38 39 40 41 42 43 44 45 46 47 48 49 50 51 52 53 54 55 56 57 58
calculate a representative particle size distribution). Figure 1 is a representative plot showing the 1
size distribution of the PFH nanodroplets. The error bars represent the standard deviation of the 2
repeat measurements of each sample. The mean size and standard deviation values obtained by the 3
NTA software correspond to arithmetic values calculated with the sizes of all particles analyzed for 4
each sample (n=5). Results from all samples demonstrated that the average size of the nanodroplets 5
(NDs) was 233±3.9 nm with 10% of NDs have a diameter ≤ 135.3±2.6 nm, 50% of the NDs have a 6
diameter ≤ 192.7±5.3 nm, 90% of the NDs have a diameter ≤ 373.7±7.2 nm, and >99% of the NDs 7
are ≤ 600 nm. 8
9
Preparation of Tissue Phantoms 10
Agarose phantoms were used to provide a well-controlled viscoelastic medium for this 11
study. Tissue phantoms containing 1% agarose w/v were prepared by slowly mixing agarose 12
powder (Agarose Type VII; Sigma-Aldrich, St. Louis, MO, USA) into saline solution (0.9% sodium 13
chloride; Hospira, Lake Forest, Illinois, USA) heated to boiling temperature. The solution was 14
stirred on a hot plate until the gel turned completely transparent and then allowed to boil for ten 15
minutes. After boiling, solutions were allowed to cool and were degassed under a partial vacuum 16
(~20 kPa, absolute) for 30 minutes. After degassing, phantoms containing nanodroplets were 17
prepared by slowly adding the nanodroplets (2.0×10⁸ particles/ml) into the agarose solution while 18
stirring. The agarose mixtures were poured into polycarbonate holders and placed in a refrigerator at 19
4°C to allow the solution to solidify, forming tissue phantoms with embedded PFH nanodroplets 20
and without nanodroplets (control). Tissue phantoms containing PFH nanodroplets were assumed to 21
have a nearly uniform distribution of droplets throughout the phantom, which is supported by the 22
observations in previous NMH studies which showed similar cavitation thresholds and bubble 23
activity for treatments applied throughout all regions of these tissue phantoms (Vlaisavljevich et al., 24 2 3 4 5 6 7 8 9 10 11 12 13 14 15 16 17 18 19 20 21 22 23 24 25 26 27 28 29 30 31 32 33 34 35 36 37 38 39 40 41 42 43 44 45 46 47 48 49 50 51 52 53 54 55 56 57 58
2015b; Vlaisavljevich et al., 2013a; Yuksel Durmaz et al., 2014). The attenuation coefficients of the 1
agarose tissue phantoms with and without PFH droplets were measured to be <0.1 dB/cm for the 2
pulses used in this study. These values, along with the short propagation distance through the 3
phantom (<2 cm), suggest that attenuation from the tissue phantoms will have a negligible impact 4
on the reported pressure values which were measured in free field. 5
6
Histotripsy Pulse Generation 7
Histotripsy pulses with dominant negative (negative-polarity pulse) and positive (positive-8
polarity pulse) pressure phases were generated used a frequency compounding transducer, adapted 9
from a previous study (Lin et al., 2014a). The frequency-compounding transducer was composed of 10
12 elements (20 mm in diameter) with various resonant frequencies: 500 kHz (three elements), 1 11
MHz (two elements), 1.5 MHz (two elements), 2 MHz (two elements), and 3 MHz (three elements) 12
(Lin et al., 2014a). The elements had a common geometric focus at 40 mm and were populated in a 13
scaffold in a specific order to ensure that adjacent elements did not have the same frequency. This 14
was done to reduce nonlinear propagation effects that occur when acoustic waves of the same 15
frequency propagate closely in space and interfere constructively. Additionally, the frequency-16
compounding transducer has two diametrically opposed optical windows to allow for optical 17
imaging at the geometric focus. The design of the frequency compounding transducer has been 18
described in detail in a previous study (Lin et al., 2014a). 19
A custom high voltage pulser with 12 parallel channels was used to drive the frequency-20
compounding transducer. The pulser was connected to a field-programmable gated array (FPGA) 21
development board (Altera DE1, Terasic Technology, Dover, DE, USA) specifically programmed 22
for frequency compounding pulse generation. This setup allowed each element to individually 23
output short pulses with only one large negative or positive pressure phase. The generation of 24 2 3 4 5 6 7 8 9 10 11 12 13 14 15 16 17 18 19 20 21 22 23 24 25 26 27 28 29 30 31 32 33 34 35 36 37 38 39 40 41 42 43 44 45 46 47 48 49 50 51 52 53 54 55 56 57 58
negative-polarity pulses was achieved by adjusting the arrival times of individual frequency 1
components to allow their principal negative phase peaks to arrive at the focus of the transducer 2
concurrently (Fig.2A). In this situation, destructive interference occurs elsewhere in space and time, 3
leading to a diminution of the peak positive pressure of the combined ultrasound pulse (Fig.2A). 4
For the generation of positive-polarity pulses, the driver pulses for the individual elements were 5
inverted, resulting in ultrasound pulses with a single principal positive phase from each element. 6
The arrival times of individual frequency components were then adjusted to allow their principal 7
positive phase peaks to arrive at the focus concurrently (Fig.2B). 8
A fiber-optic probe hydrophone (FOPH) built in-house (Parsons et al., 2006b) was used to 9
calibrate and measure the acoustic output of the frequency-compounding transducer, with example 10
waveforms shown in Figure 2. For threshold experiments, the probability of cavitation (measured 11
by optical imaging) was plotted as a function of both the peak negative (p-) and peak positive (p+) 12
pressure. In order to determine the peak pressure values for the negative and positive polarity 13
pulses, 2D spatial pressure fields were directly measured using the FOPH in order to identify the 14
locations corresponding to the p- and p+ in the focal region. The ratio of p- to p+ measured for the 15
negative-polarity pulses in this location was between 2.9-3.7 for the pressure ranges used in this 16
study. For the positive-polarity pulses, the 2D spatial pressure fields measured by the FOPH 17
demonstrated the location of the p- in the focal region occurred ~0.5 mm away from the geometric 18
focus, while the location of the p+ remained near the geometric focus (Fig.3). This effect is due to 19
the temporal alignment of the principle peak positive peaks of the individual frequency components 20
at the geometric focus, which resulted in a near monopolar positive pulse at the geometric focus 21
with two low-negative-pressure lobes outside of the focal region. The ratio of p+ to p- for the 22
positive-polarity pulses was measured to be between 3.2-3.9 for the pressure ranges used in this 23
study using the p+ and p- measured at the maximum locations in the field. For the positive polarity 24 2 3 4 5 6 7 8 9 10 11 12 13 14 15 16 17 18 19 20 21 22 23 24 25 26 27 28 29 30 31 32 33 34 35 36 37 38 39 40 41 42 43 44 45 46 47 48 49 50 51 52 53 54 55 56 57 58
pulses, the pressure was directly measured up to the maximum output of the transducer, p-1
/p+=16.3/55.1 MPa. For the negative polarity pulses, the pressure at the focus could only be 2
directly measured up to p-/p+=21.5/7.6 MPa due to cavitation at the fiber tip at higher pressures. 3
The pressures above this value were estimated using a linear summation of the pressures measured 4
for individual elements, as outlined in previous studies (Lin et al., 2014a; Maxwell et al., 2013; 5
Vlaisavljevich et al., 2015c; Vlaisavljevich et al., 2015d). 6
7
Optical Imaging and Image Processing 8
High speed optical imaging was used to capture images of the focal zone after the 9
propagation of each pulse through the focus. The frequency compounding transducer was placed on 10
the bottom of a tank of degassed water, and a tissue phantom attached to a 3-axis motorized 11
positioning system was lowered into the focus of the transducer (Fig.4). A digital, 1.3-megapixel 12
CCD camera (PN: FL3-U3-13Y3M-C, Flea® 3, PointGrey, Richmond, BC, Canada) was positioned 13
perpendicularly to the frequency compounding transducer facing one of the transducer’s optical 14
windows (Fig.4). A Nikon 4X objective was attached to the camera with extension tubes to magnify 15
the image plane, giving the captured images a resolution of approximately 3.6 µm per pixel. A 16
pulsed white-light LED was placed on the diametrically-opposed optical window of the dual-17
frequency array transducer, which provided back-lit illumination. The cameras were triggered to 18
record one image after the passage of each pulse at a time point approximately corresponding to the 19
maximum bubble expansion. This time point was determined for the negative-polarity and positive-20
polarity pulses prior to experiments by changing the delay time on the camera to identify the time 21
corresponding to maximum bubble expansion, as described in previous studies (Vlaisavljevich et 22
al., 2015b; Vlaisavljevich et al., 2015c; Vlaisavljevich et al., 2015d). After acquisition, 23
shadowgraph images were converted from grayscale to binary by an intensity threshold determined 24 2 3 4 5 6 7 8 9 10 11 12 13 14 15 16 17 18 19 20 21 22 23 24 25 26 27 28 29 30 31 32 33 34 35 36 37 38 39 40 41 42 43 44 45 46 47 48 49 50 51 52 53 54 55 56 57 58
by the background intensity using image processing software (MATLAB, The Mathworks, Natick, 1
MA, USA), as described in a previous study (Maxwell et al., 2013). Bubbles were indicated as any 2
black regions greater than 5 pixels in diameter. By this criterion, the minimum resolvable bubble 3 radius was 9 μm. 4 5 NMH Cavitation Threshold 6
For cavitation threshold experiments, 100 pulses were applied inside each sample at each 7
pressure level at a pulse repetition frequency (PRF) of 0.5 Hz. The PRF was kept low to minimize 8
the possibility that cavitation from one pulse would change the probability of cavitation on a 9
subsequent pulse. In a previous study, it was demonstrated that cavitation during a pulse increased 10
the likelihood of cavitation on a following pulse for PRFs > 1 Hz, but this effect was not observed 11
for PRFs < 1 Hz (Maxwell et al., 2013). In addition to this low PRF, the phantom sample was 12
translated for each pulse by 1 mm transverse to the acoustic propagation direction in a 10 × 10 grid 13
in order to minimize the effects of cavitation damage to the nanodroplets from altering the 14
probability of cavitation. Using this method, each point in the tissue phantom was exposed to a 15
single pulse at a single pressure amplitude. For each pulse, cavitation was monitored using high 16
speed imaging, and the fraction of total pulses at a given pressure level (out of 100) for which 17
cavitation was detected was determined as the cavitation probability. 18
The probability of observing cavitation followed a sigmoid function, given by 19
𝑃(𝑝) = 1
2+ 𝑒𝑟𝑓 (
𝑝 − 𝑝𝑡
√2𝜎2 ) (𝐄𝟏)
where erf is the error function, pt is the pressure at which the probability pcav=0.5, σ is a variable 20
related to the width of the transition between pcav=0 and pcav=1, with ± σ giving the difference in 21
pressure from about pcav=0.15 to pcav=0.85 for the fit (Maxwell et al., 2013). The cavitation 22 2 3 4 5 6 7 8 9 10 11 12 13 14 15 16 17 18 19 20 21 22 23 24 25 26 27 28 29 30 31 32 33 34 35 36 37 38 39 40 41 42 43 44 45 46 47 48 49 50 51 52 53 54 55 56 57 58
threshold for each sample, pt, is defined as the pressure, p, corresponding to pcav=0.5 as calculated 1
by the curve fit. Curve fitting for all data sets was performed using an OriginLab curve fitting 2
program (OriginPro 9.1; OriginLab Corporation, Northampton, MA, USA). The fit curves for all 3
samples were analyzed statistically to determine whether the differences in the values of pt were 4
significantly different from each other. The standard errors for pt were estimated by a covariance 5
matrix using the delta method (Hosmer and Lemeshow, 1992). The curves were compared using a 6
two-sample t-test with statistic 𝑡 (𝑝𝑖𝑛𝑡1− 𝑝𝑖𝑛𝑡2, √𝑆𝐸12+𝑆𝐸
22) at a 95% confidence interval. Results 7
were considered statistically significant for p<0.05. Note that the standard error does not include the 8
uncertainty in absolute pressure from the hydrophone measurement, only the uncertainty in the fit, 9
because the values pt are relative. For each sample, the curves were analyzed as a function of both 10
positive and negative pressure, with the corresponding cavitation threshold values calculated as 11
pt(+) and pt(–), respectively. A sample size of 3 tissue phantoms was used for each experimental 12
condition (i.e. phantoms containing PFH nanodroplets or no nanodroplets exposed to negative-13
polarity or positive-polarity pulses). 14
15
Classical Nucleation Theory Simulation 16
A theoretical analysis was performed based on classical nucleation theory (CNT) in order to 17
theoretically investigate the expected cavitation thresholds (Arvengas et al., 2011; Caupin and 18
Herbert, 2006; Herbert et al., 2006; Pettersen et al., 1994). Previous studies using CNT suggest that 19
the cavitation threshold is dependent upon the properties of the media (i.e. temperature, surface 20
energy) as well as the spatial and temporal distribution of the applied p- (Arvengas et al., 2011; 21
Pettersen et al., 1994). In this study, CNT was used to calculate the theoretical cavitation thresholds 22
for samples with and without PFH nanodroplets. The CNT results were then compared to the 23
experimental thresholds measured for the near monopolar pulses used in this study as well as for 24 2 3 4 5 6 7 8 9 10 11 12 13 14 15 16 17 18 19 20 21 22 23 24 25 26 27 28 29 30 31 32 33 34 35 36 37 38 39 40 41 42 43 44 45 46 47 48 49 50 51 52 53 54 55 56 57 58
dual polarity pulses at frequencies ranging from 345 kHz to 3 MHz used in previous studies 1
(Vlaisavljevich et al., 2015c; Vlaisavljevich et al., 2015b). The threshold predicted by CNT, pCNT, 2 was calculated as 3
𝑝
𝐶𝑁𝑇= (
16𝜋𝛼3 3𝑘𝑏𝑇∗ln𝛤0𝑉𝑓𝜏𝑓ln 2)
0.5(𝐄𝟕)
4where α is the surface energy, kb is the Boltzmann’s constant, T is temperature in Kelvin, Γ0 is a 5
prefactor, Vf is the focal volume for a given frequency, and τf is the time the focal volume is above a 6
given pressure (Arvengas et al., 2011; Caupin and Herbert, 2006; Fisher, 1948; Herbert et al., 2006; 7
Pettersen et al., 1994). Γ0 was set to Γ0=1033 similar to previous work (Pettersen et al., 1994; 8
Vlaisavljevich et al., 2015c). Vf and τf were modified for each frequency with τf set to one fourth of 9
the acoustic period and Vf representing the volume of fluid exposed to the applied pressure. An 10
effective frequency of 1.8 MHz was used for the frequency compounding transducer, as calculated 11
based on the duration of the applied p- pressure cycle shown in Figure 2A. The values of Vf_water 12
were calculated from the -6 dB FWHM beam profiles of the transducers assuming an ellipsoidal 13
focus, and were 47.07 mm3, 7.89 mm3, 2.30 mm3, 0.072 mm3, and 1.04 mm3 for 345 kHz, 500 kHz, 14
1.5 MHz, 3 MHz, and the frequency compounding transducer (1.8 MHz), respectively. For 15
simulations of the cavitation threshold without droplets, the surface energy of water, αw, was set to 16
19 mN/m, ~25% of the macroscopic surface tension of water, based on previous work showing this 17
value provides a more reasonable agreement with experimentally observed cavitation thresholds 18
(Arvengas et al., 2011; Herbert et al., 2006; Vlaisavljevich et al., 2015c). 19
To theoretically investigate the cavitation threshold in phantoms containing PFH droplets, 20
the CNT simulation was modified to account for the lower surface energy of PFH, αPFH, which was 21
set to 11.9 mN/m to match the macroscopic surface tension of PFH (Hougham et al., 1999). In 22
addition, the PFH threshold simulation was corrected to account for only the volume of PFH within 23 2 3 4 5 6 7 8 9 10 11 12 13 14 15 16 17 18 19 20 21 22 23 24 25 26 27 28 29 30 31 32 33 34 35 36 37 38 39 40 41 42 43 44 45 46 47 48 49 50 51 52 53 54 55 56 57 58
the focal region. The volume of PFH in the focal region, Vf_PFH, was calculated by multiplying 1
Vf_water by the amount of PFH in a unit volume of water, as calculated from the particle 2
concentration and size distribution data shown in Figure 1. The resulting values of Vf_PFH were 0.31 3
mm3, 0.051 mm3, 0.015 mm3, 0.00046 mm3, and 0.0068 mm3 for 345 kHz, 500 kHz, 1.5 MHz, 3 4
MHz, and the frequency compounding transducer (1.8 MHz), respectively. 5
6
Results
7
NMH Cavitation Threshold: Negative-Polarity Pulse 8
In the first set of experiments, the histotripsy cavitation threshold was measured for agarose 9
tissue phantoms with and without PFH nanodroplets exposed to negative-polarity pulses (Fig.2A). 10
For both types of phantoms, cavitation bubbles were only observed on the high-speed camera once 11
a certain pressure threshold was exceeded (Fig.5), as seen in previous studies (Maxwell et al., 2013; 12
Vlaisavljevich et al., 2015a; Vlaisavljevich et al., 2015b; Vlaisavljevich et al., 2015c). As the 13
pressure was further raised above this threshold value, cavitation was observed in an increasingly 14
larger region of the focal area, forming well-defined histotripsy bubble clouds similar to those 15
observed in previous work using dual-polarity pulses at various frequencies (Maxwell et al., 2013; 16
Vlaisavljevich et al., 2015a; Vlaisavljevich et al., 2015b; Vlaisavljevich et al., 2015c; 17
Vlaisavljevich et al., 2015d). Plotting the probability of cavitation as a function of p- demonstrated 18
a significant decrease in pt(–) for tissue phantoms containing nanodroplets compared to control 19
phantoms (Fig.6A,B), with the p- threshold measured to be pt_(–) = 29.8±0.3 MPa, with σmean = 0.7 20
MPa for control phantoms without nanodroplets and pt(–) = 11.7±0.2 MPa, with σmean = 0.4 MPa for 21
PFH phantoms. These results closely matched the p- thresholds measured in previous studies using 22
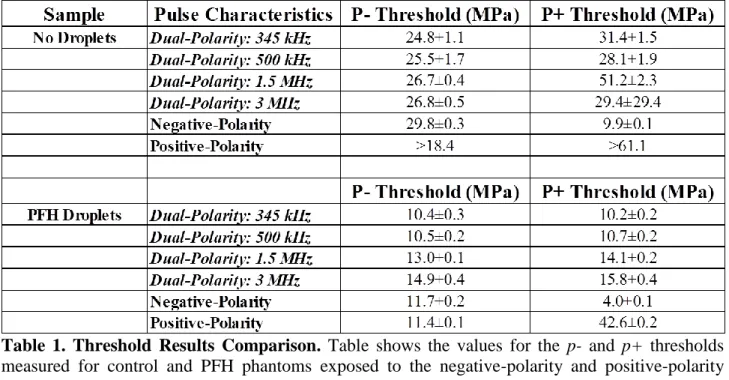
single-cycle dual-polarity pulses with center frequencies ranging from 345kHz to 3MHz (Table 1). 23
The single-cycle dual-polarity pulses commonly used in histotripsy studies contain both high 24 2 3 4 5 6 7 8 9 10 11 12 13 14 15 16 17 18 19 20 21 22 23 24 25 26 27 28 29 30 31 32 33 34 35 36 37 38 39 40 41 42 43 44 45 46 47 48 49 50 51 52 53 54 55 56 57 58
amplitude positive and negative pressure phases (Fig.2C). The p- thresholds for generating 1
cavitation previously measured with the dual-polarity pulse were 24 MPa–27 MPa without 2
nanodroplets and 10 MPa–15 MPa with PFH nanodroplets (Table 1) (Vlaisavljevich et al., 2015a; 3
Vlaisavljevich et al., 2015b; Vlaisavljevich et al., 2015c). Plotting the probability of cavitation for 4
the negative-polarity pulses as a function of p+ demonstrated a significant decrease in pt(+) for 5
tissue phantoms containing nanodroplets compared to control phantoms (Fig.7A,B), with the p+ 6
threshold measured to be pt_(+) = 9.9±0.1 MPa, with σmean = 0.2 MPa for control phantoms and pt(+) 7
= 4.0±0.1 MPa, with σmean = 0.2 MPa for PFH phantoms. The p+ threshold results measured for the 8
negative-polarity pulses were significantly different than the p+ thresholds measured in previous 9
studies using dual-polarity pulses, which ranged from pt(+) = 28.1 MPa–51.2 MPa and pt(+) = 10.2 10
MPa–15.8 MPa for control and PFH phantoms, respectively (Table 1). 11
12
NMH Cavitation Threshold: Positive-Polarity Pulse 13
In the second set of experiments, the histotripsy cavitation threshold was measured for tissue 14
phantoms with and without PFH nanodroplets exposed to positive-polarity pulses (Fig.2B). For 15
control phantoms without nanodroplets, cavitation bubbles were not consistently observed in the 16
focal region at any of the pressure levels tested (Fig.8). Plotting the probability of cavitation as a 17
function of p- (Fig.6C) and p+ (Fig.7C) for control phantoms without nanodroplets demonstrated 18
that the cavitation threshold was not reached even when the frequency compounding transducer was 19
driven at its maximum output pressure for the positive-polarity pulses (p-/p+=18.4/61.1 MPa). This 20
finding matched previous work studying the histotripsy intrinsic threshold which has shown that 21
cavitation is only generated when the p- is raised above the intrinsic threshold (~25-30 MPa) (Lin et 22
al., 2014a; Lin et al., 2014b; Maxwell et al., 2013; Vlaisavljevich et al., 2015c). 23 2 3 4 5 6 7 8 9 10 11 12 13 14 15 16 17 18 19 20 21 22 23 24 25 26 27 28 29 30 31 32 33 34 35 36 37 38 39 40 41 42 43 44 45 46 47 48 49 50 51 52 53 54 55 56 57 58
For PFH phantoms exposed to the positive-polarity pulses, cavitation was observed once a 1
certain pressure threshold was exceeded (Fig.8). However, cavitation did not occur at the geometric 2
focus of the transducer. Instead, the location of the cavitation was ~0.5 mm from the geometric 3
focus, closely matching the location in the field with the highest p- (Fig.3). As the pressure was 4
further increased above the NMH cavitation threshold, two separate regions containing cavitation 5
were observed in the PFH phantoms (Fig.7), with these locations closely corresponding to the two 6
regions of highest p- as measured by the FOPH (Fig.3). The probability of cavitation for PFH 7
phantoms exposed to positive-polarity pulses was plotted as a function of p- (measured at the 8
location corresponding to the highest p-), with the results demonstrating pt(–) = 11.4±0.1 MPa, with 9
σmean = 0.1 MPa (Fig.5D). This p- threshold closely matched the p- threshold for the negative-10
polarity pulses as well as the p- thresholds previously measured using dual-polarity pulses (Table 11
1). Plotting the probability of cavitation for PFH phantoms exposed to positive-polarity pulses as a
12
function of p+ resulted in a p+ threshold of pt(+) = 42.6±0.2 MPa, with σmean = 0.4 MPa (Fig.6D). 13
This p+ threshold was significantly different than the p+ thresholds measured for the negative-14
polarity pulses as well as the p+ thresholds previously measured for dual-polarity pulses (Table 1). 15
Figure 9 shows a comparison of the p- and p+ thresholds measured for PFH phantoms exposed to
16
the positive-polarity and negative polarity pulses generated in this study as well as dual-polarity 17
pulses at various frequencies (345 kHz–3MHz) measured in a previous study (Vlaisavljevich et al., 18
2015a), with results strongly suggesting that the NMH threshold is a function of the applied p-. 19
20
Classical Nucleation Theory Simulation 21
A theoretical analysis was performed based on classical nucleation theory (CNT) in order to 22
theoretically investigate the expected cavitation thresholds for phantoms with and without PFH 23
nanodroplets. Figure 10 shows pCNT compared with the average pt(–) measured for the near 24 2 3 4 5 6 7 8 9 10 11 12 13 14 15 16 17 18 19 20 21 22 23 24 25 26 27 28 29 30 31 32 33 34 35 36 37 38 39 40 41 42 43 44 45 46 47 48 49 50 51 52 53 54 55 56 57 58
monopolar pulses used in this study as well as for dual polarity pulses at frequencies ranging from 1
345 kHz to 3 MHz used in previous studies (Vlaisavljevich et al., 2015c; Vlaisavljevich et al., 2
2015b). The CNT results predicted a significant decrease in the cavitation threshold for phantoms 3
containing PFH nanodroplets, with the results closely matching the thresholds measured 4
experimentally (Fig.10). For example, the predicted p- cavitation threshold for PFH phantoms 5
exposed to the negative-polarity pulses used in this study was calculated to be pCNT_PFH = 12.4 MPa, 6
which was close to the experimental measured threshold of pt(–) = 11.7±0.2 MPa. The CNT results 7
also predicted a slight increase (~1-3 MPa) in pCNT with increasing frequency, once again matching 8
the trends observed experimentally (Fig.10). This slight increase in threshold at higher frequency is 9
due to the smaller focal zone and shorter duration of the applied p-. In fact, since bubbles are 10
generated directly from the single p- phase of the incident wave, the results of this study suggest 11
that it is more appropriate to use the duration of the applied p- as a metric to predict the probability 12
of generating cavitation from these single cycle pulses. The only significant deviation between the 13
experimental and CNT results was observed for phantoms without nanodroplets exposed to the 14
negative-polarity pulses, with the experimental results measuring a threshold ~3.5 MPa greater than 15
predicted by CNT. This difference is likely explained by inaccuracies in the reported pressure 16
values for high pressures (p->21.5), which were estimated using a linear summation of individual 17
elements as described in the Methods. 18
19
Discussion
20
In this work, we were able to generate pulses with dominant negative and positive pressure 21
phases, which allowed us to investigate the effects of positive and negative pressure on the NMH 22
cavitation threshold separately. The results supported our hypothesis that NMH bubbles are 23
generated after cavitation is nucleated inside the droplets directly from the incident p- (tensile 24 2 3 4 5 6 7 8 9 10 11 12 13 14 15 16 17 18 19 20 21 22 23 24 25 26 27 28 29 30 31 32 33 34 35 36 37 38 39 40 41 42 43 44 45 46 47 48 49 50 51 52 53 54 55 56 57 58
portion of the incident wave), similar to histotripsy bubbles generated without nanodroplets when 1
the p- directly exceeds the intrinsic threshold of the target media. Results showed close agreement 2
in the p- threshold for PFH phantoms exposed to negative-polarity (11.4±0.1 MPa), positive-3
polarity (11.7±0.2 MPa), and dual-polarity (10-15 MPa) pulses. The p+ thresholds, in contrast, were 4
measured to be significantly different for PFH phantoms exposed to negative-polarity (4.0±0.1 5
MPa), positive-polarity (42.6±0.2 MPa), and dual-polarity (10–16 MPa) pulses. These results 6
support our hypothesis that NMH cavitation is purely dependent upon the applied p-. This 7
hypothesis was further supported by the observation that exposing PFH phantoms to positive-8
polarity pulses resulted in cavitation only being generated in the regions with the highest p- (Fig.8), 9
as measured by the FOPH (Fig.3). 10
The results of this study provide significant insight into the nanodroplet nucleation process 11
and support the hypothesis that the nucleation in NMH can be explained by classical nucleation 12
theory (CNT). The ADV literature has hypothesized that droplet nucleation in ADV is caused by a 13
different mechanism than what is predicted by classical nucleation theory (CNT), based on previous 14
studies showing that the ADV threshold decreases with increasing frequency (Kripfgans et al., 15
2004; Kripfgans et al., 2000; Schad and Hynynen, 2010; Sheeran and Dayton, 2012; Williams et al., 16
2013). Many alternative mechanisms have been proposed to explain the discrepancy between the 17
trends predicted by CNT and the experimental trends observed for ADV including droplet 18
deformation, hydrodynamic cavitation, or acoustic heating (Kripfgans et al., 2004; Kripfgans et al., 19
2000; Sheeran and Dayton, 2012). The results of this study, however, suggest that the nucleation 20
process involved in NMH does in fact follow the mechanism described by CNT, which predicts that 21
cavitation is nucleated inside the droplets directly from the applied p-. These results suggest that 22
nanodroplets reduce the cavitation threshold by carrying a lower threshold medium, with the 23
probability of nucleation being a function of the p- exposed to the PFC. We think this theory can 24 2 3 4 5 6 7 8 9 10 11 12 13 14 15 16 17 18 19 20 21 22 23 24 25 26 27 28 29 30 31 32 33 34 35 36 37 38 39 40 41 42 43 44 45 46 47 48 49 50 51 52 53 54 55 56 57 58
also be extended to explain the nucleation mechanism for ADV using multi-cycle pulses and 1
various droplet sizes, as recent work has revealed that the decrease in the ADV threshold at higher 2
frequencies is due to superharmonic focusing, which significantly increases the amplitude of the p- 3
inside the droplet and is enhanced at higher frequencies and in larger droplets (Li et al., 2014; 4
Shpak et al., 2014). It is likely that the probability of nucleation in ADV will still follow the trends 5
predicted by CNT once the pressure focusing effects are accounted for. 6
Although the results of this work and previous ADV studies suggest that the same 7
nucleation process may be responsible in ADV and NMH, it is important to note that the resulting 8
bubble dynamics are significantly different in these two cases. For example, stable bubbles are 9
formed in ADV (Kripfgans et al., 2004; Kripfgans et al., 2000; Reznik et al., 2013; Reznik et al., 10
2011; Doinikov et al., 2014; Rapoport et al., 2011; Shpak et al., 2013) while NMH produces 11
cavitation bubbles that rapidly expand and then violently collapse (Kim et al., 2013; Vlaisavljevich 12
et al., 2015b; Vlaisavljevich et al., 2013a; Yuksel Durmaz et al., 2014). There are many factors 13
determining the resulting bubble behavior after nucleation, including the ultrasound pulse 14
parameters, initial droplet characteristics, and the properties of the surrounding microenvironment. 15
For example, the higher frequencies and multi-cycle pulses commonly used in ADV result in 16
oscillatory bubble growth, which allows ADV bubbles to stabilize (Reznik et al., 2013; Doinikov et 17
al., 2014). In contrast, NMH bubbles are exposed to a single large p- at lower frequencies, 18
producing bubbles that rapidly expand to sizes much larger (Rmax~10-150 μm) than those observed 19
for nanodroplet ADV (Rmax~1-10 μm), followed by the violent collapse of the NMH bubbles 20
(Reznik et al., 2013; Vlaisavljevich et al., 2015b; Vlaisavljevich et al., 2013a; Yuksel Durmaz et 21
al., 2014). In addition to the effects of ultrasound parameters, the resulting bubble behavior is 22
dependent upon the droplet properties (i.e. size, concentration, and PFC boiling point) (Reznik et 23
al., 2013; Reznik et al., 2011; Doinikov et al., 2014). Finally, the bubble behavior will also be 24 2 3 4 5 6 7 8 9 10 11 12 13 14 15 16 17 18 19 20 21 22 23 24 25 26 27 28 29 30 31 32 33 34 35 36 37 38 39 40 41 42 43 44 45 46 47 48 49 50 51 52 53 54 55 56 57 58
highly dependent upon the properties of the surrounding media including the temperature, Young’s 1
modulus, viscosity, surface tension, and gas concentration (Doinikov et al., 2014; Reznik et al., 2
2013; Reznik et al., 2011; Vlaisavljevich et al., 2015b; Vlaisavljevich et al., 2013a; Vlaisavljevich 3
et al., 2015d). It is therefore important to understand the impact of these properties on the resulting 4
bubble dynamics of ADV or NMH therapies, even though the underlying nucleation process is 5
likely the same for these two approaches. 6
The finding that the nanodroplet nucleation thresholds are determined by the applied p- and 7
exhibit a distinct threshold behavior is promising for the development of NMH. This distinct p- 8
threshold is dependent upon the droplet properties and can be changed by modulating droplet 9
composition (i.e. changing droplet surface tension to modulate the nucleation threshold) 10
(Vlaisavljevich et al., 2015a). With knowledge of the applied pressure fields and droplet 11
characteristics (i.e. size, composition, concentration), predictable and reliable NMH therapy 12
strategies can be developed. For example, the applied p- in NMH therapy must be chosen in the 13
region above the NMH threshold but below the histotripsy intrinsic threshold to ensure cavitation is 14
only generated in regions containing nanodroplets. This approach also suggests that NMH therapy 15
will share the same advantages of histotripsy treatments performed above the intrinsic threshold, 16
such as the generation of precise lesions matching the portion of the beam profile above the p- 17
threshold as well as the ability to manipulate bubble dynamics by changing the pulse parameters 18
(Lin et al., 2014b; Maxwell et al., 2013; Vlaisavljevich et al., 2015c; Vlaisavljevich et al., 2015d). 19
Furthermore, the sharp p- threshold behavior observed in this study suggests that generating 20
cavitation from nanodroplets is more predictable and reproducible than generating cavitation from 21
micron-sized air contrast agents, which do not require nucleation (i.e. phase transition) in order to 22
initiate the cavitation process and therefore do not show the same distinct threshold behavior 23
(Holland and Apfel, 1990; Miller and Thomas, 1995; Vlaisavljevich et al., 2015c). Overall, the 24 2 3 4 5 6 7 8 9 10 11 12 13 14 15 16 17 18 19 20 21 22 23 24 25 26 27 28 29 30 31 32 33 34 35 36 37 38 39 40 41 42 43 44 45 46 47 48 49 50 51 52 53 54 55 56 57 58
results of this study improve our understanding of the physical mechanisms underlying the 1
nanodroplet nucleation process, which will help to guide the development of NMH therapy. 2
3
Conclusion
4
In this work, the effects of positive and negative pressure on the NMH cavitation threshold 5
were investigated separately, with results supporting our hypothesis that the NMH cavitation 6
threshold is determined by the incident p-. Close agreement was observed for the p- thresholds 7
measured for PFH tissue phantoms exposed to negative-polarity (11.4±0.1 MPa) and positive-8
polarity (11.7±0.2 MPa) pulses. The p+ thresholds, in contrast, were significantly different for the 9
negative-polarity (4.0±0.1 MPa) and positive-polarity (42.6±0.2 MPa) pulses. Furthermore, the 10
positive-polarity pulse experiments demonstrated that cavitation was preferentially generated in the 11
regions with the largest p-. In the final part of this study, the experimental results were compared to 12
the cavitation thresholds predicted by classical nucleation theory (CNT), with results showing close 13
agreement between simulations and experiments. Overall, the results of this study support our 14
hypothesis that nanodroplet nucleation is determined by the applied p- and provide significant 15
insight into the physical mechanisms underlying the NMH process. 16
17
Acknowledgements
18
We would like to thank Sonja Capracotta, PhD (Technical Specialist, Nano Sight, School of 19
Public Health, University of Michigan) for her help on NTA size and concentration measurements. 20
This material is based upon work supported by a National Science Foundation Graduate Research 21
Fellowship to Eli Vlaisavljevich. Omer Aydin acknowledges the support of the Turkish Republic the 22
Ministry of National Education Fellowship Program (1416). This work was supported by a grant 23
from the United States Department of Defense (W81XWH-11-PCRP-ID). Disclosure notice: Drs. 24 2 3 4 5 6 7 8 9 10 11 12 13 14 15 16 17 18 19 20 21 22 23 24 25 26 27 28 29 30 31 32 33 34 35 36 37 38 39 40 41 42 43 44 45 46 47 48 49 50 51 52 53 54 55 56 57 58
Zhen Xu, Brian Fowlkes, and Kuang-Wei Lin have financial interests and/or other relationship with 1 HistoSonics Inc. 2 2 3 4 5 6 7 8 9 10 11 12 13 14 15 16 17 18 19 20 21 22 23 24 25 26 27 28 29 30 31 32 33 34 35 36 37 38 39 40 41 42 43 44 45 46 47 48 49 50 51 52 53 54 55 56 57 58
Figures
1 2
3
Figure 1. Nanodroplet characterization. Nanoparticle Tracking Analysis demonstrated PFH
4
nanodroplets had an average size of 233.9±3.9 nm. 5 6 2 3 4 5 6 7 8 9 10 11 12 13 14 15 16 17 18 19 20 21 22 23 24 25 26 27 28 29 30 31 32 33 34 35 36 37 38 39 40 41 42 43 44 45 46 47 48 49 50 51 52 53 54 55 56 57 58
1
2
Figure 2. Acoustic waveforms. Example of (A) negative-polarity and (B) positive-polarity pulses
3
produced by the frequency compounding transducer compared with a (C) dual-polarity pulse (500 4
kHz) previously used in NMH therapy. 5 6 7 8 2 3 4 5 6 7 8 9 10 11 12 13 14 15 16 17 18 19 20 21 22 23 24 25 26 27 28 29 30 31 32 33 34 35 36 37 38 39 40 41 42 43 44 45 46 47 48 49 50 51 52 53 54 55 56 57 58
1
Figure 3. Positive-polarity Pulse: Pressure Fields. 2D spatial pressure fields were measured by
2
the FOPH for a positive-polarity pulse. (A) Results demonstrated the location corresponding to the 3
highest positive pressure was near the geometric focus. (B) The location corresponding to the 4
highest negative pressure was ~0.5 mm away from the geometric focus in the axial direction. 5 6 7 2 3 4 5 6 7 8 9 10 11 12 13 14 15 16 17 18 19 20 21 22 23 24 25 26 27 28 29 30 31 32 33 34 35 36 37 38 39 40 41 42 43 44 45 46 47 48 49 50 51 52 53 54 55 56 57 58
1
Figure 4. Experimental set-up. Tissue phantoms with and without PFH nanodroplets were placed
2
at the focus of the frequency-compounding transducer (Lin et al., 2014a) for cavitation threshold 3
experiments. Cavitation was monitored using high-speed optical imaging through the transducer’s 4 optical windows. 5 6 2 3 4 5 6 7 8 9 10 11 12 13 14 15 16 17 18 19 20 21 22 23 24 25 26 27 28 29 30 31 32 33 34 35 36 37 38 39 40 41 42 43 44 45 46 47 48 49 50 51 52 53 54 55 56 57 58
1
Figure 5. Bubble Images: Negative-polarity Pulses. Optical Images of cavitation bubbles
2
generated from negative-polarity pulses inside (A) control phantoms and (B) PFH phantoms. 3 2 3 4 5 6 7 8 9 10 11 12 13 14 15 16 17 18 19 20 21 22 23 24 25 26 27 28 29 30 31 32 33 34 35 36 37 38 39 40 41 42 43 44 45 46 47 48 49 50 51 52 53 54 55 56 57 58
1
Figure 6. Cavitation Probability vs. Negative Pressure. Plots show the cavitation probability as a
2
function of negative pressure for (A,C) control and (B,D) PFH phantoms exposed to (A,B) 3
negative-polarity pulses and (C,D) positive-polarity pulses. The p- threshold measured for the 4
negative-polarity and positive-polarity pulses showed close agreement for PFH phantoms. 5
Cavitation couldn’t be generated in control phantoms exposed to positive-polarity pulses (Max p-6 =18.4 MPa). 7 8 2 3 4 5 6 7 8 9 10 11 12 13 14 15 16 17 18 19 20 21 22 23 24 25 26 27 28 29 30 31 32 33 34 35 36 37 38 39 40 41 42 43 44 45 46 47 48 49 50 51 52 53 54 55 56 57 58
1
Table 1. Threshold Results Comparison. Table shows the values for the p- and p+ thresholds
2
measured for control and PFH phantoms exposed to the negative-polarity and positive-polarity 3
pulses generated by the frequency compounding transducer along with the thresholds previously 4
measured using dual-polarity pulses at 345 kHz, 500 kHz, 1.5 MHz, and 3 MHz (Vlaisavljevich et 5
al., 2015a; Vlaisavljevich et al., 2015b; Vlaisavljevich et al., 2015c). Note: Italics represents data 6
taken from previous studies. 7 2 3 4 5 6 7 8 9 10 11 12 13 14 15 16 17 18 19 20 21 22 23 24 25 26 27 28 29 30 31 32 33 34 35 36 37 38 39 40 41 42 43 44 45 46 47 48 49 50 51 52 53 54 55 56 57 58
1
Figure 7. Cavitation Probability vs. Positive Pressure. Plots show the cavitation probability as a
2
function of positive pressure for (A,C) control and (B,D) PFH phantoms exposed to (A,B) negative-3
polarity pulses and (C,D) positive-polarity pulses. A significant increase in the p+ threshold was 4
observed for both control and PFH phantoms exposed to the positive-positive polarity pulses. 5 6 2 3 4 5 6 7 8 9 10 11 12 13 14 15 16 17 18 19 20 21 22 23 24 25 26 27 28 29 30 31 32 33 34 35 36 37 38 39 40 41 42 43 44 45 46 47 48 49 50 51 52 53 54 55 56 57 58
1
2
Figure 8. Bubble Images: Positive-polarity Pulses. Optical Images of cavitation bubbles
3
generated from positive-polarity pulses inside (A) control phantoms and (B) PFH phantoms. Arrows 4
on the plot indicate the locations in the focal region corresponding to the highest positive (p+) and 5
negative (p-) pressures as measured by the FOPH (Fig.3). Dashed lines correspond to the 6
approximate regions with a p- above ~12 MPa (Fig.3). 7 8 9 10 2 3 4 5 6 7 8 9 10 11 12 13 14 15 16 17 18 19 20 21 22 23 24 25 26 27 28 29 30 31 32 33 34 35 36 37 38 39 40 41 42 43 44 45 46 47 48 49 50 51 52 53 54 55 56 57 58
1
2
Figure 9. NMH Threshold Results Comparison. Plot compares the p- and p+ thresholds
3
measured for PFH phantoms in this study (negative-polarity and positive-polarity pulses) with the 4
thresholds previously measured using dual-polarity pulses (f=345kHz, 500kHz, 1.5MHz, 3 MHz) 5
(Vlaisavljevich et al., 2015a). Results suggest NMH cavitation is generated directly from the p- of 6
the incident wave. 7 8 9 10 11 2 3 4 5 6 7 8 9 10 11 12 13 14 15 16 17 18 19 20 21 22 23 24 25 26 27 28 29 30 31 32 33 34 35 36 37 38 39 40 41 42 43 44 45 46 47 48 49 50 51 52 53 54 55 56 57 58
1
2
Figure 10. CNT Simulation. Classical nucleation theory was used to predict the cavitation
3
thresholds for histotripsy pulses applied to phantoms with and without PFH nanodroplets. Results 4
showed close agreement between the CNT simulation and the experimentally measured thresholds. 5
Note that the waveforms produced by the frequency compounding transducer are plotted as an 6
effective frequency of 1.8 MPa. 7 8 9 10 11 12 2 3 4 5 6 7 8 9 10 11 12 13 14 15 16 17 18 19 20 21 22 23 24 25 26 27 28 29 30 31 32 33 34 35 36 37 38 39 40 41 42 43 44 45 46 47 48 49 50 51 52 53 54 55 56 57 58
References
1
Arvengas A, Davitt K and Caupin F 2011 Fiber optic probe hydrophone for the study of acoustic 2
cavitation in water Rev Sci Instrum 82 034904 3
Caupin F and Herbert E 2006 Cavitation in water: a review Comptes Rendus Physique 7 1000-17 4
Doinikov A A, Sheeran P S, Bouakaz A and Dayton P A 2014 Vaporization dynamics of volatile 5
perfluorocarbon droplets: a theoretical model and in vitro validation Med Phys 41 102901 6
Fisher J C 1948 The Fracture of Liquids Journal of Applied Physics 19 1062-7 7
Hempel C R, Hall T L, Cain C A, Fowlkes J B, Xu Z and Roberts W W 2011 Histotripsy 8
fractionation of prostate tissue: local effects and systemic response in a canine model J Urol 9
185 1484-9
10
Herbert E, Balibar S and Caupin F 2006 Cavitation pressure in water Phys Rev E Stat Nonlin Soft 11
Matter Phys 74 041603 12
Holland C K and Apfel R E 1990 Thresholds for transient cavitation produced by pulsed ultrasound 13
in a controlled nuclei environment J Acoust Soc Am 88 2059-69 14
Hosmer D W and Lemeshow S 1992 Confidence interval estimation of interaction Epidemiology 3 15
452-6 16
Hougham G, Cassidy P E, K. J and Davidson T 1999 Fluoropolymers 2: Properties: Kluwer 17
Academic Publishers 18
Kawabata K, Asami R, Axuma T and Umemura S 2010 Acoustic response of microbubbles derived 19
from phase-change nanodroplet. Jpn J Appl Phys 20
Kim Y, Gelehrter S K, Fifer C G, Lu J C, Owens G E, Berman D R, Williams J, Wilkinson J E, Ives 21
K A and Xu Z 2011 Non-invasive pulsed cavitational ultrasound for fetal tissue ablation: 22
feasibility study in a fetal sheep model Ultrasound in Obstetrics & Gynecology 37 450-7 23
Kim Y H, Fifer C G, Gelehrter S K, Owens G E, Berman D R, Vlaisavljevich E, Allen S P, Ladino-24
Torres M F and Xu Z 2013 Developmental Impact and Lesion Maturation of Histotripsy-25
Mediated Non-Invasive Tissue Ablation in a Fetal Sheep Model Ultrasound in Medicine and 26
Biology 39 1047-55 27
Kripfgans O D, Fabiilli M L, Carson P L and Fowlkes J B 2004 On the acoustic vaporization of 28
micrometer-sized droplets J Acoust Soc Am 116 272-81 29
Kripfgans O D, Fowlkes J B, Miller D L, Eldevik O P and Carson P L 2000 Acoustic droplet 30
vaporization for therapeutic and diagnostic applications Ultrasound Med Biol 26 1177-89 31
Li D S, Kripfgans O D, Fabiilli M L, Brian Fowlkes J and Bull J L 2014 Initial nucleation site 32
formation due to acoustic droplet vaporization Appl Phys Lett 104 063703 33
Lin K W, Hall T L, McGough R J, Xu Z and Cain C A 2014a Synthesis of monopolar ultrasound 34
pulses for therapy: the frequency-compounding transducer IEEE Trans Ultrason Ferroelectr 35
Freq Control 61 1123-36 36
Lin K W, Kim Y, Maxwell A D, Wang T Y, Hall T L, Xu Z, Fowlkes J B and Cain C A 2014b 37
Histotripsy beyond the intrinsic cavitation threshold using very short ultrasound pulses: 38
microtripsy IEEE Trans Ultrason Ferroelectr Freq Control 61 251-65 39
Maxwell A D, Cain C A, Hall T L, Fowlkes J B and Xu Z 2013 Probability of cavitation for single 40
ultrasound pulses applied to tissues and tissue-mimicking materials Ultrasound Med Biol 39 41
449-65 42
Maxwell A D, Owens G, Gurm H S, Ives K, Myers D D, Jr. and Xu Z 2011 Noninvasive treatment 43
of deep venous thrombosis using pulsed ultrasound cavitation therapy (histotripsy) in a 44
porcine model J Vasc Interv Radiol 22 369-77 45
Miller D L and Thomas R M 1995 Ultrasound contrast agents nucleate inertial cavitation in vitro 46
Ultrasound Med Biol 21 1059-65 47 2 3 4 5 6 7 8 9 10 11 12 13 14 15 16 17 18 19 20 21 22 23 24 25 26 27 28 29 30 31 32 33 34 35 36 37 38 39 40 41 42 43 44 45 46 47 48 49 50 51 52 53 54 55 56 57 58