CHANGES IN FMRI RESTING STATE
NETWORKS DUE TO AUDIOVISUAL
ASSOCIATION INDUCED EFFECTS ON
VISUAL MOTION PERCEPTION
a thesis submitted to
the graduate school of engineering and science
of bilkent university
in partial fulfillment of the requirements for
the degree of
master of science
in
neuroscience
By
Fazilet Zeynep Yıldırım
July 2016
Changes in fMRI Resting State Networks due to Audiovisual Associa-tion Induced Effects on Visual MoAssocia-tion PercepAssocia-tion
By Fazilet Zeynep Yıldırım July 2016
We certify that we have read this thesis and that in our opinion it is fully adequate, in scope and in quality, as a thesis for the degree of Master of Science.
Hacı Hulusi Kafalıg¨on¨ul(Advisor)
Aaron Michael Clarke
Nihal Apaydın
Approved for the Graduate School of Engineering and Science:
Levent Onural
ABSTRACT
CHANGES IN FMRI RESTING STATE NETWORKS
DUE TO AUDIOVISUAL ASSOCIATION INDUCED
EFFECTS ON VISUAL MOTION PERCEPTION
Fazilet Zeynep Yıldırım M.S. in Neuroscience Advisor: Hacı Hulusi Kafalıg¨on¨ul
July 2016
Associative learning, the process by which an association between two stimuli or a behavior and a stimulus is learned, is one of today’s exciting and important topics of neuroscience. The influence of multisensory associations on perceptual experience has revealed unexpected levels of sensory plasticity in the adult brain. By using an audiovisual association paradigm, we designed experiments to assess motion perception and BOLD activity under various associative learning con-ditions. Eleven subjects (3 males) participated in the audiovisual association training followed by resting state fMRI scans. Before and after the association training, random-dot motion with varying coherence values and static tones of distinct frequencies were presented. Subjects were required to indicate the direc-tion of random-dot modirec-tion. During the associadirec-tion phase, random-dots moving up or down with 100% coherence was paired with either high or low frequency static tone. The behavioral data showed that the perception of random-dot mo-tion with low coherence was significantly changed in favor of exposed audiovisual association. The analyses on resting state functional data indicated that identi-fied canonical networks (i.e., visual, auditory, sensory, motor, executive, memory, and default mode) did not differ significantly between pre- and post- associa-tion training, and inter-hemispheric coherence values between early stage visual motion areas were not increased. On the other hand, the connectivity strength between auditory and visual networks increased significantly after the acquired audiovisual association. Accordingly, these findings suggest that even brief as-sociation training can lead to changes in connectivity between low-level sensory areas.
Keywords: Multisensory association, resting state, functional connectivity, mo-tion discriminamo-tion, sensory plasticity.
¨
OZET
C
¸ OKLU-DUYUMLU C
¸ A ˘
GRIS
¸IMSAL ¨
O ˘
GRENMEN˙IN
HAREKET ALGISINI ETK˙ILEMES˙IYLE ˙IS
¸LEVSEL
A ˘
GLARDA OLUS
¸AN DE ˘
G˙IS
¸ ˙IMLER
Fazilet Zeynep Yıldırım
N¨orobilim Lisans¨ust¨u Programı, Y¨uksek Lisans Tez Danı¸smanı: Hacı Hulusi Kafalıg¨on¨ul
Temmuz 2016
C¸ a˘grı¸sım yoluyla ¨o˘grenme, yani iki uyaran veya bir uyaran ile bir davranı¸sın bir-birini ¸ca˘grı¸stırması, bug¨un sinirbilimin ¸cok¸ca ara¸stırılan konularından birisidir. Ara¸stırmalar ¸coklu-duyumlu ¸ca˘grı¸sımların, algıya etki ederek yeti¸skin beyninde ¨
onemli miktarda algısal plastikli˘ge yol a¸ctı˘gını g¨ostermektedir. Bu ¸calı¸smada g¨orsel-i¸sitsel ¸ca˘grı¸sımsal ¨o˘grenme paradigması kullanarak hareket algısını ve hemodinamik aktivasyon de˘gi¸simlerini ¨ol¸ct¨uk. On bir katılımcı (3 erkek) g¨ orsel-i¸sitsel ¸ca˘grı¸sımsal ¨o˘grenme (davranı¸ssal) ve dinlenim i¸slevsel MR g¨or¨unt¨uleme deneylerine katıldı. C¸ a˘grı¸sımsal ¨o˘grenme fazından ¨once ve sonra katılımcılara rastgele-nokta hareketleri ve statik sesler sunulmu¸stur. Katılımcılar rastgele-nokta hareketlerinin y¨on¨un¨u (a¸sa˘gı veya yukarı) klavye tu¸slarına basarak be-lirtmi¸slerdir. C¸ a˘grı¸sımsal ¨o˘grenme fazında 100% uyumlulukla yukarı veya a¸sa˘gı hareket eden noktalar y¨uksek veya al¸cak frekanslı statik seslerle e¸sle¸stirilmi¸stir. Davranı¸ssal veri analizleri d¨u¸s¨uk uyumlulukla hareket eden noktaların hangi y¨one gitti˘gi algısının g¨orsel-i¸sitsel ¸ca˘grı¸sımsal ¨o˘grenme fazından ¨onemli ¨ol¸c¨ude etk-ilendi˘gini g¨ostermi¸stir. Dinlenim iMRG veri analizleri ¸ca˘grı¸sımsal ¨o˘grenmenin, hareket algısını i¸sleyen erken g¨orsel alanlarda yarık¨ureler arası bir uyumluluk artı¸sına veya kabul g¨orm¨u¸s i¸slevsel a˘glarda (g¨orsel, i¸sitsel, algı-motor, y¨ur¨utme, bellek, ve temel mod) herhangi bir aktivasyon farkına yol a¸cmadı˘gını g¨ostermi¸stir. Ancak i¸sitsel ve g¨orsel i¸slevsel a˘glar arasındaki ba˘glantı g¨uc¨un¨un kaydade˘ger bir ¸sekilde arttı˘gı g¨ozlemlenmi¸stir. Bu bulgular, kısa ¸ca˘grı¸sımsal ¨o˘grenme periyotlarının dahi erken algı alanları arasındaki ba˘glantıya etki edebilece˘gini ¨
onermektedir.
Anahtar s¨ozc¨ukler : C¸ oklu-duyumlu ¸ca˘grı¸sım, dinlenim iMRG, i¸slevsel ba˘glantısallık, hareket algısı, algısal plastiklik.
Acknowledgement
First of all, I would like to express my deepest gratitude to Asst. Prof. Dr. H. Hulusi Kafalıg¨on¨ul for being a great advisor in the path I chose. I was inspired how he was dedicated to his studies even at his difficult times.
I would also like to acknowledge Asst. Prof. Dr. Aaron M. Clarke and Prof. Dr. Nihal Apaydın as the other readers of this thesis, and I am gratefully indebted to them for their very valuable comments.
I am thankful for the warm and supportive environment of all UMRAM family, my labmates and dearest friends Utku Kaya, Toygan Kılı¸c, Cansu ¨O˘g¨ulm¨u¸s, Ay¸senur Karaduman and Can Oluk, for their intellectual and emotional sup-port. I also want to thank Pınar Demirayak, Zahide Pamir, and Arzu Ceylan Has for their guidance in the course of my thesis. I appreciate the contributions and patience of all.
My sincerest thanks to my dearest friends, Bahar S¸ahin, Beg¨un Erbaba, and Elif T. Karo˘glu, who made me smile and helped me through my difficult times.
Finally, I must express my very profound gratitude to my sisters, Ay¸senur and Hilal Yıldırım, and my mother, Dr. Fatma Yıldırım, for providing me with endless support and continuous encouragement throughout my life and through the process of writing this thesis. This accomplishment would not have been possible without them.
This work was supported by The Scientific and Technological Council of Turkey through 2236 Co-Funded Brain Circulation Fellowship (T ¨UB˙ITAK 112C010).
Contents
1 Introduction 1
1.1 Associative Learning . . . 1
1.2 The Effects of Associations on Visual Perception . . . 3
1.3 Multisensory Associations and Visual Motion Perception . . . 6
1.4 Neural Substrates within the context of Visual Motion Hierarchy . 9 1.5 Learning Dependent Resting State Functional Activity . . . 12
1.6 Current Study and Specific Aims . . . 15
2 Behavioral Training and Perceptual Changes 19 2.1 Method . . . 20
2.1.1 Participants . . . 20
2.1.2 Apparatus and Stimuli . . . 20
2.1.3 Procedure . . . 22
CONTENTS vii
2.2 Results . . . 25
3 Functional Imaging Protocol and Results 29 3.1 Methods . . . 30
3.1.1 Participants . . . 30
3.1.2 Apparatus . . . 30
3.1.3 Structural MR Imaging . . . 30
3.1.4 Functional MR Imaging . . . 31
3.2 Imaging Data Analyses . . . 31
3.2.1 Image pre-processing . . . 31
3.2.2 Independent component analysis . . . 32
3.2.3 ROI-based analysis . . . 36
3.2.4 Network Modelling . . . 37
3.3 Results . . . 39
3.3.1 Network strength changes . . . 39
3.3.2 Inter-hemispheric Functional Coherence Analysis . . . 43
3.3.3 Correlation Analysis Between Networks . . . 44
4 General Discussion 48 4.1 Summary of Results . . . 48
CONTENTS viii
4.1.1 Discussion: Behavioral Results . . . 48 4.1.2 Discussion: Functional Connectivity Results . . . 50 4.1.3 Multisensory Associative Learning and Its Relevance to
Functional Connectivity Research . . . 53 4.2 Future Directions . . . 54 4.3 Conclusions . . . 57
Bibliography 58
List of Figures
1.1 Experimental design for the cue recruitment paradigm [1]. . . 4
1.2 Visual stimuli and experimental paradigm for association learning [2]. 5 1.3 Experimental design for the study of Teramoto et al. [3]. . . 7
1.4 Sound-contingent visual motion aftereffects: experimental design and behavioral results from the study of Hidaka et al. [4]. . . 8
1.5 Selectivity of an hMT+ neuron following an association task [2]. . 10
1.6 Experimental design and association paradigm [5]. . . 12
1.7 Parameter estimates from ROI analyses. . . 17
1.8 Behavioral and functional data results (n=11). . . 18
2.1 Experiment outline. . . 20
2.2 Random-dot stimulus diagram for three levels of coherence. . . 22
2.3 Representative trial sequence for two-alternative test and associa-tion phase. . . 23
LIST OF FIGURES x
2.4 Results of behavioral experiments. Group averaged data (n = 11)
for different experimental conditions. . . 26
2.5 The averaged PSE shifts (in units of motion coherence level) across all observers as a function of test phase. . . 28
2.6 The averaged response change (n =11) for the 0.05 coherence level as a function of test phase. . . 28
3.1 Experiment outline. . . 29
3.2 Diagram for temporal concatenation group-ICA . . . 33
3.3 PICA-estimated resting state patterns from [6]. . . 34
3.4 Mean tensor-PICA estimated resting state patterns from [7]. . . . 35
3.5 Dual-regression analysis representation [8]. . . 35
3.6 Non-parametric permutation based analysis representation [8]. . . 36
3.7 Right (A) and left (B) hMT+ masks. . . 37
3.8 Steps in resting state network modelling [9]. . . 38
3.9 Estimated resting state networks with a multi-session temporal concatenation method from group averaged data (for 25 compo-nents ICA): sagittal, coronal, and axial view of spatial map for each component. . . 40
3.10 Changes in network strength between pre- and post-association sessions (ICA-25c). . . 41
3.11 BOLD signal intensity time-courses for eight networks of observer S6. . . 42
LIST OF FIGURES xi
3.12 Inter-hemispheric coherence within the middle temporal region. . 44
3.13 The heat map (correlation coefficients) between the time series of all independent component analyses. . . 45
3.14 Univariate two samples t-test. . . 46
3.15 Between network connectivity analysis. . . 47
A.1 S1-Pre-test . . . 73
A.2 S1-Post-test after fourth training . . . 73
A.3 S2-Pre-test . . . 74
A.4 S2-Post-test after third training . . . 74
A.5 S3-Pre-test . . . 75
A.6 S3-Post-test after second training . . . 75
A.7 S4-Pre-test . . . 76
A.8 S4-Post-test after third training . . . 76
A.9 S5-Pre-test . . . 77
A.10 S5-Post-test after third training . . . 77
A.11 S6-Pre-test . . . 78
A.12 S6-Post-test after second training . . . 78
A.13 S7-Pre-test . . . 79
LIST OF FIGURES xii
A.15 S8-Pre-test . . . 80
A.16 S8-Post-test after third training . . . 80
A.17 S9-Pre-test . . . 81
A.18 S9-Post-test after second training . . . 81
A.19 S10-Pre-test . . . 82
A.20 S10-Post-test after second training . . . 82
A.21 S11-Pre-test . . . 83
List of Tables
Chapter 1
Introduction
”A science of the mind must reduce ... complexities (of behavior) to their ele-ments. A science of the brain must point out the functions of its eleele-ments. A science of the relations of mind and brain must show how the elementary ingre-dients of the former correspond to the elementary functions of the latter.”
William James [10]
1.1
Associative Learning
Associative learning is a type of conditioning which states that two stimuli, or a stimulus and a behavior, or two experiences reinforce each other in the process of learning, and are grouped together into one associative memory. The most prominently known forms of conditioning are classical (Pavlovian) and operant conditioning, which is distinguished from Pavlovian conditioning by its use of reinforcement or punishment to change an action-outcome association [11]. The benefits of associative learning are exploited in a wide range of fields. In daily life, we associate an eyebrow with the rest of the face, thus it becomes harder to recall what an eyebrow looks like if everything except that eyebrow is obscured. In education, associative learning can be a powerful teaching tool that helps students
to learn information with more accuracy. Learning by association is important for many processes, including motor actions, physiological body responses, emotional reactions, reasoning, and many other psychological concepts [1].
Another important function of associative learning is inducing sensory plastic-ity within adult’s brain. Hubel and Wiesel [12] conducted first studies on sensory plasticity and found that there is a critical period for organization of the visual system. Originated from the first sensory plasticity studies [12], researchers de-bate that sensory plasticity in post-ontogenetic adult’s brain is limited compared to post-natal development stages [13]. However, contemporary work suggests that cortical regions are distinctive in ways of learning they represent, not in their ca-pacity to undergo learning-dependent change [14], consistent with Thorndike’s theory of associative learning [15]. In connection with this, one study demon-strated that after a training period, in which monkeys learned to associate two visual stimuli, inferotemporal (IT) cortex neurons, which were not responsive before the learning, become selectively activated in the presence of associated stimulus [16] as cited in [17]. Another study reached similar results: McIntosh et al. [18] showed that following an association training between a particular sound and visual stimulus, auditory stimulus in isolation induced neural activity in left dorsal occipital cortex. These studies are important for elucidating how nervous system functions as a cohesive network in learning process.
The history of associative learning traces back to the very first articles about vision in attempt to explain perception [19]. Thorndike [15] proposed a theory for associative learning opposing the classical idea, which claimed learning one dis-cipline would improve one’s ability to learn any other disdis-cipline. He stated that learning transfer between disciplines was only possible to the degree to which they shared common properties. Despite of its deep rooted history, associative learning did not attract the attention it deserved when the behaviorism became widespread during 1950s because early classical conditioning studies were focused on the improvements in discrimination ability rather than the associations [20]. In these earliest experiments, associative learning was not considered a form of per-ceptual learning. Gibson and his colleagues attributed such learning to perper-ceptual system’s high level of sophistication: perception was not influenced by classical
conditioning because perception cannot be oversimplified to simple stimulus-to-response mappings [1]. In his paper, Rescorla [21] defied this argument suggesting that associative learning played an important role in changes at the neuronal level. Recent studies supported this suggestion. By using a cue recruitment method, Haijiang and his colleagues [1] provided the information that associative learning was in fact a form of perceptual learning. They found that an arbitrary signal can be engaged by the visual system as a cue for biasing visual appearance of an object (for more information see section 1.2). Hence, associations can be more useful than it was previously thought in constructing perception.
After establishing the perceptual ground for associative learning, the question of how associative learning is accomplished in the brain remains to be elucidated. A neural basis for associative learning was suggested by William James during nineteenth century [10]. In the Jamesian hypothesis, it is suggested that there are parallel visual information processing channels for different stimuli, and the flow of information through these channels are mostly feedforward. Moreover, theory suggests that there are also lateral connections between these different channels that are engaged in the crosstalk. Normally, for a stimulus A there is a selective channel A, and for a stimulus B there is a selective channel B in the visual system. Then, through training (or any learning paradigm) a person learns to associate (crosstalk) stimulus A with stimulus B. Thus, as A and B become associated, neurons initially responding selectively to one of these stimuli will be activated as well by the associated stimulus through strengthening of connections between channels. The neural mechanisms for associative learning is explored more in later sections.
1.2
The Effects of Associations on Visual
Per-ception
The influence of associative learning on perceptual experience has been recently highlighted in the modern literature [22]. A recently conducted study examined
the role of cue recruitment, a form of associative learning, on visual perception [1]. Observers were presented movies of a rotating wire-frame (Necker) cube, which was perceptually bistable. A training phase had depth cues (stereo and occlusion), which forced a particular perceived direction of rotation. In addition, a new signal was presented (”+” or ”-” values), which gave no perceptual information about the rotation direction, but that was always paired with motion perceived in a consistent direction. At the test phase, only the new signal was presented (Fig. 1.1). During the post-training test phase, which did not feature the depth cues, they found that the new signal was able to bias the perceived rotation direction of the cube. Their findings support the view that a new, previously irrelevant cue can be recruited by the visual system and visual appearance can be modified by formed associations.
Figure 1.1: Experiment design for the cue recruitment paradigm [1]. Before training the new signal, (+) or (-), had no influence on the perceived rotation direction. After training the new signal that was paired with two directions of rotation biased the perception of rotation.
Single-cell recording studies also explained the effects of associations on sub-sequent perceptual experience and corresponding sensory plasticity in the cortex. Schlack and Albright [2] revealed that motion sensitive neurons of rhesus mon-keys exhibited unprecedented selectivity for shapes after a period of association training. They trained rhesus monkeys to associate specific directions of moving dot patterns with specific directions of a static arrow shape (Fig. 1.2). After
the training, they recorded responses of the neuron which were initially unre-sponsive to the static stimuli. Results showed these neurons became activated by the static arrows associated with the preferred directions of motion. In another study, Fitzgerald et al. [23] trained monkeys to associate pairs of arbitrarily se-lected static shapes. They found that the selectivity of the recorded LIP (lateral intraparietal cortex) neurons were altered by these learned associations. These studies indicate that there is plenty of room for sensory plasticity induced by associative learning.
Figure 1.2: Visual stimuli and experimental paradigm for association learning [2] (A) Monkeys learned to associate up and down motions with up and down direc-tion arrows. (B) Behavioral task that was used for forming paired associadirec-tions between motion types and arrows.
1.3
Multisensory Associations and Visual
Mo-tion PercepMo-tion
There is an anecdote by Treichler [24] on the benefits of multisensory training: ”People generally remember 10% of what they read, 20% of what they hear, 30% of what they see, and 50% of what they see and hear.” In light of this argument, multisensory training has been appreciated and exploited in the fields of education and clinical practice, however, solid scientific evidence to support this view has been very limited to date.
Shams and Seitz [25] noted that sensory specific (unisensory) stimulation paradigms have been the focus of perceptual learning studies. However, sensory information in isolation is rarely encountered in natural settings. Therefore, single sensory modality settings fell short of explaining perceptual learning and related mechanisms [5, 25, 26]. Being routinely exposed to multisensory stimulation, the human brain has evolved to operate and learn in contexts which contain different sensory information simultaneously. In that respect, multisensory illusions includ-ing spatial ventriloquism [27], temporal ventriloquism [28, 29], and the McGurk Effect [30], are widely used to study the mechanisms underlying subsequent per-ception tasks. Many studies investigated how multimodal integration functions on subsequent unimodal processing and enhances/biases perception and/or task performance [13, 31–33]. For instance, researchers compared the effects of two training conditions (i.e., congruent audiovisual training vs. visual-only training) on a motion detection and discrimination task [13]. They reported that the group trained with audiovisual configuration performed significantly better in the mo-tion task compared to the other group. Critically, learning performance between two training groups was compared only on trials without the auditory stimulus. In a follow-up study, they measured whether the observers would produce similar performance when the audiovisual stimuli were not congruent (i.e., sound moving the opposite direction to the visual stimuli) [31]. They found that the improve-ment in learning disappeared, which suggests that learning was not caused by the alerting effect of the sound but by the congruent effect of the auditory stimulus.
A study by Teramoto and his colleagues [3] was conducted to observe the effects of adaptation to audiovisual stimuli on illusory motion perception. The observers were exposed to visual apparent motion (i.e., two white circles placed side by side) paired with tone bursts for three minutes in the exposure phase (Fig. 1.3). In the test phase the white circle was displayed twice. The first circle was synchronized to a tone A and, the second circle was synchronized to a tone B so that the static circle would be perceived as moving laterally in the same direction as the apparent motion from exposure phase. Their hypothesis was validated. They reported that after the exposure the tones were able to drive visual motion perception for a static visual object; the circle from the test phase was perceived as moving in accordance with its exposure condition.
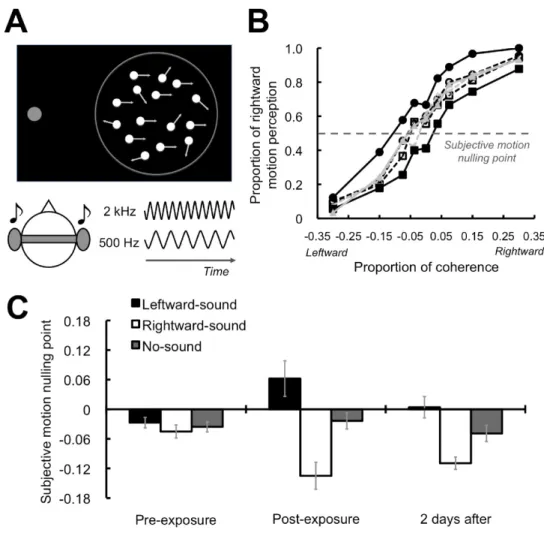
Figure 1.3: Experimental design for the study of Teramoto et al. [3]. However, the above-mentioned study has an ambiguity, which is whether the tone bursts were associated with visual apparent motion or the positional infor-mation of the visual stimuli. To address this issue, Hidaka et al. [4] conducted another experiment. They used randomly moving dot patterns in which the po-sitional information of each dot was irrelevant for the purposes of the study. In their study, they also used three sessions: test before exposure, exposure, and test after exposure sessions. In the test sessions, participants judged the direc-tion of the randomly moving dots with different coherence levels accompanied by the tone bursts of low or high frequencies (Fig. 1.4A). Dots were either moving
right or left, and each trial was matched with a specific tone frequency. In the exposure session, dots were moving 100% in coherence, and each motion direc-tion was matched with a specific tone frequency. They compared the results of before and after exposure test sessions. Their hypothesis was that they would observe a systematic change in perception of motion direction after the exposure session, which is what they concluded as a result of their findings (Fig. 1.4B,C). This study confirmed that new neural representations can be built even in adults’ brains with brief multisensory associative learning [4]. Convergent evidence indi-cates that multisensory stimulation enhances unisensory motion perception and learning.
Figure 1.4: Sound-contingent visual motion aftereffects: experimental design and behavioral results from the study of Hidaka et al. [4].
1.4
Neural Substrates within the context of
Vi-sual Motion Hierarchy
In the early literature, associative learning-related plasticity was considered a unique feature of the inferior temporal (IT) cortex neurons [22]. It was even referred as ”association cortex” over the years [22]. Early neuropsychological studies supported this view. Sakai and Miyashita [34] indicated that the IT region of monkeys which were trained to associate two visual stimuli showed responses of similar magnitude to the unimodal paired stimuli, whereas they revealed responses of different magnitude to unpaired stimuli. A similar study which explored the patterns of stimulus selectivity of IT neurons showed that paired (associative) learning paradigm induced similar response patterns for the paired stimuli [35]. Another research group investigated whether the visual-visual association activity of IT neurons can be observed in crossmodal associations, expanding the modality specific view of sensory processing regions [17]. They found that with an audiovisual stimuli delayed match-to-sample task non-visual stimuli can induce learning-related activation in IT cortex.
More recent studies investigated whether the associative neuronal plasticity is the common property of all sensory cortices, including low-level visual areas [2, 36]. Schlack and Albright [2] discovered that neurons in a low-level visual area, middle temporal (hMT+), showed unprecedented selectivity to the static visual objects after the visual objects were associated with specific directions of moving dot patterns (Fig. 1.5). Since hMT+ is considered as an early cortical area in the visual hierarchy, it becomes clear that associative neuronal plasticity is not restricted to the IT cortex neurons.
Experiments investigating the early sensory processing showed neuronal plas-ticity in a modality specific manner, particularly in the visual modality. How-ever, considering the natural environment in which the human sensory system evolved, unisensory association studies have their limits in explaining sensory plasticity in natural settings [25]. Therefore, studies investigating crossmodal induced plasticity are of great importance. Having said that, a study exploring
Figure 1.5: Selectivity of an hMT+ neuron following association task [2]. The Preferred motion direction of the neuron was 216◦ and monkey learned to as-sociate downward motion with a down arrow, and upward motion with an up arrow. (A) The up arrow elicited low rates of spike that were the same as the upward motion, while the down arrow elicited high rates of spike that were the same as the downward motion. (B) The blue curve represents mean responses to the arrow directions, while the red curve represents its mean responses to various motion directions in A.
human event-related brain potentials (ERPs) during an audiovisual interaction paradigm showed early audiovisual interactions over right parieto-occipital chan-nels [37]. In a simple stimulus detection reaction time task (RT), the ERPs in condition in which visual and auditory stimuli were presented alone (i.e., sum of two ERPs) was compared with the ERPs in a condition in which visual and au-ditory stimuli were presented simultaneously. An indicator for the early sensory interaction of the simultaneously presented bimodal stimuli was identified when significant differences were detected at the onset of the C1 component, which is defined as the earliest visual evoked potential. Also, neuronal data showed correspondence with the behavioral data reflecting shorter RTs for the detection of simultaneous audiovisual stimuli; cumulative probability analysis of the RTs ensured that shorter RTs were the result of audiovisual interaction (for detailed analysis see [37]).
In addition to multisensory integration, multisensory association paradigms are widely exploited in the quest to observe more prolonged/robust learning-related activity patterns in early sensory plasticity. Tanabe et al. [38] investigated the
role of multisensory association in sensory plasticity over early stage cortical areas with a simple delayed match-to-sample task. They found that observers who learned to associate auditory and visual stimuli with a trial-and-error method, displayed an activation increase in the visual cortex in response to the associated auditory stimulus, and an activation increase in the auditory cortex in response to the associated visual stimulus as the learning improved.
Of more direct relevance to the current study, recently Kafalıg¨on¨ul and Oluk [5] designed an experiment that questioned the the effects of prolonged exposure to audiovisual stimulation on subsequent unisensory motion perception. Specifi-cally, by associating phi motion with sound, they aimed to bias the subsequently perceived visual motion direction. Their findings suggest that formed audiovi-sual associations affected the viaudiovi-sual motion perception without the involvement of higher-level attention mechanisms. To ensure the isolation of the low-level pre-attentive visual motion processing, first, they optimized the dot size and intensity in the display (so that observers could not track the individual dots) and, second, they introduced a reverse-phi random dot motion-sound association paradigm for the exposure phase in a separate adaptation experiment (Fig. 1.6). The reverse-phi motion induced the perception of the motion direction opposite to the physical displacement, imposing the segregation of pre-attentive motion processing mech-anisms from attentive motion processing mechmech-anisms [39]. They concluded that visual stimuli paired with static sounds had divergent effects on the subsequent reverse-phi and regular-phi motion percepts, depending on the motion adaptation type in the exposure phase (further explanations are provided in the discussion). This study is important because it suggests a role for audiovisual associations in early motion processing contrary to conventional view, which claims that lower-order visual motion areas are unimodally selective. Taken together, multisensory research has expanded the view of associative learning-related plasticity, suggest-ing that plasticity is a shared characteristic of early sensory regions that were previously considered modality specific [40].
Figure 1.6: Experimental design and association paradigm [5].
1.5
Learning Dependent Resting State
Func-tional Activity
Brain regions are assumed to be activated only when a form of stimulation is induced [41]. This assumption has been proven wrong with the improvements in neuroimaging techniques; even at rest multiple neural circuits are coactivated. These coactivated neural network patterns occur as spontaneous low frequency fluctuations in the BOLD signal, and are important for modelling human neu-ral functional architecture [42]. Different methods have distinctive approaches in examining resting brain activity, for instance, a study comparing differences in pattern activity between functional no-task scans and behavioral-task scans found that resting state networks are consistently decreasing their activity dur-ing behavioral scans [43]. The positron emission tomography (PET) technique has been used to determine the physiological baseline for neural activity and to identify a resting state network [44], and the electroencephalography method was used to demonstrate neural signals that correspond to haemodynamic brain re-sponses [45]. A functional MR imaging study showed that there are resting-state networks (RSN) that are consistently present across participants and sessions [7].
Methods investigating this default state neural connectivity generally clustered around seed-based correlation (SCA) (model-driven) and independent component (ICA) (data-driven) analyses. Model driven seed-based voxel correlation analy-sis correlate a seed voxels (or ROIs) timeseries with other voxels timeseries and detect the functionally connected regions. On the other hand, data-driven inde-pendent component analysis does not require a specified seed region. Hence, it is advantageous when the region serving as the connectivity hub of the resting state network of interest is not known. By using the voxel-based correlations method, Fox et al. [46] identified two widely distributed networks which either increase or decrease the activation in a task-related manner. Similarly, with the seed-based correlations method, Greicius and his colleagues [47] investigated how posterior cingulate cortex (PCC) and ventral anterior cingulate cortex (vACC) were acti-vated in the presence of cognitively demanding tasks, passive sensory stimulation and eyes-closed resting conditions. They elucidated how these regions showed inverse correlations with other regions that increased activity during a cogni-tive task. They also found that a default mode network encapsulating PCC and vACC were deactivated during cognitive tasks, and activated during rest and passive sensory processing. The seed-based correlation method is advantageous regarding its straightforwardness; regions that have correlated temporal fluctua-tions with a chosen seed region are identified as a functionally connected network. However, there is a shortcoming of this technique, which is non-neuronal fluctu-ations in the seed region, such as those caused by respiration, could give rise to unwarranted correlations and connectivity mappings that reflect similar physi-ological noise rather than correlated neuronal fluctuations [48]. ICA could be more a more favorable method in this case [48], [49]. As a data driven approach, ICA operates without a priori hypothesis or a seed region. It extracts a set of spatial maps and their associated time series from the data, which together manifest a functional component. To date, ICA has been exploited to indicate consistent resting state networks and changes in functional connectivity induced by learning or aging within identified networks [6, 7, 50, 51]. Here, we adopted an ICA approach to investigate learning-dependent alterations in intrinsic functional connectivity as it was implicated by previous studies.
Recently, the baseline condition (resting-state) of the brain has received at-tention since understanding resting state functional activity also enhances our interpretation of task-dependent functional brain imaging studies [44, 52]. There are multiple theories on the origin and the functions of resting state activation. One approach is that circuits are constantly processing internal and external stimuli, and the brain temporarily engages systems to perform overt behaviors before turning back to its default mode [53]. Another theory states that in-trinsic resting state activity plays a role in offline processing and consolidation of memory [41]. Researchers investigated the functional link between resting state activity and memory consolidation (or reprocessing) with motor learning tasks [54, 55]. They found modulations within fronto-parietal [55] and primary motor cortex [54] regions/networks following motor learning procedures. Addi-tionally, studies explored how the inter-hemispheric functional connectivity was altered by the motor learning [56]. Sun et al. [56] found that coupling of left and right primary sensorimotor regions was increased during the learning of a novel motor sequence. In another study, researchers found modulations in functional connectivity of the visual cortex and fronto-parietal regions, regions that were involved in processing visual spatial attention, depending on a visual perceptual learning task [57]. Using an audiovisual simultaneity judgement training, Powers et al. [58] showed that functional connectivity between association cortex and auditory cortex was modulated. They determined a seed region, posterior supe-rior temporal sulcus (pSTS), and assessed how the coupling of pSTS with other networks was altered after perceptual training. They focused on a single region’s connections with other regions. However, current study explores within between, and inter-regional network connectivity changes induced by sound-motion asso-ciation training. We evaluated all canonical networks rather than focusing on a single region.
1.6
Current Study and Specific Aims
Low-level visual areas were traditionally considered to be sensory-specific and crossmodal associations were considered to be limited to high-level sensory pro-cessing [25, 36]. However, there has been growing interest in the processing level(s) of the crossmodal interactions in motion perception. Previous studies focused on the distinction between two hypotheses: the former is that cross-modal interactions emerge in sync with the perception of stimuli, implying there is no need for high cognitive processing, thus low-level sensory cortices can be engaged in multisensory associations; the latter is that there are other cogni-tive processes, which are not exclusive to motion perception, involved in the decision process of the motion task (post-perceptual factors) [59]. Designing an experimental paradigm in a laboratory settings that makes a clear distinction between these two models is challenging. Meyer and Wuerger [60] tried to ad-dress this dichotomy in their study. They presented random-dot kinematograms with an irrelevant sound source to measure participants’ discrimination perfor-mance in a visual motion direction task. They found that post-perceptual factors were involved in decision making about the motion direction task. Their results are important for indicating the higher-level mechanisms involved in multimodal motion processing, however, how sensory-specific processes are involved in cross-modal interactions remains unexplained. To address this issue, studies utilizing adaptation aftereffects paradigms offer significant explanations. In one study, researchers investigated how the perception of motion in depth was affected by crossmodal after-effects [61]. In the study, observers were adapted to either a looming or receding square in adaptation sessions. They tested whether a sound that is fixed in intensity could be perceived as if it was decreasing or increas-ing in intensity after adaptation to loomincreas-ing or recedincreas-ing squares, respectively. They found that even though the physical intensity of the auditory stimulus was the same in every condition, observers perceived them differently because of the adaptation to visual motion in depth. Their results support the view that mul-tisensory associations can exist at early stages of motion perception. Another research group found a supporting result in favor of this view [62]. They com-pared two conditions: a rightward or leftward auditory stimulus was paired with
a visual motion in one condition and a stationary sound accompanied the vi-sual motion in the other condition. They showed that motion perception of a stationary sound was not captured by the visual motion, in contrast to motion perception of a moving sound. These results are important for implying a direct perceptual link between auditory and visual motion processing; the motion after-effect occurred only when both auditory and visual stimuli moved. As mentioned above, multisensory interactions in the field of motion perception are widespread. However, the underlying neural mechanisms are still subject to debate.
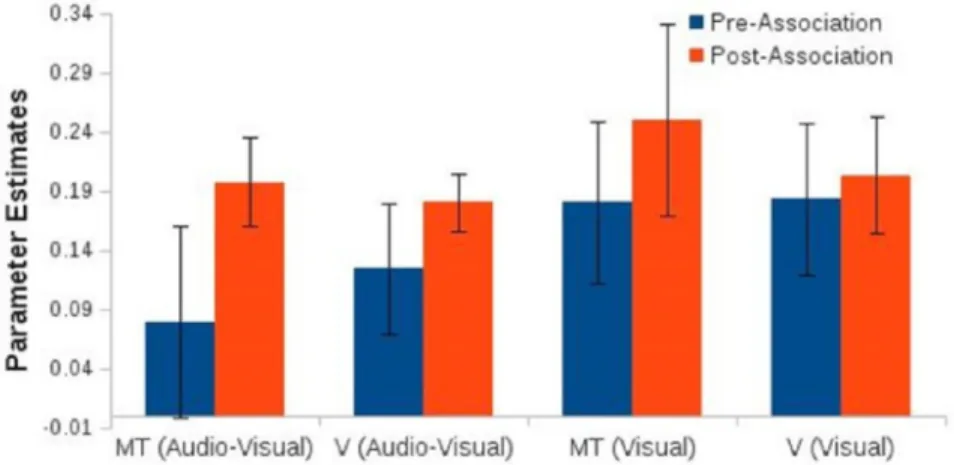
The current study investigates the neural correlates of audiovisual induced changes in visual motion processing. The audiovisual adaptation paradigm of Hi-daka et al. [4] was employed to observe possible alterations in the perception of vi-sual motion. Before and after adaptation sessions, functional imaging and behav-ioral data were collected for comparison. Behavbehav-ioral part consisted of a pre-test, in which a visual motion stimuli with the pseudorandomized sound attendance (i.e., high frequency, low frequency, and only visual) were presented; two-four days of an association phase, in which high- or low-sound frequencies accompanied the non-ambiguous (100% coherently moving) visual motion stimuli; and a post-test, which was basically the same as the pre-test. In the adaptation sessions par-ticipants learned to associate a high-frequency tone with downward moving dot patterns and low-frequency tone with upward moving dot patterns, or vice versa. Before and after association sessions, participants attended fMRI sessions to ex-amine any activity difference within distinct cortices due to associative training. MR protocol, in which BOLD response were collected, consisted of resting-state functional imaging, and passive stimulation (pre- and post-association) functional imaging sessions. To define functional regions-of-interest (ROIs) participants at-tended three more imaging sessions with respective stimulation type: hMT+, medial superior temporal (MST), and auditory cortex were localized during pre-association MR protocol. Results suggested that there was an upward trend, though non-significant, in post-association BOLD response of early visual areas (i.e., V1 to V3) and hMT+ in blocks presenting audiovisual or visual-only mo-tion, when compared with pre-association BOLD responses (Fig. 1.7). Also,
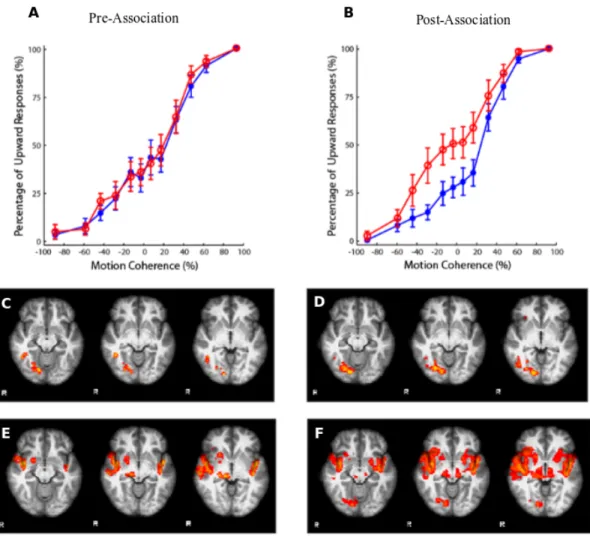
haemodynamic activity in passive stimulation sessions was in agreement with be-havioral performance in a direction discrimination task (Fig. 1.8A,B). Activity of right visual cortex in visual and audiovisual stimulation trials (Fig. 1.8D,F) and activity of multisensory association regions in audiovisual stimulation trials (Fig. 1.8F) were increased after the association phase.
Figure 1.7: Parameter estimates from ROI analyses. Blue bars represent pre-association while red bars represent post-pre-association BOLD response during a passive stimulation MRI protocol.
This thesis is specifically focused on parallels between functional resting state activities and perceptual changes induced by association training. There were three specific objective of the study: 1) To understand how audiovisual adap-tations induce sensory plasticity in resting state networks, 2) To underline the possible functional connectivity changes caused by associative learning, and 3) Assessing the inter-hemispheric interactions/coherence during rest within the vi-sual motion areas. The chapters are organized as follows: 1) Introduction, 2) Behavioral methods and results, 3) Functional imaging methods and results, 4) General discussion and future directions.
Figure 1.8: Behavioral and functional data results (n=11). Motion direction discrimination performance in pre-association (A), and post-association sessions (B). BOLD activation corresponding to visual only (C, D) and audiovisual (E, F) test trials.
Chapter 2
Behavioral Training and
Perceptual Changes
Overview
Random dot motion paradigms are frequently used in studies investigating low-level motion perception. Thus, in the current study observers were trained and assessed in a random-dot direction discrimination two alternative forced-choice (2AFC) task. Experimental procedures lasted around 7-10 days. Participants first attended to a baseline behavioral task, followed by an MRI scan to ensure the participant was actively engaged in the experiment. Next, a pre-association test phase took place, followed by a resting state functional MRI. Then, a retino-topic mapping functional MRI followed. One day later, a behavioral task-based functional MRI (i.e., localization of ROIs and passive stimulation) was performed. After a pre-association test phase, association training was initiated. For two-four days, immediately after training, participants’ performances were assessed in post-tests. At the last day of training, the post-association functional MRI data, which included passive stimulation and resting sessions, was acquired. The details of these procedures (i.e., behavioral training and resting fMRI protocol) are explained in following sections (Fig. 2.1, Fig. 3.1).
Figure 2.1: Experiment outline. The experiment was comprised of test, pre-test functional MRI, association, post-pre-test, and post-pre-test functional MRI stages, and was conducted in the respective order. Details of functional imaging are described in the next chapter.
2.1
Method
2.1.1
Participants
Eleven adults volunteers (three males, eight females, age range: 21-27 years) par-ticipated in the study, all of whom were na¨ıve to the purpose of the experiment. All observers reported normal hearing, and normal or corrected to normal vision. None had any history of neurological disorder, and all signed an informed con-sent form prior to participation (details of concon-sent form could be found in the Appendix B). Participants were paid to participate in the experiment. The pro-cedures in the experiment were conducted according to international standards (Declaration of Helsinki) and were approved by the ethics committee of Ankara University, Faculty of Medicine.
2.1.2
Apparatus and Stimuli
Participants sat in a dark and sound-attenuated room, 57 cm from a 21” LCD monitor (NEC MultiSync 2190UXp, 1600 x 1200 pixel resolution and 60 Hz re-fresh rate). The temporal precision of visual and auditory stimuli was provided by high performance video (NVIDIA GeForce Graphics) and sound (Asus Xonar
ASIO Compatible) cards. Matlab version 7.12 (MathWorks) equipped with Psy-chToolbox 3.0 [63, 64] was used for stimulus generation and acquisition of behav-ioral data. A SpectroCAL photometer was used for luminance calibration and gamma correction of the display. Sounds were emitted to both ears by circumau-ral headphones (Sennheiser HD 518) without interaucircumau-ral time- or level-differences. Tone amplitudes were calibrated using a sound-level meter (SL-4010 Lutron).
A small red circle (12 arcmin diameter) at the center of the display appeared as a fixation target on a black background (0.27 cd/m2 background luminance)
during each trial. Visual motion stimuli appeared following the onset of the fixation circle. Motion stimuli were dots (3.5 dots per deg2, gray, luminance: 65.62 cd/m2) with random up and down movements, and were presented at the
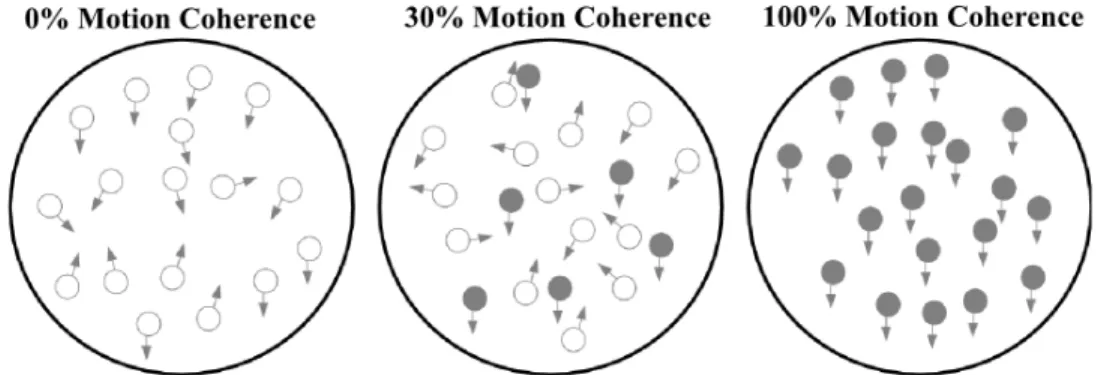
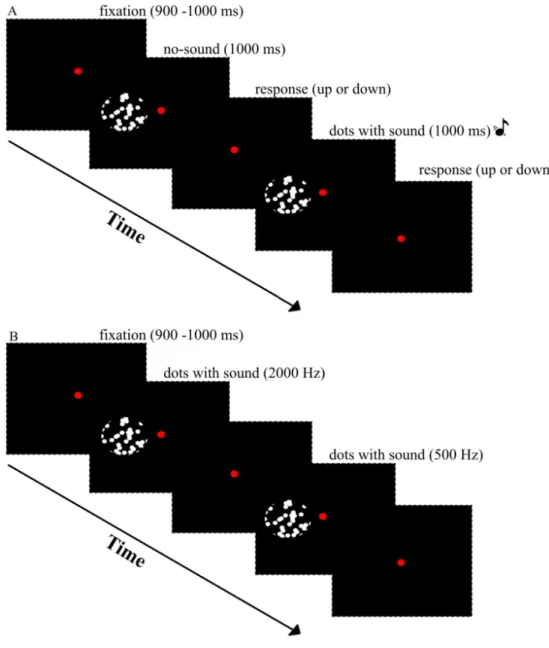
left side of the fixation circle in each trial. Motion stimuli consisted of 60 random-dot frames (i.e., 1 s in the training and test phases) and were presented within a uniform circular aperture (radius: 2.5◦). The dot density of each random-dot frame was 14 random-dots/deg and each random-dot had a 12 arcmin diameter. The random-dots’ coherence was manipulated: 5%, 15%, 30%, 45%, 60%, and 90% of dots moved either up or down as the target direction, while remaining dots moved randomly except for the target motion direction. A white noise motion algorithm [65] was utilized to manage the strength of the motion signal and determine the position of every dot in each random-dot frame. The motion signal was generated by the coherent dots that were moving up or down in coherence whilst noise dots moved in random directions with alternating speeds. The white noise motion algorithm predicts the lifetime of coherent motion dots, which is the probabilistic outcome of motion coherence [66, 67]. As the ratio of coherent dots decreases the direction discrimination becomes harder due to their short lifetimes. In the same way, as the percentage of coherent dots increases dots’ lifetime also increases. Thus, discrimination of motion direction becomes easier. In the association phase, however, all dots moved in 100% coherence in one direction and they stayed on the screen for the entire motion display. An illustration of the random-dot motion stimulus for test and association phases was provided in Fig. 2.2. Finally, an auditory stimulus (83 dB SPL) that was either a high (2000 Hz) or low (500 Hz) frequency static tone was paired with the motion stimulus. The duration of the
auditory stimulus was 1 s. There was a 10 ms rise and decay time for each tone burst and they each were sampled at 44.1 kHz.s
Figure 2.2: Random-dot stimulus diagram for three levels of coherence. At 100% coherence, dots move in a fully coherent fashion in one direction (up or down). For other levels of coherence (5, 15, 30, 45, 60, 90%), the dots either move coherently (filled symbols) or randomly (empty symbols) in successive frames.
2.1.3
Procedure
The experiment consisted of three different sessions: pre-association, association, and post-association phases. In the association phase two different pairing were formed: a 100% coherent up motion display was synchronized to a low-frequency (500 Hz) tone burst (upward-sound condition), and a 100% coherent down motion display was synchronized to a high-frequency (2000 Hz) tone burst (downward-sound condition); the second pairing was just the opposite of the first one (Fig. 2.3B). Seven of the participants were exposed to first pairing in the association phase, the remaining participants were exposed the second pairing. There were 200 presentations, 100 for each pair, and the duration of the each audiovisual motion display was 1 s. The order of the presentations was pseudorandomized. Including the duration of stimulus presentation and the interval between each stimulus presentation, the association phase lasted about 8 minutes. Participants were expected to attend to both visual motion and static sound stimuli while they were fixating on the red circle at the center of the screen. A chin-rest was used to stabilize participants’ head and they used a keyboard to indicate their responses.
Figure 2.3: Representative trial sequence for test and association phase. (A) Test phase. (B) Association phase.
In the pre- and post-association test sessions, the presentation of the random-dot motion with the static tones were exactly the same (Fig. 2.3A). In each trial of the two test sessions, the coherence of visual motion stimuli was pseudoran-domly assigned from the six values that were mentioned above: 5, 15, 30, 45, 60, and 90%. Both test sessions have upward (tone paired with up direction during the association phase), downward (tone paired with down direction during the association phase) and no sound (visual-only) trials. Each sound condition was presented six times per session. Each pre- and post-association test session con-sisted of 216 trials (3 audiovisual conditions x 6 motion coherence levels x 2 motion directions x 6 trials per stimulus). Observers completed a two-alternative forced choice task, in which they judged the direction of motion on the screen whilst fixating on the red circle at the center of the display. They were instructed not to attend individual or groups of dots, but attend the global motion. They were also required to attend the visual motion stimuli and static tones together when they were simultaneously presented. To prevent tracking of dot patterns from previous trials, the random dot patterns were changed in each trial. Participants indicated their response by pressing the 8 (for up) and 2 (for down) keys at the end of the each trial. After the pre-association test phase (2 blocks x 216 trials) participants completed association and post-association test phases for two-four consecutive days. Immediately after the 8 minute association session, two post-test sessions followed for two-four consecutive training days. Participants were encouraged to take breaks between blocks to maintain a high concentration level and prevent fatigue. Before behavioral data collection participants were acquainted with the random-dot motion paradigm.
2.1.4
Behavioral Data Analysis
Behavioral data analysis was performed with Matlab version 7.12 (Mathworks). Psychometric curves were produced using functions from the psignifit toolbox (version 2.5.6.) implemented in Psychtoolbox 3.0 [63, 64]; the single and group averaged data from audiovisual and visual-only conditions were fit with a cu-mulative Gaussian function. The 50% point of subjective equality (PSE) was
estimated by fitting cumulative Gaussian (normal distribution) function to each individual’s data utilizing a maximum likelihood curve fitting technique [68, 69]. PSE is the motion coherence level for which upward and downward motion di-rections are equally probable. PSE shifts between the no sound (visual-only) and downward/upward sound conditions were calculated to better demonstrate the comparative effects of auditory tones on visual motion perception (i.e., the influence of each auditory tone on PSE values). To visualize PSE shifts, each subjects’ PSE for the visual-only condition was subtracted from the PSE for the downward- and upward-sound conditions. We applied a two-way repeated measures ANOVA (2 sound conditions x 2 test phases) on the PSE shifts, and conducted post-hoc tests for the simple main effects. In a complementary analysis we analyzed how the responses for the most ambiguous dot motion (i.e., coher-ence 5%) changed between pre- and post-association conditions by conducting a paired-samples t-test.
2.2
Results
Changes in behavioral data were in the expected direction. In the pre-association and post-association test sessions, as the motion coherence level decreased ob-servers’ discrimination ability for motion direction also diminished. In the same fashion, as the proportion of coherently moving dots increased, direction judge-ment of the observers was also improved (Fig. 2.4A,B). The results were plotted as psychometric functions for pre-association and post-association test sessions. Percentage of upward motion perception against the proportion of motion coher-ence for pre- and post-association test sessions was indicated in Fig. 2.4A and B, respectively.
As indicated in Fig. 2.4A tone bursts of high- and low-frequencies did not affect the perception of motion direction in the pre-association test phase. Three psychometric function curves (upward sound, downward sound, and no sound conditions) are in alignment with each other (Fig. 2.4A) (no-sound condition
was not shown to avoid confusion). In the post-association test phase, the psy-chometric function for the upward sound condition was shifted to left, and the psychometric function for the downward sound condition was shifted to right, as expected (Fig. 2.4B). Thus, the association phase influenced how participants perceived the motion direction: the tone that was paired with upward motion (upward sound condition) caused an increase in reports of upward motion and the tone that was paired with downward motion (downward sound condition) caused a decrease in reports of upward motion when the coherence level of the random-dot motion was low (Fig. 2.4B). The PSE values were affected accord-ingly: the PSE value in the downward sound condition became greater whilst PSE value in the upward sound condition became smaller following the exposure phase.
Figure 2.4: Results of behavioral experiments. Group averaged data (n = 11) for different experimental conditions. (A) Psychometric functions for pre-association data. (B) Psychometric functions for post-association data. Plots were designed to indicate the proportion of upward motion responses in all trials. On the hori-zontal axis, negative values correspond to downward motion, and positive values correspond to upward motion. The filled blue circles represent the downward sound condition, whilst the filled red circles represent the upward sound condi-tion. The 50% response point was estimated as the point of subjective equality (PSE) for each condition. Error bars denote the ± SEM (standard error of mean). A statistical analysis that investigates the shifts in PSE values was conducted [two-way repeated measures analysis of variances (ANOVA), with test phase and sound condition as factors, Fig. 2.5]. The main effect of test phase was not significant [F (1,10) = 0.290, p = 0.602], but the main effect of sound condition was significant [F (1,10) = 14.881, p = 0.003]. The interaction between these two
factors was significant [F (1,10) = 10.540, p = 0.009]. To determine exact quality of the two-way interaction we ran follow-up tests. Pairwise comparisons revealed a significant effect of sound condition on PSE shifts in the post-association test [F (1,10) = 6.421, p = 0.03] but not a significant effect in the pre-association test phase [F (1,10) = 2.630, p = 0.136].
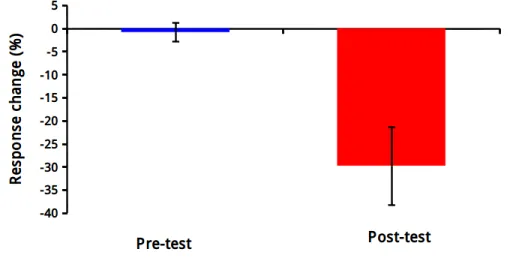
Another statistical analysis was performed in order to show the response change between two test phases for coherence level of 0.05 (this coherence level was used in the presentation of random-dot motion stimuli in functional imaging protocol). The paired-samples t-test analysis revealed that there was significant change in responses between pre- and post-association conditions; the difference between downward and upward sound conditions at a coherence level of 5% was significantly greater in the post-association compared to the pre-association con-dition [Fig. 2.6, t (10) = 3.3688, p = 0.0071]. These results demonstrate a robust sound effect on visual motion; after a prolonged exposure phase to static tone bursts the ambiguous visual motion become biased towards the exposed audiovi-sual adaptation.
Figure 2.5: The averaged PSE shifts (in units of motion coherence level) across all observers as a function of test phase. The blue bars in both test phases correspond to the downward sound condition, whilst the red bars correspond to the upward sound condition. Error bars denote the ± SEM.
Figure 2.6: The averaged response change (n =11) for the 0.05 coherence level as a function of test phase. Error bars denote the ± SEM.
Chapter 3
Functional Imaging Protocol and
Results
Overview
The scanning protocol consisted of anatomical scans followed by a block-design multisensory stimulation protocol that featured the audiovisual random-dot dis-play from the behavioral training, three functional region-of-interest (ROI) scans, and a resting state functional connectivity scan. Functional ROIs were acquired during the pre-association MR imaging. This section includes only resting-state functional protocol.
Figure 3.1: Experiment outline. Details of functional imaging sessions are ex-plained below.
3.1
Methods
3.1.1
Participants
Eleven adult volunteers participated in the study (three males, age range: 21-27 years) with all being na¨ıve to the purpose of the experiment. All observers reported normal hearing, normal or corrected to normal vision and gave written informed consent prior to participation. Participants were paid to participate in the experiment. The procedures in the experiment were conducted according to international standards (Declaration of Helsinki) and were approved by the ethics committee of Ankara University, Faculty of Medicine.
3.1.2
Apparatus
A 3-Tesla fMRI scanner (Siemens Intera Achieva 3T) was used to generate high resolution anatomical images and to measure blood-oxygen-level-dependent (BOLD) signals. Full-brain coverage was achieved using a 12 channel full-volume (birdcage) radiofrequency (RF) head coil. To minimize the head movements, a vacuum cushion and cushioned head stabilisers that reached the cheeks from the sides of the head coil, were used. MR compatible headphones were utilised to eliminate possible sound artifacts that resulted from the MRI machine throughout the data acquisition.
3.1.3
Structural MR Imaging
At the beginning of the structural imaging sessions 10 seconds long localizer scan with three orthogonal slices was acquired from all participants. Then, the high resolution anatomical scans that lasted 4 min 36 s produced coarse 3D T1-weighted images [176 slices, TR = 7.982 ms, TE = 3.68 ms, thickness = 1 mm, field of view (FOV) = 256 x 256 mm, matrix size = 256 x 256 x 176, voxel size
= 1 x 1 x 1 mm].
3.1.4
Functional MR Imaging
Prior to pre-association and at the end of the post-association test sessions 12 min-utes (time-points x time resolution) of resting-state functional connectivity data was acquired, during which observers were instructed to do nothing, close their eyes, and relax. The haemodynamic responses were acquired with a T2*weighted standard EPI sequence (28 slices acquired in a ascending interleaved pattern, TR = 2000 ms, TE = 35 ms, slice thickness = 3 mm, FOV = 240 x 131.5 mm, matrix size = 80 x 78 x 28, voxel size = 3 x 3 x 3 mm). 360 time-points were obtained per functional run.
3.2
Imaging Data Analyses
3.2.1
Image pre-processing
All imaging data were stored as DICOM (.ima) files, which were later converted to NIFTI (.nii) files for use in analyses with FSL. A software program called dcm2nii (MRIcron) was used to convert imaging data. For the whole imaging data pre-processing and statistical analysis, we used tools from the FMRIB Soft-ware Library (FSL) [70–72]. Functional data was pre-processed using the FEAT tool prior to statistical analyses [70]. Pre-processing consisted following steps: brain extraction using BET [73, 74]; motion correction using MCFLIRT [75]; spatial smoothing with a Gaussian kernel of 6 mm; slice timing correction with interleaved option; and high-pass temporal filtering at 100 s. Then, a registration step was performed: low-resolution functional images were warped to subjects high resolution T1-weighted structural images and then these high resolution im-ages were warped to the standard Montreal Neurological Institute (MNI) space with 2 mm isometric voxels via linear and nonlinear registration using FLIRT
(FMRIB Linear Image Registration Tool) and FNIRT (FMRIB Nonlinear Image Registration Tool) within FSL [76]. Due to excessive head movements of one participant detected with the MCFLIRT motion correction tool we have deleted (with MRIcron) the last 100 time-points from each observers data, thus analyses were performed in the first 260 time-points of each individual’s data.
3.2.2
Independent component analysis
Functional resting state data that were pre-processed was readied for statisti-cal analysis. An independent component analysis (ICA) approach implemented in Multivariate Exploratory Linear Optimized Decomposition into Independent Components (MELODIC) was used for analyzing pre-processed resting state data [77]. MELODIC can operate without any explicit timeseries model being specified, which is convenient for functional resting state data analysis.
Briefly, individual 4D data sets were decomposed into different spatial inde-pendent maps and sets of associated temporal components. Since each observer had different timeseries a multi-session/multi-subject, temporal concatenation method was applied for analyzing combined data from all scans of all sessions (Fig. 3.2). Group-averaged ICA components detected with a temporal concate-nation method can be decomposed into subject-specific versions of spatial maps and associated time series in follow-up analyses. We have run 3 different ICA manipulating the component number (i.e., dimensionality). 4D fMRI resting data sets were decomposed into 15, 20, and 25 (i.e., ICA-15c, ICA-20c, and ICA-25c) output components, to avoid overfitting or underfitting [77, 78]. Resting-state networks of interest were identified using an automated approach which calcu-lates the spatial correlation between each component and the standard masks of the canonical networks, as determined previously by Beckmann et al. [6] (Fig. 3.3). The component that has the highest anatomical similarity to the each net-work, found by [7], was chosen for the following group-difference analysis (Fig. 3.4). To investigate similarities in three different ICA outputs, we spatially cor-related all identified components from three ICA using fslcc. The components
that had the highest correlations were identified as canonical networks defined in previous studies [6, 7](Table 3.1). The threshold level for the active voxels was chosen as 0.5 [77]. The chosen threshold level reports that the probability of the belonging to the non-background mixture outgrows the probability of the belonging to the background noise for a voxel, meaning that the voxel survives.
Figure 3.2: Diagram for temporal concatenation group-ICA
The appropriate generalized linear model (GLM) for single-group paired dif-ference, which assesses whether the average difference of first (pre-association resting-state session) and second (post-association resting-state session) run is different from zero, was employed and was also used in permutation analysis in later stages [6]. For the group differences within each network, a dual-regression approach was then taken [8, 79]. This regression technique allows voxel-wise comparisons of resting state networks. There are two different stages to the dual-regression approach: in the first stage, group-averaged resting-state networks (RSNs) were used as regressors in a GLM analysis to extract a timeseries of the BOLD signal from the EPI data from each participant and each session indepen-dently, in the second stage, the timeseries that were extracted in the first stage were used in a second GLM analysis to obtain the subject-specific set of spa-tial maps that corresponded to each resting-state network time course for each participant and session separately (Fig. 3.5).
After the dual-regression analysis, a non-parametric permutation-based statis-tic that uses a standard GLM design setup was performed to produce between-condition activation maps for the networks we were interested in. Randomise as implemented within FSL was used for this analysis [80, 81]. Two contrasts
Figure 3.3: PICA-estimated resting state patterns from [6]. (a) Medial visual cortical areas, (b) lateral visual cortical areas, (c) auditory system, (d) sensory-motor system, (e) visuo-spatial system, (f) executive control, (g,h) dorsal visual system.
were run to measure changes in any direction (Fig. 3.6). We generated 5000 permutations of the data for testing against the null distribution. To find signifi-cant clusters (p <0.05) threshold-free cluster enhancement (TFCE) images were created. This method is useful since it finds the clusters in our data without having to define them in a binary way [82]. Whether any image survived the thresholding or not was checked by a further analysis for ICA-15c, ICA-20c, and ICA-25c separately. We decided to ignore 5 of the ICA-15c components, 10 of the ICA-20c components, and 15 of the ICA-25c components as being artefac-tual, and since we have run two contrasts for both direction (i.e., pre >post, and post >pre) we needed to apply a Bonferroni correction and our significance value for corrected images needed to be <0.005 (0.05/5*2), <0.0025 (0.05/10*2), and <0.0017 (0.05/15*2), respectively.
Figure 3.4: Mean tensor-PICA estimated resting state patterns from [7]. Com-bined results of two different analyses revealed 10 coherent resting fluctuations. (A) Lateral visual, (B) default mode network, (C, D) memory, (E) medial visual, (F) sensorimotor, (G) ventral stream, (H) dorsal stream, (I) auditory cortex, (J) executive control.
Figure 3.6: Non-parametric permutation based analysis representation [8]. In addition to independent component analysis, we extracted the mean resting state BOLD signal from each of the binarized MELODIC-defined resting state networks to determine their overall strength: firstly, the components were di-vided into sub-elements to obtain every observers’ pre- and post-test mean value (strength of network) for that component, then using ’fslutils’ as implemented in FSL we output the average timeseries for each of these voxels (Fslutils). In the final step, we compared the averaged networks for pre- and post-test performance using paired-samples t-tests (Fig. 3.10).
In an exploratory analysis, we extracted time courses from individual subjects resting state data for eight identified networks to better visualize the change in the BOLD signal (Fig. 3.11). The timeseries outputs in stage 1 of dual regression (i.e., one text file per subject, each containing columns of timeseries - one timeseries per group-ICA component) were fed into a network matrix estimation analysis to normalize the signal intensity by removing bad components. Each separate time series of each subject was normalised to have a standard deviation of 1.
3.2.3
ROI-based analysis
We obtained anatomical ROIs for middle temporal (hMT+) from the J¨ulich his-tological (cyto and myeloarchitectonic) atlas [83, 84] implemented in FSL. Two masks were created from the atlas; right and left visual cortex V5 (hMT+).
Masks were binarized at the threshold level of 10 (i.e., voxels that have inten-sity higher than 10 passed as active) (Fig. 3.7). MNI152 coordinates of these ROIs were obtained to be utilized in drawing ROIs for each individuals pre-and post-resting EPI images pre-and in extracting averaged timeseries. FLIRT was used to warp pre- and post-resting EPI images into the same space as MNI152 with 2 mm isometric voxels. The reference regions for the left and right hMT+ were 5mm spheres that were centered around MNI coordinates (-42 -74 4) and (50 -66 6), respectively. The time-course of the resting-state BOLD signal was extracted from each subject’s images (i.e., left and right hMT+) for each test phase (i.e., pre- and post-association resting). We, then, correlated the resultant time-courses between hemispheres (i.e., right hMT+ with left hMT+) to quantify inter-hemispheric functional connectivity in pre- and post-association resting us-ing correlation analysis. The resultant Pearson’s r values for each subject’s inter-hemispheric correlation were converted into z-scores using Fisher’s r-to-z trans-formation since Pearson’s r is not normally distributed. Finally, paired-samples t-tests were conducted on the resulting z-scores to observe changes between the pre- and post-association test conditions.
Figure 3.7: Right (A) and left (B) hMT+ masks.
3.2.4
Network Modelling
A network modelling approach was adopted to assess connectivity between iden-tified networks. Subjects’ timeseries for all networks from stage 1 of dual regres-sion and spatial maps from ICA (i.e., group-ICA 4D NIFTI file) were fed into FSLNets network modelling. The normalized timeseries for each network (node)
were averaged across subjects and their spectrum was plotted (Mathworks). For further cleanup bad nodes (i.e., nodes that are not identified as canonical or part of a canonical network in ICA and fslcc) were removed and only the nodes of interest remained. Deleting bad nodes aggressively is recommended when doing partial correlation [85]. We ran full correlation and regularized partial correla-tion to compare different properties. After deleting bad nodes, network matrices for each good node (i.e., nodes of interest) were computed. Resulting r-values were transformed into z-values using Fisher’s r-to-z transform. To observe the consistency of network matrices across subjects and runs, we estimated the group mean. Then, a hierarchical clustering of networks was applied. The hierarchy was formed from networks that were highly correlated to networks that were poorly correlated. Finally, we ran paired-samples t-tests to assess how the networks’ correlations varied across pre- and post-tests using the design matrix and con-trasts obtained with GLM (i.e., univariate cross-subject analysis). The steps in network modelling are illustrated in Fig. 3.8.
![Figure 1.3: Experimental design for the study of Teramoto et al. [3].](https://thumb-eu.123doks.com/thumbv2/9libnet/5625783.111546/20.918.207.756.491.791/figure-experimental-design-study-teramoto-et-al.webp)
![Figure 1.6: Experimental design and association paradigm [5].](https://thumb-eu.123doks.com/thumbv2/9libnet/5625783.111546/25.918.297.667.165.504/figure-experimental-design-and-association-paradigm.webp)
![Figure 3.3: PICA-estimated resting state patterns from [6]. (a) Medial visual cortical areas, (b) lateral visual cortical areas, (c) auditory system, (d) sensory-motor system, (e) visuo-spatial system, (f) executive control, (g,h) dorsal visual system.](https://thumb-eu.123doks.com/thumbv2/9libnet/5625783.111546/47.918.203.764.169.617/estimated-patterns-cortical-lateral-cortical-auditory-spatial-executive.webp)
![Figure 3.4: Mean tensor-PICA estimated resting state patterns from [7]. Com- Com-bined results of two different analyses revealed 10 coherent resting fluctuations.](https://thumb-eu.123doks.com/thumbv2/9libnet/5625783.111546/48.918.202.762.203.649/figure-estimated-patterns-different-analyses-revealed-coherent-fluctuations.webp)
