The Characterization, Stability, and Reactivity of Synthetic Calcium
Silicate Surfaces from First Principles
E. Durgun,*
,†,‡H. Manzano,
∥P. V. Kumar,
§and Jeffrey C. Grossman*
,§ †UNAM-National Nanotechnology Research Center, Bilkent University, Ankara 06800, Turkey ‡Institute of Materials Science and Nanotechnology, Bilkent University, Ankara 06800, Turkey§Department of Materials Science and Engineering, Massachusetts Institute of Technology, Cambridge, Massachusetts 02139, United
States
∥Molecular Spectroscopy Laboratory, Department of Physical Chemistry, University of the Basque Country UPV/EHU, Apartado
644, 48080 Bilbao, Spain
*
S Supporting InformationABSTRACT: Calcium silicate compounds belong to a complicated class of silicates. Among their many industrial applications, calcium silicates are heavily used as a building material as they constitute the main ingredient in today’s cement clinker. We report here an extensive surface analysis of synthetic calcium silicate phases (tricalcium silicate, C3S,
and dicalcium silicate, C2S) using first-principles computational methods. We calculate surface energies (γ) for all lower-index orientations and determine the most stable surfaces as well as the equilibrium Wulff structures. We analyze the variation of γ with surface coordination number and find an interesting and unexpected trend where loss of coordination of ionic Ca and O atoms can lowerγ. The stability of surface orientations is examined as a function of oxygen partial pressure. Finally, we compute the energy required to remove Ca from different surfaces and find that it is inversely proportional to γ, supporting the energetic preference of extracting atoms from higher energy surfaces. Knowledge of the atomic structure and properties of calcium silicate surfaces is important for understanding and controlling the hydration of such systems.
■
INTRODUCTIONCalcium silicate represents an interesting and complicated class of silicates, abundant in the earth’s crust and important components of many minerals. These compounds have a number of uses in industry, the most important of which are in building materials, such as cement,1,2 glass,3 paint, and refractories,4 although a wide range of other applications include light-emitting diodes,5 pharmaceutical products, drug delivery,6,7 and as a self-setting material for synthetic bone/ dental recovery and regeneration.8−10
Especially in cement production, the compound is usually prepared synthetically in the form of tricalcium silicate (Ca3SiO5, C3S) and dicalcium silicate (Ca2SiO4, C2S) and
constitutes the majority of (more than 75%) today’s cement clinker together with other minerals.11,12 The annual production of calcium silicates in the form of clinker exceeding 3 billion tons leaves a huge environmental footprint due to the emission of more than 6% of anthropogenic CO2,13and thus,
new strategies are sought to lower the intense energy requirements involved.14,15 C2S, which requires substantially
lower manufacturing temperatures, reacts much more slowly with water than C3S, rendering it less useful. To date, we have
little understanding of why certain phases of calcium silicate react differently than others, and even less of a clear picture of how to modify or control the hydration. Since the surface of
these materials is the key interface where chemical reactions begin, knowledge of the atomic structure and properties of calcium silicate surfaces is important for understanding and predicting the hydration of such systems.16
In this work, we employfirst-principles calculations to study and modify the structure and energetics of C3S and C2S
surfaces. The surface energy (γ) is obtained for all low-index stoichiometric slabs considering multiple geometries that arise from different surface cuts. Using the calculated γ, the thermodynamically stable crystal structures are obtained via the Wulff construction method. In addition, the surface stability is examined in open air conditions by varying oxygen partial pressure. Finally, the energy required to remove Ca atoms from the surface (average redox potential), which is linked to dissolution rates, is calculated and compared for the surfaces with highest and lowestγ.
■
COMPUTATIONAL DETAILSOur calculations are performed within density functional theory (DFT),17,18 using the projected augmented wave (PAW) method19 implemented in the Vienna Ab initio Simulation Received: August 20, 2013
Revised: May 27, 2014 Published: July 3, 2014
Package (VASP).20−22 The exchange-correlation potential is approximated within the generalized gradient approximation (GGA).23The Brillouin zone was sampled with 4× 4 × 1 k-points24where x and y are the periodic surface plane directions for all considered slab configurations. A plane-wave basis set with a kinetic energy cutoff of 500 eV and a 10 Å vacuum space in the nonperiodic surface normal direction are used (in order to avoid interactions between periodic slab images due to periodic boundary conditions), which have been checked to be sufficient to obtain fully converged results. All structures were relaxed using the Kosugi algorithm25 with simultaneous minimization of the total energy and interatomic forces. The convergence on the energy was set to 10−5 eV, and the maximum residual force allowed on each atom wasfixed at 0.01 eV/Å.
■
RESULTS AND DISCUSSIONSurface Structures and Energies. Calcium silicates can exhibit different polymorphs depending on the temperature and/or impurities present.11,26,27In this study, we focus on the M-C3S and β-C2S surfaces as they are the most frequently observed polymorphs in many applications. We started with the relaxed bulk structures,28,29which are shown in Figure 1. M3-C3S and β-C2S both have monoclinic crystal structures with lattice parameters: a = 9.38 Å, b = 7.20 Å, c = 12.46 Å (β = 116.23°) and a = 5.50 Å, b = 6.81 Å, c = 9.36 Å (β = 94.88°), respectively. The experimental lattice parameters are a = 5.51 Å, b = 6.75 Å, c = 9.30 Å,β = 94.59° for C2S
30
and a = 9.30 Å, b = 7.08 Å, c = 12.22 Å,β = 116.08° for C3S,31in good agreement with our computed parameters.
The surfaces are modeled using slabs cut from optimized bulk C3S and C2S structures for all low indices where in-plane
crystalline periodicity is retained (Figures 2 and 3). The surface terminations for each direction are chosen in order to ensure that the slabs are stoichiometric and are charge neutral. (A charged surface can induce a polarizing electricfield throughout the crystal, which generates a diverging electrostatic energy and results in a larger surface energy.32,33) The charge neutrality constraint also forms plausible physical conditions for anhydrous phases.34 The breaking of a Si−O bond is energetically costly, so we choose the surface cuts such that the SiO4 tetrahedron is always preserved.35,36 There is more
than one surface cut for each orientation that satisfies these principles, and we consider multiple surface cuts to determine the slab with the lowest energy configuration (see the
Supporting Information). Because of the complex crystal morphology, the top and the bottom surfaces of the slab may naturally have different atomic arrangements (such as different SiO4 orientation), and we do not impose any symmetry constraints. We allow all atoms in the slab to relax as well as the in-plane lattice parameters of the supercell.
To characterize the surfaces for all orientations, we start by computing the surface energy for a slab of stoichiometric composition, defined as the energy difference between the slab and the equivalent number of bulk formula units, divided by the surface area including both sides of the slab37
Figure 1.Relaxed crystal structure of (a) Ca3SiO5and (b) Ca2SiO4in two different orientations. The [111] and [100] planes for C3S and [100] and [110] planes for C2S are shown by pink planes. The Ca, O, and Si atoms are shown by green, red, and yellow spheres, respectively.
Figure 2.Side view of the C3S (a) (111) and (b) (100) surfaces.
γ = E −nE A 2
S B
(1)
where EB is the total energy per formula unit of the bulk structure (C3S or C2S), n is the number of formula units, ESis
the total energy of the slab containing n formula units, and A is the surface area of the slab. Asγ varies with slab thickness, the required thickness must be carefully tested to obtain converged values (converged thicknesses range between 25 and 30 Å for the considered slabs).γ values for all low-index slabs (only the lowest energy configuration as multiple surface terminations are examined) are reported in Table 1.
On the basis of our calculations, (111) and (100) are the lowest and (100) and (110) are the highest energy surfaces for C3S and C2S, respectively (Figures 2 and 3). There is a
connection between surface energies and their relative stabilities. Higher energy surfaces are generally more reactive, as more intermolecular crystal bonds are broken or disrupted during the surface formation with respect to the crystal form. This is linked to adsorption tendencies of admixtures on these surfaces’ orientations.
When the lowest and highest energy surfaces are compared, for C3S, the main structural difference lies in the denser SiO4
groups in the (111) and the oxygen-only atomic layers in the (100) orientations. For C2S, the structural differences are less
significant, but denser SiO4units in the (110) surface lead to higherγ compared to C3S. To better understand the structural
dependence ofγ, we perform a coordination analysis for all the surfaces studied, summarized in Table 1. Althoughγ generally scales with the degree of undercoordination, a different trend is obtained for Ca and Oicoordination in our case. Interestingly,
the loss of coordination on the surface with respect to bulk actually lowersγ,35a result due to the different bonding nature of Ca (and Oi for C3S) on the surface compared to bulk. In particular, the 3−4 coordinated Ca and Oi atoms for C3S and
4−5 coordinated Ca atoms for C2S are energetically more
favorable on the surface. This analysis helps to explain the variation ofγ for different systems and orientations.
It is also interesting to analyze and compare the bulk and surface Ca−O bond distributions (the Si−O bond distribution isfixed as SiO4units remain intact) of C3S and C2S. As shown in Figure 4, Ca atoms mainly form bonds with Oiatoms in C3S and have more ionic character when compared to C2S. Ca−O bond distances are shorter in C3S surfaces compared to those in C3S bulk, whereas Ca−O bond distances in C2S surfaces are
about the same as those in C2S bulk. The magnitude of the
surface relaxation in C2S is much less than that in C3S,
indicating a surface resembling bulk bonding behavior, and this gives rise to the comparatively lowerγ and higher stability of C2S surfaces.
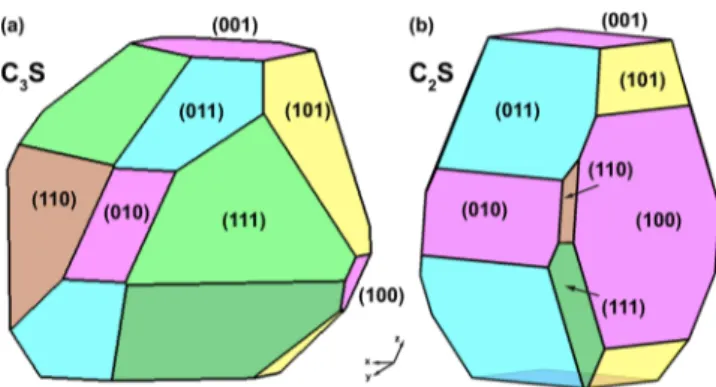
Wulff Construction. A particle of either C3S or C2S will
prefer a shape that minimizes its total surface energy, which can lead to complex equilibrium shapes. Nevertheless, once the orientational dependence ofγ is completely known, the ideal shape of the crystal in the absence of other constraints can be determined by the Wulff construction method.38,39 The Wulff shapes for C3S and C2S based on the calculatedγ (Table 1) for low-index orientations are shown in Figure 5. It should be noted that full construction of a Wulff shape requires knowledge of the complete γ variation, including high-index orientations.40,41Even ifγ values for high-index orientations are significantly larger than low-index ones, including them in the plot can mildly modify the obtained Wullf structure and may appear as rounded corners between low-index facets. None-theless, our computed structures are able to capture the main characteristics of the C3S and C2S crystal shapes obtained by
optical microscope images,42where the sharp edges of C3S and
round form of C2S are evident. As (111) forms most of the
surface area of C3S, we conclude that the observed sharp edges
Table 1. Surface Energies (γ) and Average Coordination Numbers of C3S and C2S for Seven Low-Index Orientationsa
orientation bulk (100) (010) (001) (110) (101) (011) (111)
C3S γ (J/m2) 1.38 1.09 1.19 0.98 1.25 1.14 0.96
avg. coord. no. (Ca) 6.0 4.83 4.67 4.90 4.50 4.64 4.67 4.17
avg. coord. no. (Oi) 6.0 4.50 4.66 4.75 4.00 4.00 4.00 3.75
C2S γ(J/m2) 0.67 0.78 0.80 0.98 0.95 0.83 0.95
avg. coord. no. (Ca) 7.0 5.00 5.25 5.25 5.40 5.25 5.25 5.25
aThe coordination number of Si is always 4 as the SiO
4tetrahedron is preserved.
Figure 4.Ca−O bond distribution analysis of (a) C3S (111) and (100) surfaces and C3S bulk structure and (b) C2S (100) and (110) surfaces and C2S bulk structure. The inset shows Ca−Oibond distribution of C3S.
are mainly (111) surfaces. In C2S, even though the (100)
surface dominates energetically, the area is more evenly shared, leading to more round or cylindrical shapes.
The surface planes are considered to be thermodynamically stable only if they are part of the Wulff shape.43Accordingly, we can conclude that all low-index surfaces considered here of C3S
and C2S are stable. The proportion of the highest energy surfaces in the Wulff shape is low for both cases, indicating the possibility of tuning reactivity if the surface area of these planes can be increased by external factors such as impurities. In industrial applications, C3S and C2S are not pure and already
contain impurities,11 and it has been shown that inclusion of dopants affects the reactivity profile.44,45It should be noted that there are other factors such as extrinsic defects (stacking faults or dislocations intersecting the surface) that influence the surface reactivity,46,47and it is difficult to separate the effects. In order to tune reactivity with impurities, more controlled production stages are required.
Surface Stability. Thus far, we have presented results forγ calculated for stoichiometric surfaces at 0 K and no pressure. Next, we examine the stability of different surface terminations for the lowest energy C3S (111) and C2S (100) surfaces in an
oxygen atmosphere using a simple thermodynamic analysis48 combined with the ab initio calculations. Considering the clinker production stages, variation of oxygen pressure corresponds to more realistic conditions for the surfaces studied.
The surface free energy of C3S as a function of oxygen partial
pressure P and temperature T can be written as
γ μ μ μ = − − − T P A G T P N T P N T P N T P ( , ) 1 2 [ ( , ) ( , ) ( , ) ( , )] C S slab Ca Ca Si Si O O 3 (2) where GC3S
slab(T,P) is the Gibbs free energy of the C
3S slab with
two surfaces of area A,μCa(T,P),μSi(T,P), andμO(T,P) are the
chemical potentials, and NCa, NSi, and NOare the number of Ca, Si, and O atoms, respectively. Chemical equilibrium between the bulk and the surface yields49,50
μ T P + μ T P + μ T P =g T P
3 Ca( , ) Si( , ) 5 O( , ) C Sbulk( , )
3 (3)
where gCbulk3S(T,P) is the Gibbs free energy per C
3S formula unit.
Substituting forμCa(T,P) in eq 2 leads to
γ μ μ = − −⎜ − ⎟ −⎜ − ⎟ ⎡ ⎣⎢ ⎛ ⎝ ⎞ ⎠ ⎛ ⎝ ⎞ ⎠ ⎤ ⎦⎥ T P A G T P N g T P N N T P N N T P ( , ) 1 2 ( , ) 3 ( , ) 3 ( , ) 5 3 ( , ) C S slab Ca C S bulk Si Ca Si O Ca O 3 3 (4)
For the case of C2S, eq 4 is modified as
γ μ μ = − −⎜ − ⎟ − − ⎡ ⎣⎢ ⎛ ⎝ ⎞ ⎠ ⎤ ⎦⎥ T P A G T P N g T P N N T P N N T P ( , ) 1 2 ( , ) 2 ( , ) 2 ( , ) ( 2 ) ( , ) C S slab Ca C S bulk Si Ca Si O Ca O 2 2 (5)
The Gibbs free energies in eqs 4 and 5 can be approximated by the total energies obtained from ab initio calcula-tions.49,51−53 Accordingly, as μSi is fixed, γ variation in an
oxygen atmosphere depends only onμO. The upper and lower
limits of μO are chosen so as to model “oxygen-poor” and
“oxygen-rich” environments within a physically reasonable range.
The different surface terminations can be grouped as Ca- and SiO4-rich for C3S and C2S and Oi- and Ca-Oi-rich for C3S only.
For both cases, SiO4-rich surfaces become more stable as
oxygen pressure increases, as shown in Figure 6. For all other surface terminations, the stoichiometric case always has the lowest γ. The results show an increase in γ with increasing oxygen pressure when there are more Ca and Oiatoms on the
surfaces, indicating a possible enhancement of surface reactivity as the surface becomes less stable. Interestingly, for Ca-rich surfaces,γ of C2S (100) increases significantly, indicating that
Figure 5.Wulff shapes of (a) C3S and (b) C2S based on the calculated surface energies for all low-index orientations (Table 1).
Figure 6.Surface energies of (a) C3S (111) and (b) C2S (100) as a function of oxygen chemical potential. The dashed lines denote stoichiometric surface energies.
the slow reactivity of C2S surfaces (such as dissolution rates) might be sensitive to the amount of ionic surface formed.
Surface Redox Potential. In addition to classifying the low-index surface orientations via calculations of γ, it is interesting to examine the required energy variation to remove atoms from surfaces. Following a similar approach to recent work on Li-ion batteries,35 the redox potentials (Vredox) to extract Ca from a given surface can be calculated. The redox potential where m Ca atoms are extracted from the C3S and C2S slab can be calculated as
= − − − + V E E m V [(C S) ] [(Ca) (SiO ) ] (Ca) x n xn m n redox 4 a (6)
where E[(CxS)n] (x = 3 for C3S and x = 2 for C2S) is the total
ground state energy of the slab,54n is the number of slab units, and Va(Ca) is the reference anode potential for Ca. We
calculate Vredoxfor only the lowest and highestγ surfaces of C3S and C2S. As the removal of each Ca on the two surfaces can be
energetically different (especially if they are asymmetric), we consider all possibilities for a given orientation one by one and determine Vredoxas an average over these values (Table 2). The
results show that Vredox increases with decreasing γ, which suggests that it is harder to extract Ca atoms from lower energy surfaces. As discussed in the previous sections, Vredox can be decreased for C2S slabs, if more ionic surfaces can be formed by
means of surface engineering.
■
CONCLUSIONWe report here an ab initio surface analysis of synthetic calcium silicate phases that we believe can serve as a benchmark for further studies. We have calculated the surface energies for all lower-index orientations and have determined the most and least stable surfaces as well as the equilibrium Wulff structures. Our results show an interesting variation of surface energy with coordination number where loss of coordination of Ca and ionic O atoms lowers the surface energy unexpectedly. The stability analysis as a function of oxygen partial pressure shows an increase in surface energies for Ca-rich surfaces. The calculated Ca redox potentials for different surfaces are inversely proportional to the surface energy; thus, it is harder to extract Ca atoms from lower surface energy orientations.
■
ASSOCIATED CONTENT*
S Supporting InformationFigure of multiple surface terminations for C3S (100) is shown.
This material is available free of charge via the Internet at http://pubs.acs.org.
■
AUTHOR INFORMATIONCorresponding Authors
*E-mail: [email protected] (E.D.). *E-mail: [email protected] (J.C.G.).
Notes
The authors declare no competingfinancial interest.
■
ACKNOWLEDGMENTSThis work has been supported by the Concrete Sustainability Hub at MIT, with sponsorship provided by the Portland Cement Association (PCA) and the RMC Research and Education Foundation. Calculations were performed, in part, at the National Energy Research Scientific Computing Center, which is supported by the Office of Science of the U.S. Department of Energy under Contract No. DE-AC02-05CH11231; in part, by the National Science Foundation through TeraGrid resources provided by TACC under grant number TG-DMR090027; and, in part, at TUBITAK ULAKBIM, High Performance and Grid Computing Center (TR-Grid e-Infrastructure). E.D. acknowledges support from Bilim Akademisi - The Science Academy, Turkey, under the BAGEP program. H.M. acknowledges the Juan de la Cierva postdoctoral contract from the Spanish Ministerio de Industria y Competitividad.
■
REFERENCES(1) Allen, A. J.; Thomas, J. J.; Jennings, H. M. Nat. Mater. 2007, 6, 311−316.
(2) Pellenq, R. J.-M.; Kushima, A.; Shahsavari, R.; Van Vliet, K. J.; Buehler, M. J.; Yip, S.; Ulm, F.-J. Proc. Natl. Acad. Sci. U.S.A. 2009, 106, 16102−16107.
(3) Eckersley, M. C.; Gaskell, P. H.; Barnes, A. C.; Chieux, P. Nature 1988, 335, 525−527.
(4) Rodriguez, J.; Rodriguez, M.; Aza, S. D.; Pena, P. J. Eur. Ceram. Soc. 2001, 21, 343−354.
(5) Kim, J. S.; Park, Y. H.; Kim, S. M.; Choi, J. C.; Park, H. L. Solid State Commun. 2005, 133, 445−448.
(6) Cai, Y.; Pan, H.; Xu, X.; Hu, Q.; Li, L.; Tang, R. Chem. Mater. 2007, 19, 3081−3083.
(7) Xu, Q.; Tanaka, Y.; Czernuszka, J. T. Biomaterials 2007, 28, 2687−2694.
(8) Constantz, B.; Ison, I.; Fulmer, M.; Poser, R.; Smith, S.; VanWagoner, M.; Ross, J.; Goldstein, S.; Jupiter, J.; Rosenthal, D. Science 1995, 267, 1796−1799.
(9) Ding, S.-J.; Shie, M.-Y.; Wang, C.-Y. J. Mater. Chem. 2009, 19, 1183−1190.
(10) Aza, P. D.; Fernandez-Pradas, J.; Serra, P. Biomaterials 2004, 25, 1983−1990.
(11) Taylor, H. F. W. Cement Chemistry, 2nd ed.; Thomas Telford: London, U.K., 1997.
(12) Today’s cement is essentially made of a synthetic rock, referred to as clinker, which is a heterogeneous material with at least four distinct phases: alite (50−70%), belite (15−30%), aluminate (5− 10%), and ferrite (10−15%). Alite and belite are solid solutions of tricalcium silicate and dicalcium silicate, respectively, stabilized by a few percent of ionic substitutions.
(13) Damtoft, J.; Lukasik, J.; Herfort, D.; Sorrentino, D.; Gartner, E. Cem. Concr. Res. 2008, 38, 115−127.
(14) Gartner, E. Cem. Concr. Res. 2004, 34, 1489−1498. (15) Amato, I. Nature 2013, 494, 300−301.
(16) Garrault, S.; Nonat, A. Langmuir 2001, 17, 8131−8138. (17) Kohn, W.; Sham, L. J. Phys. Rev. 1965, 140, A1133−A1138. (18) Hohenberg, P. Phys. Rev. 1964, 136, B864−B871.
(19) Blöchl, P. E. Phys. Rev. B 1994, 50, 17953−17979. (20) Kresse, G.; Hafner, J. Phys. Rev. B 1993, 47, 558−561. (21) Kresse, G. Comput. Mater. Sci. 1996, 6, 15−50. (22) Kresse, G. Phys. Rev. B 1996, 54, 11169−11186.
(23) Perdew, J. P.; Burke, K.; Ernzerhof, M. Phys. Rev. Lett. 1996, 77, 3865−3868.
(24) Monkhorst, H.; Pack, J. Phys. Rev. B 1976, 13, 5188.
(25) Diercksen, G. H., Wilson, S., Eds. Methods in Computational Molecular Physics; Springer: Dordrecht, The Netherlands, 1983.
(26) Courtial, M.; De Noirfontaine, M.-N.; Dunstetter, F.; Gasecki, G.; Signes-Frehel, M. Powder Diffr. 2003, 18, 7−15.
Table 2. Average Redox Potentials for the Removal of a Single Ca Atom from the Lowest and Highestγ Surfaces of C3S and C2S
C3S (111) C3S (100) C2S (100) C2S (110)
(27) Dunstetter, F.; De Noirfontaine, M.-N.; Courtial, M. Cem. Concr. Res. 2006, 36, 39−53.
(28) Durgun, E.; Manzano, H.; Pellenq, R. J. M.; Grossman, J. C. Chem. Mater. 2012, 24, 1262−1267.
(29) Manzano, H.; Durgun, E.; Abdolhosseine Qomi, M. J.; Ulm, F.-J.; Pellenq, R. J. M.; Grossman, J. C. Cryst. Growth Des. 2011, 11, 2964−2972.
(30) Fukuda, K.; Ito, S. J. Am. Ceram. Soc. 1999, 82, 2177−2180. (31) de Noirfontaine, M.-N.; Dunstetter, F.; Courtial, M.; Gasecki, G.; Signes-Frehel, M. Cem. Concr. Res. 2006, 36, 54−64.
(32) Tasker, P. W. J. Phys. C: Solid State Phys. 1979, 12, 4977. (33) Noguera, C. J. Phys.: Condens. Matter 2000, 12, R367. (34) Vandiver, J.; Dean, D.; Patel, N.; Bonfield, W.; Ortiz, C. Biomaterials 2005, 26, 271−283.
(35) Wang, L.; Zhou, F.; Meng, Y.; Ceder, G. Phys. Rev. B 2007, 76, 165435.
(36) Astala, R.; Stott, M. Phys. Rev. B 2008, 78, 75427.
(37) The definition of the surface energy assumes that both surfaces of the slab are symmetric. It should be noted that it is not always the case in our systems, and thus, top and bottom surfaces may have different surface energies. As it is not possible to calculate the surface energies separately, the average value for a slab is reported instead. Therefore, reported values are indeed cleavage energies when top and bottom surfaces are complementary, yet we will maintain the term “surface energy” for simplicity.
(38) Wulff, G. Z. Kristallogr. 1901, 34, 449−530.
(39) Griffith, A. A. Philos. Trans. R. Soc. London, Ser. A 1921, 221, 163−198.
(40) Rottman, C.; Wortis, M. Phys. Rep. 1984, 103, 59−79. (41) Rottman, C.; Wortis, M. Phys. Rev. B 1981, 24, 6274−6277. (42) WHD Microanalysis Consultants Ltd, Suffolk, United Kingdom, 2009. http://www.whd.co.uk.
(43) Markov, I. V.; Markov, I. V. Crystal Growth for Beginners: Fundamentals of Nucleation, Crystal Growth and Epitaxy; World Scientific: Singapore, 2003.
(44) Stephan, D.; Wistuba, S. J. Eur. Ceram. Soc. 2006, 26, 141−148. (45) Kim, Y.-M.; Hong, S.-H. J. Am. Ceram. Soc. 2004, 87, 900−905. (46) Lasaga, A. C.; Luttge, A. Science 2001, 291, 2400−2404. (47) Lasaga, A. C.; Lüttge, A. Eur. J. Mineral. 2003, 15, 603−615. (48) Zangwill, A. Physics of Surfaces; Cambridge University Press: New York, 1988.
(49) Reuter, K.; Scheffler, M. Phys. Rev. B 2001, 65, 035406. (50) This condition is necessary but can be underconstrained as it treats three components collectively. In addition, a particular stoichiometry on the system is assumed; one cannot be sure that all possible stoichiometric changes have been accounted for when the oxygen chemical potential is varied to simulate different oxygen partial pressures.
(51) The small contributions from the zero-point vibrations, vibrational entropy, and enthalpy changes are neglected.
(52) Xu, X.-L.; Chen, Z.-H.; Li, Y.; Chen, W.-K.; Li, J.-Q. Surf. Sci. 2009, 603, 653−658.
(53) Li, Y.; Yao, K.; Liu, Z. Surf. Sci. 2007, 601, 876−882. (54) Aydinol, M.; Kohan, A.; Ceder, G. J. Power Sources 1997, 68, 664−668.