1
Identification of crack noises in household refrigerators
This is a post-refereeing final draft. When citing, please refer to the
published version:
H. Koruk, A. Arisoy, Identification of crack noises in household
refrigerators,
Applied
Acoustics
89,
234–243,
2015.
2
Identification of crack noises in household refrigerators
Hasan Koruka,b,*, Ahmet Arisoyb,c,+
aMEF University, Mechanical Engineering Department, 34396 Istanbul, Turkey bEDA Enerji Dinamik Akustik Ltd., ITU Teknokent, 34469 Istanbul, Turkey cIstanbul Technical University, Mechanical Engineering Department, 34437 Istanbul, Turkey
[email protected]*, [email protected]+ *Corresponding author. Tel.: +902123953600.
Abstract
The crack noises propagating from a refrigerator disturb residents in a household; however, the reasons behind the mechanisms of such noises have not been identified yet. In this study, the crack noises in modern household refrigerators are identified and their root causes are explored. The appropriate parameters for overall and Fourier analyses are first determined and the noise characteristics of typical household refrigerators under various conditions are presented. Then, a special test rig providing remote control of the subcomponents including the compressor, fan and heater is designed and structural acceleration and sound pressure measurements inside and outside the test rig in a quiet room are performed. The acoustic and vibration measurements are conducted under various conditions by separately controlling each subcomponent. The crack noises in typical household refrigerators are identified and their root causes are explored by using the results of the overall and Fourier analyses. Some solutions to minimize the crack noises in household refrigerators are also summarized.
Keywords: Crack noise; household refrigerator; overall analysis; frequency spectrum; temperature
3
1. Introduction
Vibration and acoustic behavior of domestic appliances are becoming increasingly more important as these commodities are linked with life quality and customer satisfaction [1-4]. Furthermore, noise and vibration levels perceived by consumers are frequently recognized as a measure of overall quality of domestic appliances [1-2, 5]. Unlike other home appliances, refrigerators operate all day and users respond sensitively to the noise they generate. It is reported that more than half of the inhabitants are annoyed by refrigerator noise [5]. The inhabitants are more annoyed with the unsteady fluctuating noises as compared to the steady operating noise [1-3, 5-6]. It should be noted that the impulsive type noises are common in modern refrigerator models [7-8] and such crack noises affect the sound quality of the product [8-11]. Especially, during sleeping hours due to natural decrease of the background noise, the noise emitted by a refrigerator could be very annoying.
There are many studies on the main noise sources of refrigerators such as compressor [12] and fans [13] and operating phases of a refrigerator such as start-up, steady state and ending [2]. Identification and quantification of the compressor and fan noises is relatively straightforward as the positions and the properties such as rotation speeds, and number of blades of these components are known and the exact contributions of these components can be identified by using the frequency spectrums measured by operating each component separately. However, the crack noises, a serious problem of today’s no-frost (modern) refrigerators, have not been identified and the root causes of such noises have not been explored in the literature [13-15]. This paper attempts to fill this void with a controlled experimental study and by analyzing a huge number of structural acceleration and sound pressure measurements conducted in a quiet room (representing a kitchen of a typical house) using a few refrigerators and a special test rig under various conditions. Based on the main findings, some solutions to minimize the crack noises in household refrigerators are also summarized.
4
2. Problem formulation
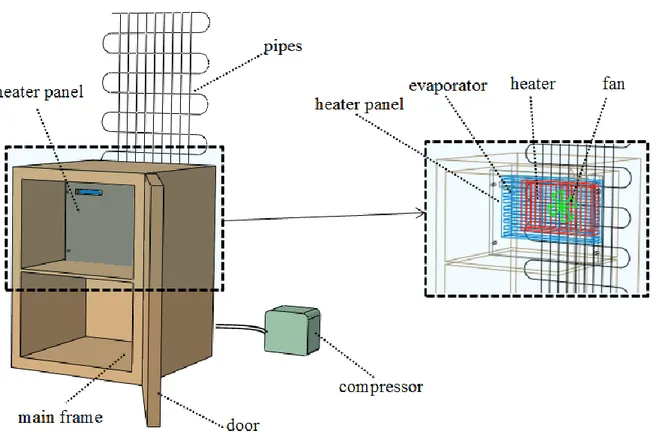
The exact components (or subcomponents) propagating the crack noises in household refrigerators are not known although the crack noises can be heard by ear and measured by a microphone outside a refrigerator in practical measurements. Furthermore, the reasons behind the mechanisms of such burst type noises are not well known. The noise characteristics including the crack noises in household refrigerators are first presented to reveal the existing state. Then, a special test rig providing remote and separate control of each subcomponent (i.e., the compressor, fan and heater) is designed to identify the crack noises in household refrigerators. The unnecessary components (or parts) creating difficulty to identify the crack noises with good reliability are excluded from the test rig designed here. The test rig includes mainly half of a refrigerator airframe, a compressor, a fan, a heater, an evaporator and cooling pipes. The schematic of the test rig including the subcomponents is shown in Fig. 1. Both structural acceleration and sound pressures are measured inside and outside the test rig in a quiet room representing a kitchen of a house. The temperature measurements on the surface of the heater are also conducted. The sensor positions where the measurements include structural acceleration (a), sound pressure (p) and temperature (T) are shown in Fig. 2 where a1, a2 and a3 are the acceleration levels measured on the heater, inside and outside panels, respectively, and p1, p2 and p3 are the sound pressures measured inside the cabinet and at some points close to the evaporator and compressor, respectively.
5
Fig. 1. The schematic of the test rig including the subcomponents.
Fig. 2. Sensor positions where the measurements include structural acceleration (a), sound pressure
6
The time signals of both structural acceleration and sound pressure are first recorded with a high sampling rate (fs = 215 = 32.8 kHz) and the overall and Fourier analyses of the signals are performed as a post processing phase [16-17] later. The use of exponential averaging (i.e., the use of exponential time weighting) for continuous non-stationary signals is very common in acoustic measurements [18]. The overall value of a time domain sound pressure signal based on exponential averaging with time weighting at any time t is determined as follows:
( )
1 2( )
( ) d t t p t p e − − − =
(1)
where p
( )
is the instantaneous time varying sound pressure and is a dummy variable ofintegration. The overall value of the structural acceleration a (or displacement x and velocity v) is also calculated using Eq. (1) by interchanging p with a (or x and v). The value of the exponential time weighting should be small enough to capture the amplitudes of cracks with high accuracy. The overall sound pressure level for a given value as a function of time t is finally calculated as follows:
( )
2( )
2p, 0
L t =10logp t p
(2) where p0 =20 Pa is the value of the reference sound pressure. The Fourier Transform (FT) of the time domain p t
( )
signal is conducted as follows [17]:( )
( )
-j2π( )
FT e ft d P f p t p t t − = =
(3)
where f represents the frequency and j= -1. It is noted that appropriate overall and FT signal processing parameters including the value of and frequency resolution ∆f need to be determined. There is also a need to present the general and crack noise characteristics of typical household refrigerators.
7
experimental test rig to study the crack noises in typical household refrigerators; (ii) determine the appropriate signal processing parameters for overall and Fourier analyses to identify the burst type noises in refrigerators; (iii) present the general and crack noise characteristics of typical household refrigerators under various conditions; (iv) identify the crack noises in household refrigerators by conducting a large number of structural acceleration and sound pressure measurements using the special test rig; (v) explore the root causes of the crack noises in refrigerators; and (vi) summarize some solutions to minimize the crack noises in household refrigerators.
3. Signal processing parameters and noise characteristics of household refrigerators
Typical no-frost household refrigerators are first studied to show their noise characteristics including the crack noises and also to identify signal processing parameters for the overall and Fourier analyses in this section. The properties of the refrigerators studied here are listed in Table 1. A quiet acoustic space is created by placing some panels whose inner surfaces are covered by sound absorbing materials (wedge foams) around the test refrigerator. The background noise measured inside this special room is about Lp = 20 dBA. A microphone is placed at the back of the refrigerator to measure the sound pressure propagating from the refrigerator; the distances of the microphone from the refrigerator and the ground being 30 and 70 cm, respectively. The sound pressure level measurements are conducted after the test refrigerator reaches to the steady state conditions (i.e., after it works for about t = 24 hours).
Table 1
Properties of the household refrigerators under investigation.
Dimensions Main Functions
Height (mm) : 1900 Cooling system: No-frost Width (mm) : 700 Super cooling function: Yes Depth (mm) : 750 Super freezing function: Yes
Volume Performance
Total (lt) : 475 Energy efficiency class: A+ Cooler (lt) : 360 Season class: T
8
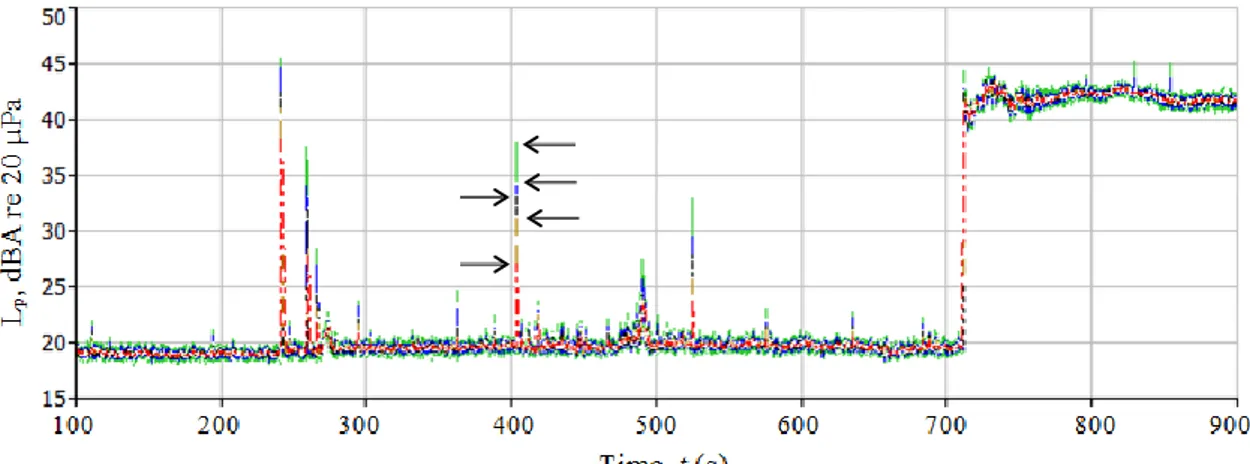
The appropriate values of signal processing parameters are determined here. The preliminary analyses results show that the contribution of the frequencies beyond 6 kHz can be ignored. Therefore, the frequency span is selected as f = 1 Hz to 6.4 kHz in the analyses. The value of the time weighting is determined by comparing the results of the overall analyses conducted with different values; the sample results are presented in Fig. 3. The results show that even the very low-valued noises can be detected when = 1/32 s while the crack noises can not be detected correctly when > 1/4 s. For example, the amplitudes of the crack noise at about t = 400 s in Fig. 3 are about Lp = 27, 31, 33 and 34 dBA when = 1/2, 1/4, 1/8 and 1/16 s, respectively. Overall, the analyses are conducted with = 1/8 s in this study.
Fig. 3. Effect of time weighting τ on overall sound pressure levels measured at the back of the
refrigerator.
Key: τ = 1/32, τ = 1/16, τ = 1/8, τ = 1/4 and τ = 1/2 s.
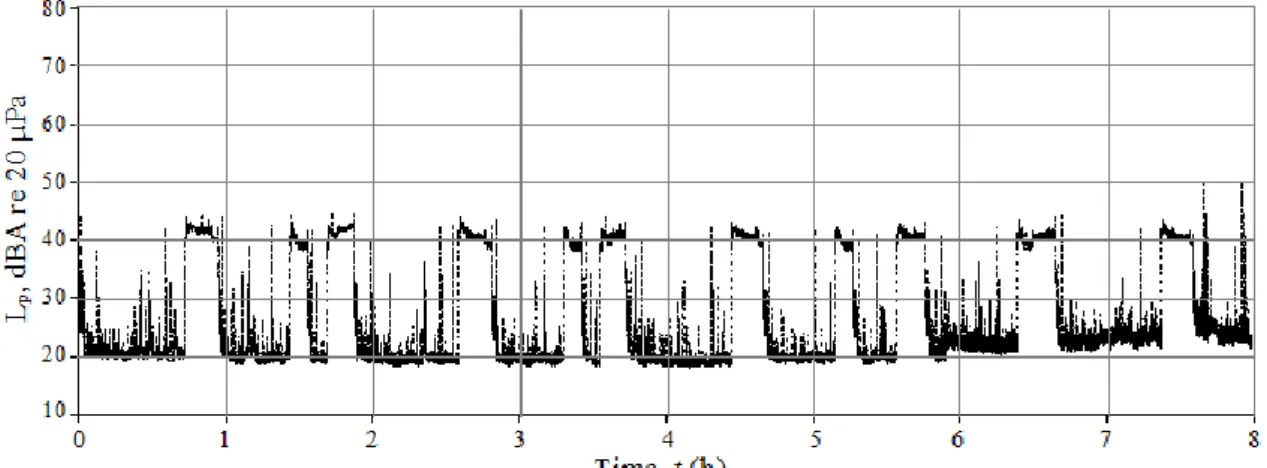
The noise characteristics including the crack noises of the refrigerators under various conditions are presented here. The refrigerators are first loaded using three bricks (the total mass being about m = 5 kg) and the temperatures are set T = -22 0C with the freezer and T = +4 0C with the cooler; the overall sound pressure levels Lp for a duration of t = 8 hours are plotted in Fig. 4. It is seen that the number of cracks and also their magnitudes are quite low. Next, the refrigerator is loaded with some hot water (total mass being again about m = 5 kg)
9
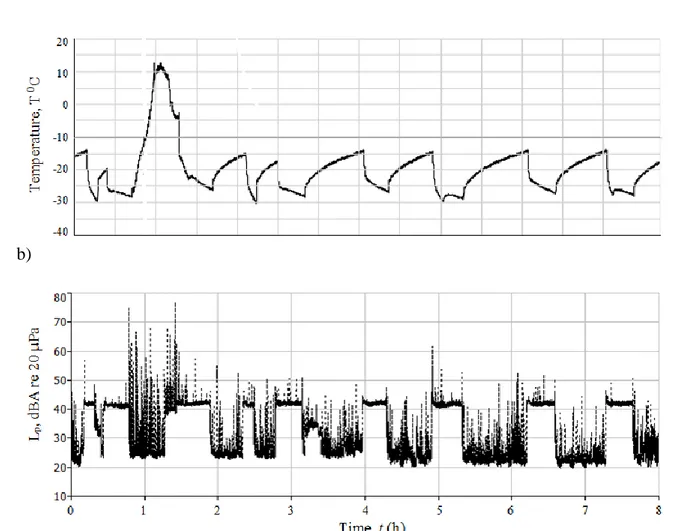
and the overall sound pressure levels Lp for this case for a duration of t = 8 hours are plotted in Fig. 5. It is seen that the number and magnitudes of the crack noises are higher this time; the denser loading more the crack noises. The crack noises are quite dense especially when t = 6 - 7 h. In order to verify these results further, the same sound pressure level measurements are conducted using another similar refrigerator and the temperature at a point close to the heater is also measured this time; the results are plotted in Fig. 6. It is seen that the Lp results in Figs. 5 and 6 are similar and the crack noises for the later case are quite dense when t = 0.5 – 1.5 h this time. It is obvious that the defrost occurs when t = 6 – 7 h for the measurement given in Fig. 5 and t = 0.5 – 1.5 h for the measurement given in Fig. 6 where the crack noises are quite dense and there are rapid changes in the temperature values measured at the heater panel. Although not presented here for brevity, the temperatures are set as super freeze and cooling and the results show that the crack noises increase further for these cases.
Fig. 4. Overall sound pressure levels measured at the back of the refrigerator for T = -22 with the
10
Fig. 5. Overall sound pressure levels measured at the back of the refrigerator for T = -22 with the
freezer and T = +4 0C with the cooler (the refrigerator is loaded with hot water). a)
b)
Fig. 6. The temperature measured at the heater panel (a) and overall sound pressure levels measured
11
It should be noted that the measured cracks are not ideal dirac delta functions [17]; instead they are like triangle pulses and can be expressed as:
1 0 elsewhere W t W t W t −
(4)
where 2W is the width of the triangle pulse. The FT of the triangle pulse in Eq. (4) is determined as follows:
(
)
2( )
, sinc
FT
W t =W Wf(5) where the function ‘sinc’ for the variable ‘x’ here is given as sinc
( )
x =sin( x)( )
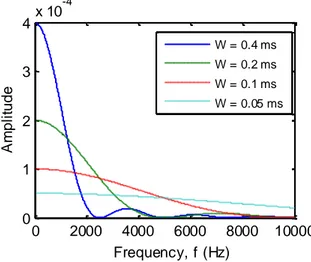
x . The FTs of a few pulses with different widths (W values) are plotted in Fig. 7. A crack should contain energy for a wide frequency range depending on the W value; note that the response of the triangle pulse with W = 0.05 ms is nearly flat for the frequency range of interest in this study (i.e., for f = 0 – 6.4 kHz). It should be remembered that as the sampling frequency is quite high (i.e., fs = 32 kHz) and thus as the sampling interval is quite low (i.e., ∆t = 0.03 ms), the frequency contents of the cracks can be correctly identified.Fig. 7. The FTs of a few triangle pulses with different widths (W values).
0 2000 4000 6000 8000 10000 0 1 2 3 4 x 10 -4 Frequency, f (Hz) A m p li tu d e W = 0.4 ms W = 0.2 ms W = 0.1 ms W = 0.05 ms
12
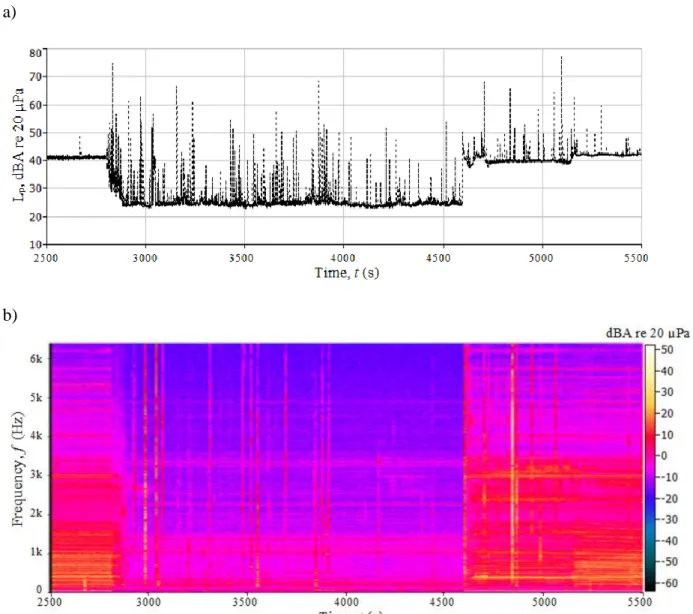
The FTs of the sound pressure data including the region where the crack noises are quite dense (i.e., when t = 2500 – 5500 s) in Fig. 6 are first conducted using different ∆f frequency resolution, averaging time and trigger interval values here to select the appropriate FT signal processing parameters. The results of the overall analyses of the associated data are re-produced in Fig. 8a. In conclusion, the FT signal processing parameters are determined to be as ∆f = 4 Hz and averaging time t = 0.5 s (the overlap is %66.7 and the number of averages is 6). The FT of the data in Fig. 8a using the identified signal processing parameters is plotted in Fig. 8b. It is seen that the crack noises contain energy at all frequencies in the frequency range of interest (i.e., for f = 0 – 6.4 kHz) though the magnitudes of the crack noises slightly decrease as frequency increases as similar to the theoretical results presented above. It should be noted that the frequency characteristics of the crack noises in refrigerators are further analyzed and examined in detail in Sections 4.3 and 4.4.
Overall, it has been shown that some crack noises are propagated from the typical household refrigerators; however, the components propagating these burst type noises and the reasons behind the mechanisms of these noises are not known. As the sources of the cracks can be any part of a refrigerator, there is a need to utilize a controlled experimental study to explore the root causes of the crack noises as it is carried out in the next section.
13 a)
b)
Fig. 8. The overall sound pressure levels (a) and the FT results (b) of the data measured at the back
of the refrigerator for T = -22 with the freezer and T = +4 0C with the cooler.
4. Identification of the crack noises in household refrigerators using the test rig
Here, a systematic study based on the experimental test rig and signal processing parameters presented in Sections 2 and 3 is conducted. The effect of each subcomponent including the heater and the effect of loading on the crack noises in household refrigerators are investigated by conducting various experiments. First, the repeatability of the test rig is checked. After that, the compressor and fan are operated together and separately and the contribution of these two components on the crack noises is investigated. Then, the test rig is loaded with hot water and the
14
effect of loading on the crack noises is investigated. Finally, the heater is operated and the effect of heating on the crack noises in refrigerators is investigated. The main findings are discussed at the end of this section.
4.1 Experiment scenario 1: Assessment of the test rig
The repeatability of the test rig should be checked and ensured first. The scenario of the experiment for this purpose is presented in Table 2 where the compressor and fan are first on for a while and they are then off; this repeats three times. The temperature, overall structural acceleration and sound pressure levels for this scenario are plotted in Fig. 9. It is seen that the temperature varies between -33 and -20 0C. As seen both in sound and vibration measurements, the test rig including the measurements system and acoustic room is quite repeatable. Results show that there are only a few crack noises whose amplitudes are less than 45 dBA for this measurement.
Table 2
Scenario of the experiment 1 for checking the repeatability of the test rig.
T (s) Compressor Fan Heater
0 - 240 On On Off
240 - 1560 Off Off Off
1560 - 2160 On On Off
2160 - 2760 Off Off Off
2760 - 3360 On On Off
15
Fig. 9. The temperature, overall structural acceleration and sound pressure levels for the experiment
scenario 1 (see Fig. 2 for the sensor positions and Table 2 for the experiment scenario).
4.2 Experiment scenario 2: Effects of the compressor and fan
Here, the compressor and fan are operated together and separately and the contribution of these two components on the crack noises is investigated. The scenario of the experiment for this purpose is presented in Table 3 where both the compressor and fan are on for t = 0-300 s (or for the first t = 5 minutes), only the compressor is on for the next t = 600 s (or t = 10 minutes) and all components are off for the next t = 600 s. The temperature, overall structural acceleration and sound pressure levels for this scenario are plotted in Fig. 10. It is seen that the background sound pressure level is about Lp = 20 dBA; note that the measured sound pressure levels are equal and greater than Lp = 40 dBA even when only the compressor is on. This means the special room is quiet and reliable for
16
these measurements. The contribution of the fan on the total sound pressure level is 2-3 dBA when the evaporator microphone (p2) is considered. Note that the fan noise is more dominant inside the cabinet as expected. The temperature measured on the heater varies between T = -22 and -8 0C. Overall, it is seen that serious crack noises do not occur in this experiment; the amplitudes of the crack noises available are less than 32 dBA.
Table 3
Scenario of the experiment 2 for investigating the effects of the compressor and fan.
T (s) Compressor Fan Heater
0 - 300 On On Off
300 - 900 On Off Off
900 - 1500 Off Off Off
Fig. 10. The temperature, overall structural acceleration and sound pressure levels for the
17
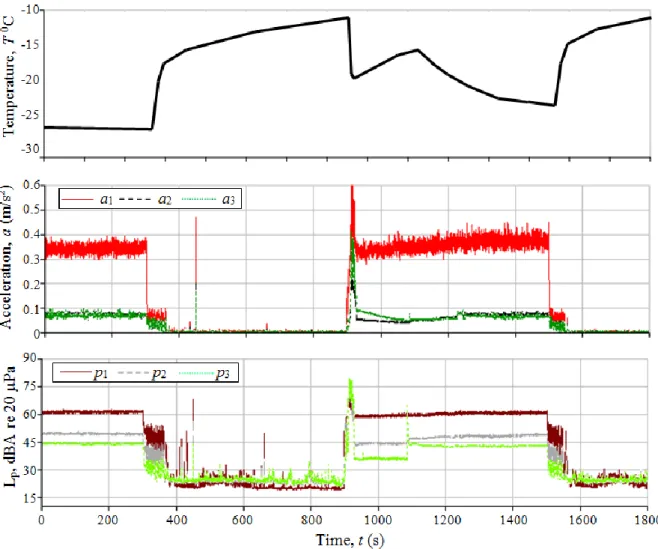
4.3 Experiment scenario 3: Effect of the loading
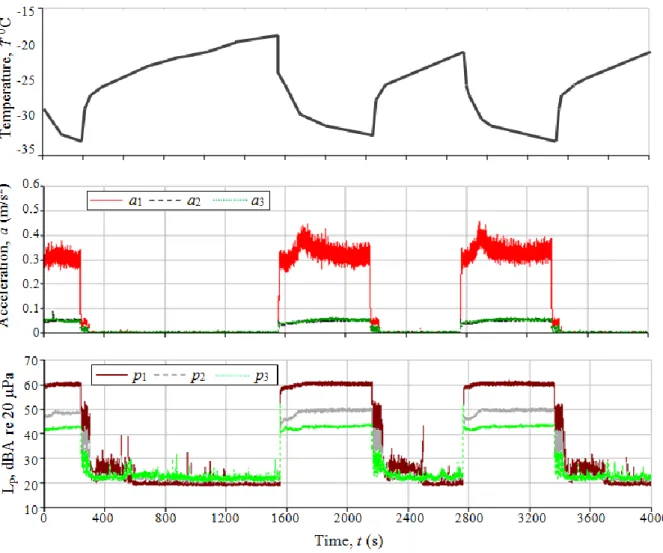
The test rig is loaded with hot water and the effect of the loading on the crack noises is investigated in this section. The scenario of the experiment for this purpose is presented in Table 4 where the test rig is loaded with hot water and the measurements are conducted after loading. The temperature, overall structural acceleration and sound pressure levels for this scenario are plotted in Fig. 11. It is seen that the temperature varies between -27 and -11 0C. There are a few considerable crack noises; the amplitude of one of them measured with microphone 1 (p1) is about Lp1 = 70 dBA. It is seen that the cracks are also detected by the accelerometers this time. The results show that the measured vibration levels for those cracks are highest at the heater panel (a1) and they are lowest at the outside panel (a3). For example, the amplitudes of the crack are a1 = 0.48 m/s2 at the heater panel,
a2 = 0.20 m/s2 at the inside panel and a3 = 0.18 m/s2 at the outside panel for the crack with the highest amplitude measured at about t = 449.5 s.
Table 4
Scenario of the experiment 3 for investigating the effect of the loading.
T (s) Compressor Fan Heater Loading
0 - 300 On On Off +
300 - 900 Off Off Off
900 - 1500 On On Off
18
Fig. 11. The temperature, overall structural acceleration and sound pressure levels for the
experiment scenario 3 (see Fig. 2 for the sensor positions and Table 4 for the experiment scenario).
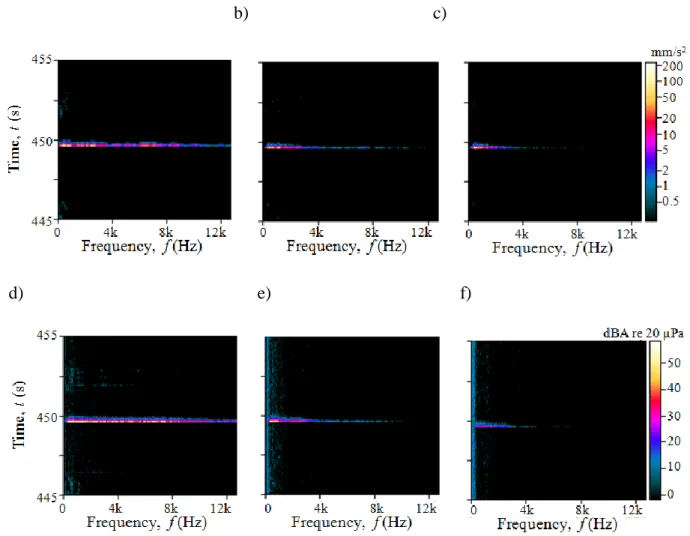
The structural acceleration and sound pressure levels for the region containing the crack occurred at about t = 449.5 s is re-plotted in Fig. 12. It is seen that the sound pressure levels are about Lp1 = 70 dBA, Lp2 = 55 dBA and Lp3 = 45 dBA. The FTs of the acoustic and structural acceleration data between t = 448 and 452 s are also conducted and the results are presented in Fig. 13. It is seen that the structural accelerations are quite high on the heater panel (a1) and their magnitudes are dominant even up to f = 12 kHz for a1 although the amplitudes decrease from f = 8 kHz to 12 kHz. Similarly, the Lp1 magnitudes are quite high for a wide frequency range.
19
Fig. 12. The overall structural acceleration (left) and sound pressure levels (right) for the
experiment scenario 3 (see Fig. 2 for the sensor positions and Fig. 11 for all overall data).
a) b) c)
d) e) f)
Fig. 13. The FTs of the structural acceleration a1 (a), a2 (b) and a3 (c) and the sound pressure p1 (d),
p2 (e) and p3 (f) for the experiment scenario 3 and the data between t = 448 – 452 s (see Fig. 2 for the sensor positions and Fig. 11 for all overall data).
20
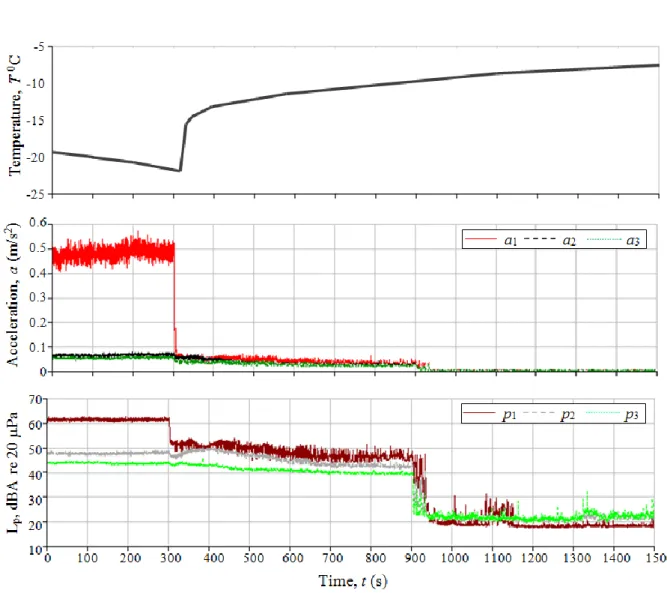
4.4 Experiment scenario 4: Effect of the heating
In this section, the heater is operated and the effect of the heating on the crack noises in refrigerators is investigated. The scenario of the experiment for this purpose is presented in Table 5 where the test rig is loaded with hot water and the measurements are conducted after the loading while the heater is also operated this time. The temperature, overall structural acceleration and sound pressure levels for this scenario are plotted in Fig. 14. It is seen that the temperature varies between -22 and 20 0C as the heater is operated this time. The FTs of the structural acceleration a1 and the sound pressure p1 are also plotted in Fig. 15. It is seen that there are a large number of cracks during the heating period, especially during the early phase of the heating process. The amplitude of the crack measured (at about t = 1330 s) with the microphone inside the cabinet (p1) is greater than 80 dBA and the amplitude of this crack measured by the accelerometer on the heater panel is greater than 1.2 m/s2 this time. Many cracks including the crack detected at about t = 1330 s have energy contributions at a wide frequency range (i.e., for f = 0 – 6.4 kHz).
Table 5
Scenario of the experiment 4 for investigating the effect of the heating.
T (s) Compressor Fan Heater Loading
0 - 1200 On On Off +
1200 - 1320 Off Off Off
1320 - 1920 Off Off On
21
Fig. 14. The temperature, overall structural acceleration and sound pressure levels for the
22 a)
b)
Fig. 15. The FTs of the structural acceleration a1 (a) and sound pressure p1 (b) for the experiment scenario 4 (see Fig. 2 for the sensor positions and Fig. 14 for all overall data).
23
4.5 Discussion
The results presented above show that the number and amplitudes of the cracks measured with accelerometers and microphones increase when the refrigerator is loaded and the heater is operated. The results of the overall and FT analyses indicate that the cracks occur due to the rapid temperature changes and the main source of the crack noises is the heater panel as the measured vibration levels of the cracks being highest at the heater panel. Note that the heater causes the temperature of the heater panel to increase very rapidly at the beginning of the defrost process and its temperature decreases when also the defrost process is completed and the refrigerator starts to cool itself by operating the compressor and/or fan. Due to the rapid temperature changes, contraction and expansion create thermal stresses in the materials and eventually these burst type sounds occur.
There are a few ways to minimize the crack noises in household refrigerators. Local heating can be considered to avoid the rapid heating process thus the thermal stress concentrations in the structural components such as heater panel. Similarly, the heating rate can be decreased to avoid the rapid heating process. The heater can also be detached from the heater panel if possible. Furthermore, the heater (plastic) panel can be redesigned so that it can include some ribs and stiffeners (instead of being flat) to minimize the acoustic radiation. In addition, passive damping treatment can also be applied on the panel to reduce the crack sound emitted from the panel. All these solutions need to be considered by also taking account the thermal efficiency of a refrigerator and this process requires an optimization procedure, which can be the subject of a future work.
5. Conclusion
This paper investigates the identification of the crack noises in household refrigerators and explores their root causes. The appropriate signal processing parameters for the overall and Fourier analyses to study the crack noises in household refrigerators are first determined and sound
24
pressures measured at the back of typical household refrigerators under various conditions are presented. Then, a special test rig providing remote control of the subcomponents is designed and it is used to conduct structural acceleration and sound pressure measurements to identify the crack noises. To the best of the Authors’ knowledge, this is the first paper in the literature identifying the crack noises in household refrigerators and exploring the reasons behind the mechanisms of such noises.
Results show that the crack noises occur due to the rapid temperature changes in structural components. The contraction and expansion due to rapid temperature changes create thermal stresses in the materials and eventually these burst type sounds occur. The heater panel which is very close to the heater and the most affected component from the heating is the main source of the cracks. The appropriate design of the heater panel and optimization of the heating process, which will aim to decrease the rapid temperature changes and thus the contraction and expansion of structural components, can minimize the very annoying crack noises in the modern household refrigerators. It is also apparent that there is a need for subjective recognition of crack noises. It should be noted that the subjective recognition of the crack noises in household refrigerators is considered as a future investigation.
Acknowledgement
The authors would like to thank to Indesit Company for supporting this study. The authors also specifically thank to Mechanical Engineer Onur Akaydin from Pro-Plan Ltd., Mechanical Engineer Murat Alparslan from EDA Ltd., Mechanical Engineer Necati Bilgin from Indesit Company and Prof. H. Temel Belek from Istanbul Technical University for their assistance.
25
References
[1] Zwicker E, Fastl H. Psycho-acoustics: facts and models. Berlin: Springer; 1999.
[2] Jeon JY, You J, Chang HY. Sound radiation and sound quality characteristics of refrigerator noise in real living environments. Appl Acoust 2007;68(10):1118–34.
[3] Sato S, You J, Jeon JY. Sound quality characteristics of refrigerator noise in real living environments with relation to psychoacoustical and autocorrelation function parameters. J Acoust Soc Am 2007;122(1):314–25.
[4] Koruk H, Sanliturk KY. Optimisation of damping treatments based on big bang–big crunch and modal strain energy methods. J Sound Vib 2014;333(5):1319-30.
[5] Jeon JY, Ryu JK. Allowable noise levels of residential noises. In: Inter-Noise 2006, Honolulu, Hawaii, USA; 2006.
[6] Kang J, Kim JD, Han JS, Kim HS, Lee MR. Noise qualification index for refrigerator aligned with consumers. In: Inter-Noise 2010, Lisbon, Portugal; 2010.
[7] Top-freezer refrigerators, www.geappliances.com, accessed on 26 June 2014.
[8] Koruk H, Belek HT, Alparslan M, Bilgin N, Acar MA, Akaydin O, Akgul A. Investigation of refrigerator noise on the prototype designs. In: Inter-Noise 2012, New York City, USA; 2012. [9] Bowe DL. Correlating sound quality metrics and jury ratings. Sound Vib 2008;42(9):12-14. [10] Plunt J, Hellström M. Impact sound quality of consumer products: evaluation by sound
quality-metrics and wavelet time-frequency analysis. In: Euro-Noise 2006, Tampere, Finland; 2006. [11] Willemsen AM, Rao MD. Characterization of sound quality of impulsive sounds using
loudness based metric. In: ICA 2010, Sydney, Australia; 2010.
[12] Lee C, Cho Y, Baek B, Lee S, Hwang D, Jo K. Analyses of refrigerator noises. In: ISIE 2005, Dubrovnik, Croatia; 2005.
[13] Takushima A, Shinobu Y, Tanaka S, Eguchi M, Matsuki K. Fan noise reduction of household refrigerator, IEEE T Ind Appl 1992;28(2):287–92.
26
[14] Han HS, Jeong WB, Kim MS, Kim TH. Analysis of the root causes of refrigerant-induced noise in refrigerators. J Mech Sci Technol 2009;23:3245-56.
[15] Han HS, Jeong WB, Kim MS. Frequency characteristics of the noise of R600a refrigerant flowing in a pipe with intermittent flow pattern. Int J Refrig 2011;34(6):1497-06.
[16] Randall RB. Frequency analysis. Nærum: Brüel & Kjær; 1987.
[17] Bendat JS, Piersol AG. Random data analysis and measurement procedures. John Wiley; 2010. [18] Crocker MJ. Handbook of acoustics. John Wiley; 1998.