OF ELECTRONIC PUBLISHING AS A
RESEARCH FIELD USING
CO‐CITATION ANALYSIS
Yaşar Tonta1; Güleda Düzyol2 1‐2 Department of Information Management, Hacettepe University 06800, Beytepe, Ankara, Turkey e‐mail: {tonta, gduzyol}@hacettepe.edu.trAbstract
Electronic publishing can be defined as making full‐texts of journal articles and books available through the network. Although e‐publishing has been in existence for over 30 years in various forms such as CD‐ROMs, it owes much of its current level of development to the Internet and the Web. This paper attempts to chart the evolution of e‐publishing as a research field over the last 31 years using CiteSpace, an information visualization tool. It maps the intellectual structure of e‐publishing based on 493 articles that appeared in professional literature on the subject between 1979 and 2009. Document co‐ citation and author co‐citation patterns and patterns of noun phrases and keywords of papers on e‐publishing are visualized through a number of co‐ citation maps. Maps show the major research strands and hot topics in e‐ publishing such as “open access” and would improve our understanding of the e‐publishing as a research field.
Keywords:
electronic publishing; information visualization; CiteSpace1.
Introduction
Scientific papers and publications reflect the rapid growth of human knowledge. Studying citations in research papers describes the development of science and explains the starting point and intellectual bases of the scientific research [1]. Bibliometrics uses citation data to trace the growth of published literature and study the patterns of publications and specific scientific developments within a field [1, 2]. Co‐citation analysis can be used to study various aspects of scientific networks and to map structures of
scholarly research in a certain field [2, 3, 4]. It identifies how often “two documents are . . . co‐cited when they both appear in the reference list of a third document” [5]. Author co‐citation analysis (ACA) is used to find out the number of times “that selected author pairs are cited together in articles, regardless of which of their works are cited” and it tries to “identify influential authors and display their interrelationships from the citation record” [6]. Co‐word analysis, on the other hand, is based on the co‐ occurrence frequency of pairs of words or phrases” and “used to discover linkages among subjects in a research field and thus to trace the development of science” [7]. “Åström found a good correspondence between maps based on author‐co‐citation analysis and on co‐occurrence of descriptors” [8]. Such relationships between citations and words reveal networks of documents, authors and words, respectively [9, 10, 11].
Studying networks has been an established research topic in information science and other disciplines. A network consists of nodes (i.e., articles, words or authors) and links (to other articles, words or authors). “Each node in the network represents a reference cited by records in the retrieved dataset” [12]. The size of a node and its label is proportional to the frequency of citations. Colors on a node (so called “rings”) correspond to the time slice in which citations were made. The thicker the ring for a certain color, the more citations the paper received from that time slice [13]. The lines between these circles represent co‐citations. The width and length of links are proportional to the co‐citation coefficient. Colors of links indicate the first appearance of those links [4]. Thicker lines and closer nodes indicate that the pairs are co‐cited more frequently and thus more similar [2].
Social network analysis (SNA) used in creating co‐citation maps is based on graph theory. SNA offers several measures such as density and centrality to study the characteristics of a network and conceptualize it [14]. The “density” of a network is defined as the number of actual links between nodes divided by the number of possible links and represents the connectedness of the graph [15]. The “centrality” of a network, on the other hand, measures relationships between nodes in terms of degree, closeness and betweenness. Central nodes are more important in a network [16]. Degree centrality is the number of direct relationships that a node has. Betweenness centrality is an indicator of a node’s ability to make connections to other nodes in a network while closeness centrality measures how quickly a node can access more nodes in a network [17].
Highly cited, and thus important, articles in a co‐citation network form “landmark” nodes. Articles that have many connections to other articles are called “hubs”. The “pivot” nodes, on the other hand, connect different sub‐ networks in a co‐citation network through playing a brokerage role [18]. Scientific networks tend to change over time in various ways. Moderate as
well as dramatic changes may be observed [4]. As a scientific field matures, new nodes and links get added to the network while some of the existing ones get merged with other nodes or would disappear altogether.
This paper aims to assess the evolution of e‐publishing as a research field using scientific visualization techniques. Tracing its historical development between 1979 and 2009, we carried out a domain analysis of the e‐publishing field so as to see how it is that the intellectual structure of e‐publishing has changed over time. In addition to providing descriptive statistics on e‐ publishing, we addressed the following research questions:
What are the prominent articles in the field of e‐publishing?
What major areas of e‐publishing exist and how are they interlinked? Which authors are major knowledge producers?
Is there an evolving area in e‐publishing as a research field?
We used the CiteSpace software (http://cluster.ischool.drexel.edu/~cchen/ citespace/) to explore the research fronts in e‐publishing field and addressed the research questions by means of co‐citation analysis and scientific information visualization tools.
2.
Methodology
We performed a topical search on Thomson Reuters’ Web of Science (WoS) online database to identify papers on e‐publishing that appeared in the literature between 1979 and 2009 [19]. We used the terms “electronic publishing”, “e‐publishing” and “digital publishing” for topical searches. A total of 1,182 papers were identified. Some 689 contributions other than journal articles (book reviews, editorials and other document types) were excluded. The full bibliographic records (including authors, titles, abstracts and reference lists) of the remaining 493 journal articles were downloaded along with a total of 1,895 citations that they received.
We used CiteSpace to analyze and visualize co‐citation networks. Developed by Dr. Chaomi Chen, CiteSpace facilitates the analysis of emerging trends in a knowledge domain [4]. CiteSpace is part of the developing field of “knowledge domain visualization” aimed at creating a picture of how science grows and evolves over time [18]. “Compared with earlier visualizations, the new methods in CiteSpace have improved the clarity and interpretability of visualizations” [16]. CiteSpace supports collaboration networks of co‐authors, institutions and countries, document co‐citation networks, concept networks of noun phrases and keywords, and hybrid networks that consist of multiple types of nodes and links [9]. CiteSpace reduces the number of links that must
be shown and weights the remaining ones, thereby preserving the network’s basic structure.
We analyzed the data using two‐year time slices, making altogether 16 slices for the entire period of 1979‐2009. In each time slice, a co‐citation network was constructed based on the co‐citation instances made by the top 30 most cited records published in the corresponding time interval and the threshold values.
3.
Findings and Discussion
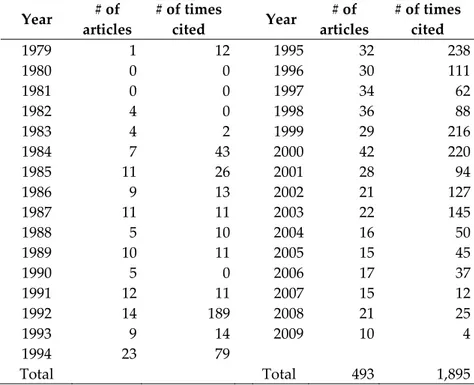
Table 1 provides descriptive statistics on papers on electronic publishing that appeared in professional literature between 1979 and 2009. During this period, a total of 493 papers with “electronic publishing” or “e‐publishing” or “digital publishing” in their topics were published and they were cited 1,895 times. On the average, 16 papers appeared on electronic publishing annually (SD = 11) and they received 61 citations (SD = 72).
Table 1: Number of articles and citations on electronic publishing (1979-2009)
Year # of articles # of times cited Year # of articles # of times cited 1979 1 12 1995 32 238 1980 0 0 1996 30 111 1981 0 0 1997 34 62 1982 4 0 1998 36 88 1983 4 2 1999 29 216 1984 7 43 2000 42 220 1985 11 26 2001 28 94 1986 9 13 2002 21 127 1987 11 11 2003 22 145 1988 5 10 2004 16 50 1989 10 11 2005 15 45 1990 5 0 2006 17 37 1991 12 11 2007 15 12 1992 14 189 2008 21 25 1993 9 14 2009 10 4 1994 23 79 Total Total 493 1,895
While the number of papers and citations thereto were not high between 1979 and 1993 (average of 7 papers and 23 citations per year), they have increased considerably between 1994 and 2000 (average of 32 papers and 145
citations per year). This is probably due to the fact that the number of Internet and Web users proliferated in early 1990s when the Internet became available outside the academia, thereby increasing both the number of e‐ publishing activities and papers engendered therefrom. The increase has slowed down after the year 2000 (average of 18 papers and 60 citations per year), which can perhaps be explained by the appearance of more specific papers on e‐publishing indexed under more specific keywords. Fig. 1: A document co‐citation network of electronic publishing (1979‐2009) Figure 1 shows a document co‐citation network derived from the citing behavior of authors writing on e‐publishing. This network is the result of merging 15 two‐year and 1 one‐year (2009) document co‐citation networks generated by the WoS dataset (1979‐2009). It consists of 409 papers that have been cited by two or more e‐publishing articles and 1,096 co‐citation links. Each co‐citation link represents at least three co‐citations. Citations made in earlier years are shown in blue links, mid‐range years in green and yellow, and recent years in orange. The colors of co‐citation links depict the earliest year in which the connection between two documents was made for the first time. For example it is quite possible that papers published in the 1980s were not co‐cited until 1990s [20].
Structurally strategic nodes can easily be identified in Figure 1 [21]. Tenopir and King’s book (2000) on electronic journals appears to be the most prominent source as it was cited the most. Journal articles on e‐publishing by Harnad (“Scholarly skywriting”, 1990), Schauder (“Electronic publishing of
professional articles”, 1994) and Ginsparg (“First steps towards electronic research communication”, 1994) were the second most highly cited articles in the network. These four sources started to get cited soon after publication and still continue to be cited today, as the outer orange rings indicate.
In Figure 1, we see three distinct clusters in the network. (These three clusters are shown in detail in Figures 2, 3 and 4). We have already pointed out the strategic nodes of Tenopir‐2000, Harnad‐1990, Schauder‐1994 and Ginsparg‐1994 at the middle of the network. Figure 2 shows the middle and upper left‐hand cluster in Figure 1 in more detail. Figure 2 comprises papers with mainly green links, indicating that this cluster was formed between 1991 and 2002. Papers in this cluster (e.g., Tenopir‐2000, Harnad‐1990, Schauder‐ 1994, Ginsparg‐1994) have also been cited after 2002. Rawlins‐1993, Turoff‐ 1982, and Lancaster‐1978 have not been cited after 2003. Tenopir‐2000, Harnad‐1990 and Ginsparg‐1994 provide connection with the recently formed upper right‐hand part of the network (see Fig. 3). To put it differently, they were cited by papers in this cluster whose centroid is represented by Lawrence’s seminal letter (“Online or Invisible?”) that appeared in the journal
Nature in 2001. The linkage between the two clusters was formed in 2001‐2002
time slice, which roughly corresponds to the rise of open access debate in early 2000s. The debate was (and, to some extent, still is) centred on the potential impact of e‐publishing through open access e‐journals in terms of use and citations exemplified in Antelman‐2004 (“Do open access articles have a greater research impact?”) and Kurtz‐2005 (“The effect of use and access on citations”), for example. Fig. 2: The middle and upper left‐hand part of network in Figure 1 in detail
The cluster in the upper right‐hand part of the network seems to have been formed recently, as the prevalent orange and red rings indicate. This part shows the most recent active area of e‐publishing field. Sources in that cluster were cited mostly after 2005. This part of the network shown in detail in Figure 3 represents an evolving thread and contains highly cited articles by Lawrence‐2001, Antelman‐2004, Kurtz‐2005, Miller‐2004, Odlyzko‐2002, Swan‐2005, and Jones‐2006. The first paper published by Lawrence‐2001, was first cited in 2001 and heavily cited after 2005, whereas the Kurtz‐2005 paper was not cited between 2007 and 2009. Figure 3: The upper right‐hand part of the network in Figure 1 in detail. Figure 4 shows the lower part of the network that was formed starting from 1988. Note that the seminal article by Vannevar Bush (“As we may think”, 1945) is one of the nodes connecting two clusters in the network and continued to be cited until 2006. Also, papers by Odlyzko and Negroponte have been cited up until recent years. We can see a dense cluster in yellow on the left‐hand side next to the Bush’s 1945 paper. This cluster was formed in 2003‐2004 time slice and contains papers by Negroponte‐1995, Ormes‐2001, Crawford‐2000, Hawkins‐2000, and Sottong‐2001.
We also carried out a network analysis of authors contributing to e‐ publishing literature (author co‐citation analysis) (Fig. 5). The network contains 340 authors cited by the e‐publishing dataset and 1091 co‐citation links. The largest connected component of this network is densely connected and therefore it is difficult to identify sub‐networks, even if they exist. (See Fig. 6 for the blow up of the densest part of Fig. 5.) Increasing the threshold value does not help much in this respect, as “meaningful pairwise associations are broken” and related authors “appear in different components“ [5].
Figure 4: The lower part of the network in Figure 1 in detail Figure 5: An author co‐citation network (1979‐2009), including 340 cited authors and 1091 co‐citation links.
The size of a node is proportional to the number of e‐publishing articles one has published. The colors of tree‐rings indicate the temporal patterns of an author. For example, Harnad has the largest citation circle. On the other hand, the author co‐citation map conveys additional information about how these authors have been cited. The nodes of Harnad and Lancaster have purple rings, indicating that they are pivotal nodes in the network with the
highest betweenness centrality. In other words, they are strategically important in pulling other nodes together [20]. The same can be said, to a lesser extent, for the nodes of Garfield and King. The citation tree‐ring of Harnad shows thick layers of green‐orange rings, indicating that the majority of citations to Harnad were received in recent years (e.g., 2000s). The open access expert Stefan Harnad, the founder of arXiv Paul Ginsparg and Ann Okerson of Yale University Libraries are usually co‐cited.
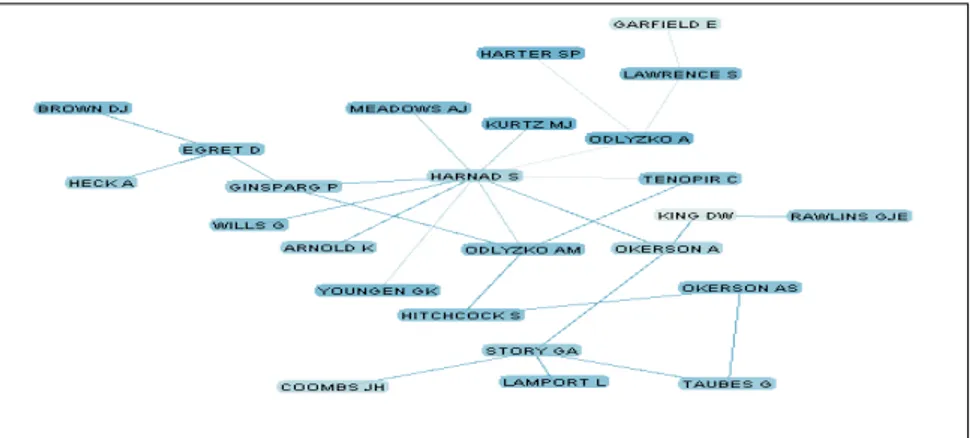
The prominent nodes are dominated by green citation rings (see Fig. 6). This pattern suggests that these authors frequently published e‐publishing papers in the green time slices, which corresponds to the 1990s and first years of 2000s. The outermost authorship tree‐rings of most of the authors are orange, suggesting that many of these authors continue to publish papers that continue to be cited. The names of those authors can be seen in Figure 7 along with linkages among them.
Fig. 6: The densest part of the author co-citation network (1979-2009) in Fig. 5.
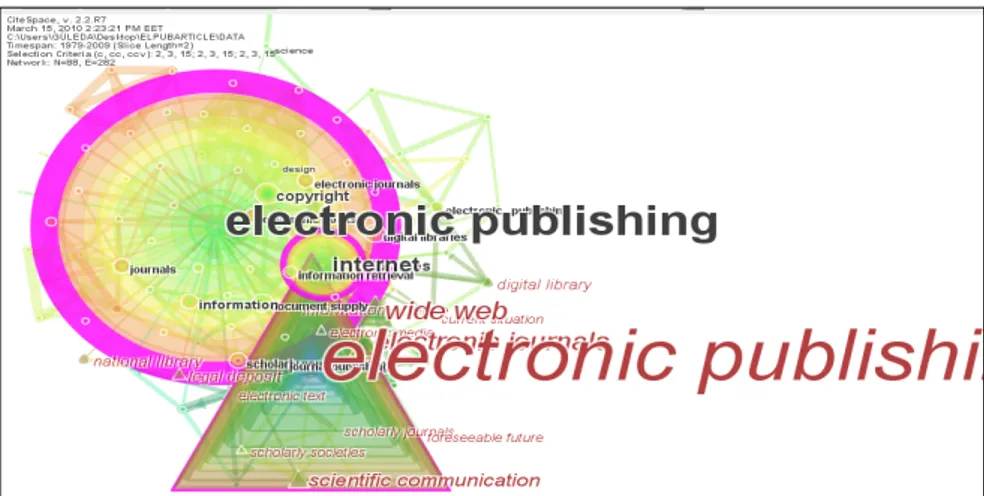
Fig. 8: A hybrid networks of keywords (shown as circles with black labels) and noun phrases (shown as triangles with dark red labels) (1979‐2009)
Figure 8 shows a hybrid network of keywords as circles and noun phrases as triangles, extracted from titles and abstracts of papers. A noun phrase consists of a noun and adjective(s). Pivotal nodes are shown with purple rings (e.g., electronic publishing, internet).
Figure 9 draws a minimum spanning tree using the hybrid network of keywords and noun phrases in Figure 8. Keywords represent more general topics whereas noun phrases represent microscopic analysis. So, the hybrid map of keywords and noun phrases is expected to reveal concrete connections at different granularity levels [20]. The inclusion of the map is to provide an overall orientation of the conceptual structure of papers on e‐publishing. Fig. 9: A concept map of keywords assigned by authors to their own papers and noun phrases extracted from titles and abstracts of papers. Citespace thresholds: 3,3,15; 3,3,20; 3,3,20
This map includes hubs of electronic publishing, internet and research funding. Internet and research funding are interconnected with electronic publishing. The hub of electronic publishing is connected to other keywords or noun phrases such as open access, copyright and electronic books; the hub of internet is connected to electronic books, information, information retrieval, information technology and so on. Concept maps can be useful to identify specific terms that are closely related with the field of e‐publishing [20].
4. Conclusion
We have analyzed the structure and evolution of electronic publishing field through articles published between 1979 and 2009 using co‐citation networks derived from CiteSpace. Findings of our study show that e‐publishing is an emerging research field. The three most prominent sources in e‐publishing field are Tenopir and King’s book (“Towards Electronic Journals: Realities for Scientists, Librarians, and Publishers”, 2000), Harnad’s article (“Scholarly skywriting and the prepublication continuum of scientific inquiry”, 1990) and Schauder’s article (“Electronic Publishing of Professional Articles: Attitudes of Academics and Implications for the Scholarly Communication Industry”, 1994). There is a recently formed part of the network that represents “open access”. The open access evangelist Stefan Harnad seems to be the most influential author. Open access, e‐journals, e‐books, digital libraries are among the major research tracks in e‐publishing as indicated in the hybrid map of keywords and noun phrases. Findings of this study can be used to identify landmark papers along with their impact in terms of providing different perspectives and engendering new research areas.
Notes and References
[1] JIANHUA, H; et al. The information visualization analysis of the study in international S&T policy. Proceedings of the Fourth International Conference on Webometrics, Informetrics and Scientometrics & Ninth COLLNET Meeting, Berlin, 2008. Available at http://www.collnet.de/Berlin‐2008/HouJianhuaWIS2008iva.pdf
(January 2010)
[2] ESTABROOKS, CA; et al. The intellectual structure and substance of knowledge utilization field: A longitudinal author co‐citations analysis, 1945 to 2004. Implementation Science, 3, 2008, p. 49. Available at http://www.implementationscience.com/content/3/1/49 (January 2010)
[3] MOED, HF. Citation analysis in research evaluation. Netherlands: Springer, 2005
[4] CHEN, C. Searching for intellectual turning points: Progressive knowledge domain visualization. Proceedings of the National Academy of Sciences of the USA (PNAS), 101 (Suppl.(1)), 2004, p. 5303‐ 5310. Available at
http://www.pnas.org.content/101/suppl.1/ 5303.full.pdf (January 2010). [5] EGGHE, L; ROUSSEAU, R. Introduction to informetrics: Quantitative
methods in library, documentation and information science. Amsterdam:
Elsevier Science Publishers, 1990. p. 239. Available at http://uhdspace.uhasselt.be/dspace/handle/1942/587 (April 2010). [6] WHITE, HD; MCCAIN, KW. Visualizing a discipline: An author co‐
citation analysis of information science, 1972‐1995. Journal of the American Society for Information Science, 49, 1998, p. 327‐355. p. 327. [7] HE, Q. Knowledge discovery through co‐word analysis. Library
Trends, 48 (1): 133‐159, 1999. p. 133.
[8] ÅSTRÖM, F. Visualizing Library and Information Science concept spaces through keyword and citation based maps and clusters. In: Bruce, Fidel, Ingwersen & Vakkari (Eds). Emerging frameworks and methods: Proceedings of the fourth international conference on conceptions of Library and Information Science (CoLIS4), 2002, p. 185‐ 197. Greenwood Village: Libraries Unlimited. (as cited in http://www.db.dk/bh/Core%20Concepts%20in%20LIS/articles%20a‐ z/coword_analysis.htm).
[9] CHEN, C; et al. Visual analysis of scientific discoveries and knowledge diffusion. Proceedings of the 12th International Conference on Scientometrics and Informetrics (ISSI 2009). July 14‐17, 2009. Rio de
Janeiro, Brazil. Available at
http://cluster.cis.drexel.edu/~cchen/papers/2009/issi2009/issi2009.pdf (January 2010).
[10] PETERSON, I. Mapping scientific frontiers. Science News Online, 165 (11), 2004. Available at http://cluster.cis.drexel.edu/~cchen/citespace/doc/mathtrek.pdf (January 2010). [11] CHEN, C; et al. Making sense of the evolution of a scientific domain: A visual analytic study of the Sloan Digital Sky Survey research. Scientometrics, in press (DOI 10.1007/s11192‐009‐0123‐x). Available at http://www.springerlink.com/content/46661328402643l0/fulltext.pdf (April 2010). [12] CHEN, C; et al. Towards an explanatory and computational theory of scientifiv discovery. Journal of Informetrics, 3 (3), 2009, p. 191‐209.
Available at http://arxiv.org/ftp/arxiv/papers/0904/0904.1439.pdf (April 2010). [13] CHEN, C; et al. The structure and dynamics of co‐citation clusters: A multiple‐perspective co‐citation analysis. Journal of the American Society for Information Science and Technology, in press (DOI: 10.1002/asi.21309). Available at http://www3.interscience.wiley.com/cgi‐ bin/fulltext/123324662/PDFSTART (April 2010). [14] OTTE, E; ROUSSEAU, R. Social network analysis: A powerful strategy, also for the information sciences. Journal of Information Science, 28, 2002, p. 443–455.
[15] SCOTT, J. Social network analysis: A handbook (second ed.). Thousand Oaks, CA: Sage Publications, 2000.
[16] CHEN, C. CiteSpace II: Detecting and visualizing emerging trends and transient patterns in scientific literature. Journal of the American Society for Information Science and Technology, 57 (3), 2006, p. 359‐ 377. Available at
http://cluster.cis.drexel.edu/~cchen/citespace/doc/jasist2006.pdf (January 2010).
[17] Sentinel Visualizer. Social network analysis (SNA), 2009. Available at http://www.fmsasg.com/SocialNetworkAnalysis/ (January 2010). [18] DELL, H. Mapping intellectual milestones. BioMedNet: Special Report. Available at: http://cluster.cis.drexel.edu/~cchen/citespace/doc/biomednet.pdf (January 2010) [19] One of the reviewers commented that papers published in proceedings of ELPUB conferences should be included in our sample. However, this was not possible in that metadata, references and citations of ELPUB papers were not readily available and they would have to be pre‐processed in order for them to be entered into CiteSpace software. [20] CHEN, C; et al. The thematic and citation landscape of Data and Knowledge Engineering (1985‐2007). Data and Knowledge Engineering, 67, 2008, p. 234‐259.
[21] Details for all papers in Figures 1‐4 are given in Appendix.
Appendix: Papers depicted in the network clusters and mentioned in the text
Antelman, K. (2004). Do open access articles have a greater research impact? College and Research Libraries, 65 (5): 372‐382.
Bush, V. (1945). As we may think. The Atlantic Monthly, 176 (1): 101‐108.
Crawford, W. (2000). Nine Models, One Name: Untangling the e‐book Muddle. American Libraries, 31, 56‐9.
Harnad, S. (1990) . Scholarly skywriting and the prepublication continuum of scientific inquiry. Psychological Science, 1, 342–344.
Jones, R., Andrew, T., & MacColl, J. (2006). The Institutional Repository. Oxford: Chandos.
Ginsparg, P. (1994). First Steps Towards Electronic Research Communication. Computers in Physics, 8 (4): 390‐396.
Hawkins, D.T. (2000). Electronic books: a major publishing revolution (part 1). Online, 24 (4): 14‐28.
Kurtz, M.J..et al. (2005). The effect of use and access on citations. Information Processing & Management, 41, 1395‐1402.
Lancaster, F.W. (1978). Toward Paperless Information Systems. Orlando, FL: Academic Press.
Lawrence, S. (2001). Online or invisible? Nature, 411 (6837): 521.
Miller C.T., & Harris, J. C. (2004). Scholarly Journal Publication: Conflicting Agendas for Scholars, Publishers, and Institutions. Journal of Scholarly Publishing, 35 (2): 73‐91.
Negroponte, N. (1995). Being Digital. New York: Alfred A. Knopf.
Odlyzko, A.M. (1995). Tragic loss or good riddance? The impending demise of traditional scholarly journals. International Journal of Human‐Computer Studies, 42, 71–122.
Ormes, S. (2001). An e‐book primer, available at:
www.ukoln.ac.uk/public/earl/issuepapers/ebook.htm
Rawlins, G.J.E. (1993). Publishing over the Next Decade. Journal of the American Society for Information Science, 44 (8): 474‐479.
Schauder, D. (1994). Electronic Publishing of Professional Articles: Attitudes of Academics and Implications for the Scholarly Communication Industry. Journal of the American Society for Information Science, 45, 73‐100.
Sottong, S. (2001). E‐book technology: Waiting for the false pretender. Information Technology and Libraries, 20 (2): 72‐80.
Swan, A. (2005) Open access self‐archiving: An Introduction. Technical Report UNSPECIFIED, JISC, HEFCE.
Tenopir, C., & King, D.W. (2000). Towards Electronic Journals: Realities for Scientists,
Librarians, and Publishers. Washington, D.C.: Special Libraries Association.
Turoff, M., & Hiltz, S.R. (1982). The Electronic Journal: A Progress Report. Journal of the American Society for Information Science, 33 (4): 195‐202.