Carsten Agert, Peter S Gladkov and Andreas W Bett
Semicond. Sci. Technol. 14 (1999) 599–603. Printed in the UK PII: S0268-1242(99)01157-8
Radiative donor–acceptor pair
recombination in TlInS
2
single
crystals
A Aydınlı
†§
, N M Gasanly‡k
, ˙I Yılmaz‡
and A Serpengu¨zel†
† Physics Department, Bilkent University, 06533 Ankara, Turkey
‡ Physics Department, Middle East Technical University, 06531 Ankara, Turkey E-mail: [email protected]
Received 21 January 1999, accepted for publication 13 April 1999
Abstract. Photoluminescence (PL) spectra of TlInS2 layered single crystals were investigated
in the 500–860 nm wavelength region and in the 11.5–100 K temperature range. We observed two PL bands centred at 515 nm (2.41 eV, A band) and 816 nm (1.52 eV, B band) at T = 11.5 K and an excitation intensity of 7.24 W cm−2. A detailed study of the A band was carried out as a function of temperature and excitation laser intensity. A red shift of the A band position was observed for both increasing temperature and decreasing excitation laser intensity in the range from 0.12 to 7.24 W cm−2. Analysis of the data indicates that the A band is due to radiative transitions from the moderately deep donor level located at 0.25 eV below the bottom of the conduction band to the shallow acceptor level located at 0.02 eV above the top of the valence band. An energy-level diagram for radiative donor–acceptor pair transitions in TlInS2 layered single crystals is proposed.
1. Introduction
Much interest has recently focused on condensed matter systems with low dimensionality. The family of crystals designated as A3B3C6
2 exhibit quasi low dimensionality in the form of layered and chain structures and have become increasingly attractive owing to their interesting structural properties and potential optoelectronic applications [1]. Members of this family of crystals designated with the chemical formula TlBX2 (where B = In or Ga, X = S, Se or Te) are known as thallium dichalcogenides. They have both layered (TlGaS2, TlGaSe2, TlInS2) and chain (TlInSe2, TlInTe2, TlGaTe2) structures.
Among many TlBX2-type compounds, TlInS2 has been studied rather well. This compound has attracted widespread attention for its structural [2], electrical [3] and optical [4–6] properties. At room temperature, TlInS2 belongs to the monoclinic system with space group C2/c and is arranged in
the form of layered structure with a 1:1 ratio of InS:TlS. The lattice of TlInS2 crystals consists of alternating twodimensional layers parallel to the (001) plane with each successive layer turned through a right angle with respect to the preceding layer [2]. The fundamental structural unit of a layer is the In4S10 polyhedron representing a combination of four elementary InS4 tetrahedra linked together by bridging S atoms. The combination of the In4S10 polyhedra into a layer results in trigonal prismatic voids where Tl atoms are § To whom all correspondence should be addressed. k On leave from Physics Department, Baku State University, Baku,
Azerbaijan.
0268-1242/99/070599+05$19.50 © 1999 IOP Publishing Ltd located. Tl atoms form nearly planar chains along the [110] and [110]¯ directions. Hence the number of layers within the unit cell is more than one.
599 In the last 10 years, interest in the optical properties of
TlInS2 has been extensive. Both infrared reflection spectroscopy [7,8] and Raman scattering [9] from TlInS2 have been studied as a function of temperature. A number of photoluminescence (PL) bands have been observed at 1.8 K inTlInS2 singlecrystals. Theywereattributedtotheradiative recombinationoffreeandboundexcitons[10]. In[11]thePL bands due to excitons have been observed in the temperature range 5.5–100 K. Temperature dependences of the intensities of these bands were interpreted by a variation in the crystal structure and the coexistence of several polytypes. The forbidden gap of TlInS2 was measured by both absorption and reflection spectroscopy as a function of temperature and was found to be a direct bandgap with an energy of 2.58 eV at T = 10 K [6,12]. In our previous paper [13] we have investigated and analysed the temperature and excitation dependences of radiative excitonic recombination in TlInxGa1−xS2 layered crystals, where no luminescence was observed below x = 0.8.
In this work, we concentrate on a systematic experimental study of PL spectroscopy in TlInS2 single crystals in the 11.5–100 K temperature range and in the wavelength region 500–860 nm, on the lower-energy side of the excitonic emission spectrum, in an effort to identify the nature of transitions in this region. The PL spectra and their temperature and excitation intensity dependences were studied in detail in order to propose a model for the A Aydınlı et al
recombination process of photoexcited carriers and a scheme for the impurity levels. The analysis of the data indicates that one of the observed PL peaks is due to donor–acceptor pair recombination.
2. Experimental details
TlInS2 polycrystals were synthesized from particularly highpurity elements (at least 99.999%) taken in stoichiometric proportions. Single crystals of TlInS2 were grown from the melt by the Bridgman technique. The x-ray diffraction patterns show that these crystals have monoclinic structure with the lattice parameters a = 1.0942 nm, b = 1.0484 nm, c = 1.5606 nm and β = 100.70◦. Crystals suitable for measurements were obtained by easy cleavage along the (001) plane perpendicular to the optical c-axis. In the PL measurements, samples of a typical size 6×3×2 mm3 were used. All the studied samples were p-type as determined by the hot probe method. The PL was excited by the 476.5 nm (2.60 eV) line of a Spectra-Physics argon ion laser parallel to the c-axis. To minimize the possibility of laser beam induced heating a cylindrical focusing lens with a focal length of 20 cm was used in front of the sample. The emission was collected in the backscattering geometry from the face of the crystal. The surface of the sample was freshly cleaved just prior to loading it onto the cold finger of a
CTI-Cryogenics
M-22closed-cycleheliumcryostatandthesamplewascooled down to 11.5 K. The temperature was controlled within an accuracyof±0.5KusingaLakeshoretemperaturecontroller. The PL spectra were dispersed with a U-1000 Jobin–Yvon
double-grating spectrometer and detected by a cooled GaAs photomultiplier using standard photon counting electronics. The PL spectra have been corrected for the spectral response of the optical apparatus. A set of calibrated neutral-density filters was used to change the intensity of the excitation laser intherangefrom0.12to7.24Wcm−2. Thesepowerdensities are the average values of the laser intensity over the Gaussian profile of the laser beam.
3. Results and discussion
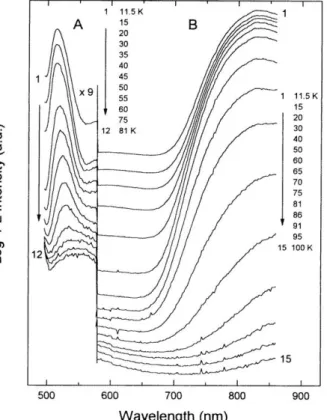
Figure 1 shows the typical nonexcitonic PL spectra of TlInS2 single crystals as measured in the 500–860 nm wavelength region and in the 11.5–100 K temperature range. The data in the 500–580 nm region have been multiplied by a factor of 9 for clarity. The excitation laser intensity was constant at 7.24 W cm−2. We observed two bands (A and B): the A band is centred at 515 nm (2.41 eV) and the B band is located in the near-infrared region of the spectra starting from 670 nm and extending beyond 860 nm, which is the limit of our detection range. For this reason, we did not carry out a detailed study of the B band. However, from the measured spectral shape of the band, we infer that it is centred at 816 nm (1.52 eV). The A band has a FWHM of about 0.135 eV and has a Gaussian lineshape with slight asymmetry. These features are typical of emission bands due to donor–acceptor pair transitions observed in ternary compounds [14]. We also note that, for both the A and the B bands, the peak energy position and the emission band intensity change with temperature. A and B bands disappear at 81 K and 100 K, respectively.
Figure 1. PL spectra of TlInS2 in the 11.5–100 K temperature
range. Excitation laser intensity L = 7.24 W cm−2. The data in the 500–580 nm region have been multiplied by 9 for clarity.
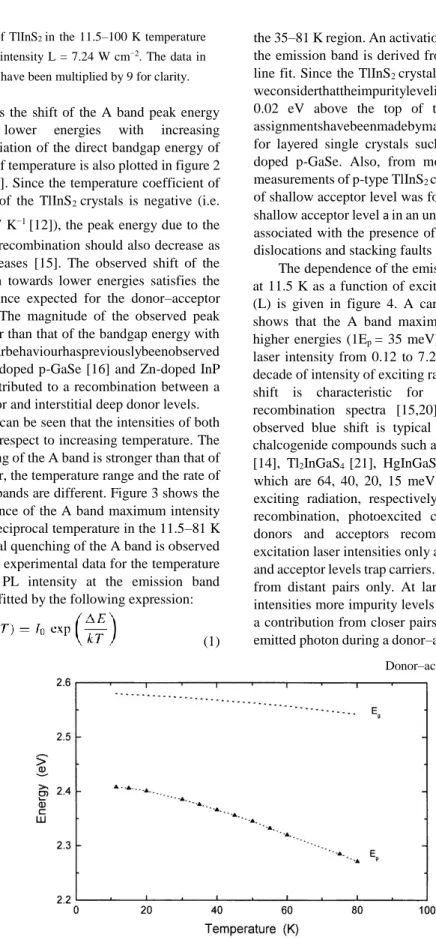
Figure 2 presents the shift of the A band peak energy position towards lower energies with increasing temperature. The variation of the direct bandgap energy of TlInS2 as a function of temperature is also plotted in figure 2 for comparison [6,12]. Since the temperature coefficient of the bandgap energy of the TlInS2 crystals is negative (i.e. dEg/dT = −5×10⁻⁴ eV K−1 [12]), the peak energy due to the donor–acceptor pair recombination should also decrease as the temperature increases [15]. The observed shift of the peak energy position towards lower energies satisfies the temperature dependence expected for the donor–acceptor pair recombination. The magnitude of the observed peak energy shift is greater than that of the bandgap energy with temperature. Similarbehaviourhaspreviouslybeenobserved in PL studies of Ag-doped p-GaSe [16] and Zn-doped InP [17] and has been attributed to a recombination between a substitutional acceptor and interstitial deep donor levels.
From figure 1 it can be seen that the intensities of both bands decrease with respect to increasing temperature. The temperature quenching of the A band is stronger than that of the B band. Moreover, the temperature range and the rate of quenching for these bands are different. Figure 3 shows the temperature dependence of the A band maximum intensity as a function of the reciprocal temperature in the 11.5–81 K range. A rapid thermal quenching of the A band is observed above T = 35 K. The experimental data for the temperature dependence of the PL intensity at the emission band maximum (I) can be fitted by the following expression:
(1)
guides for the eye.
where I0 is a proportionality constant, 1E the thermal activation energy and k the Boltzmann constant. The semilogarithmic plot of the emission band intensity as a function of the reciprocal temperature gives a straight line in
the 35–81 K region. An activation energy of Ea = 0.02 eV for the emission band is derived from the slope of the straight line fit. Since the TlInS2 crystal is a p-type semiconductor, weconsiderthattheimpuritylevelisanacceptorlevellocated at 0.02 eV above the top of the valence band. Similar assignmentshavebeenmadebymanyauthorsintheliterature for layered single crystals such as Ag- [16] or Cu- [18] doped p-GaSe. Also, from modulated photoconductivity measurements of p-type TlInS2 crystals the activation energy of shallow acceptor level was found to be 0.028 eV [19]. A shallow acceptor level a in an undoped TlInS2 crystal may be associated with the presence of unintentional impurities or dislocations and stacking faults [18].
The dependence of the emission band peak energy (Ep) at 11.5 K as a function of excitation laser energy intensity (L) is given in figure 4. A careful inspection of the data shows that the A band maximum shifts towards slightly higher energies (1Ep = 35 meV) with increasing excitation laser intensity from 0.12 to 7.24 W cm−2 (i.e. 20 meV per decade of intensity of exciting radiation). The observed blue shift is characteristic for the donor–acceptor pair recombination spectra [15,20]. The magnitude of the observed blue shift is typical of ternary and quaternary chalcogenide compounds such as AgGaS2
[14], Tl2InGaS4 [21], HgInGaS4 [22], CuIn1−xGaxSe2 [23], which are 64, 40, 20, 15 meV per decade of intensity of exciting radiation, respectively. In donor– acceptor pair recombination, photoexcited carriers trapped at ionized donors and acceptors recombine radiatively. At low excitation laser intensities only a small fraction of the donor and acceptor levels trap carriers. This leads to recombination from distant pairs only. At large enough excitation laser intensities more impurity levels trap carriers which leads to a contribution from closer pairs as well. The energy of the emitted photon during a donor–acceptor pair transition has a
positive contribution from a Coulombic interaction between ionized impurities. This contribution increases as theseparationbetweenthepairsdecreases[20]. Furthermore, radiative transition probabilities for different pair separations are different and decrease exponentially as a function of the pair distance [14]. We, therefore, observe a Donor–acceptor recombination in TlInS2
601 shift of the emission band peak energy to higher energy as
the intensity of the excitation laser increases.
The plot in figure 4 shows the excitation laser intensity (L) as a function of the A band peak energy (Ep) at 11.5 K. The experimental data in figure 4 are then fitted by the following expression:
whereL0 isaproportionalityconstant, EB theemittedphoton energy of a close donor–acceptor pair separated by a shallow impurityBohrradius(RB)andE∞ theemittedphotonenergy of an infinitely distant donor–acceptor pair [24]. From a nonlinear least-squares fit to the experimental data, the photon energy values for an infinitely distant donor– acceptor pair and a close donor–acceptor pair separated by RB are found to be E∞ = 2.31 eV and EB = 2.53 eV, respectively. These limiting photon energy values are in good agreement with the bandgap energy (Eg = 2.58 eV) and the observed values of the peak energy position (i.e. E∞ < 2.37 eV <
Ep < 2.41 eV < EB < Eg) at 11.5 K.
Finally, we have also studied the variation of the emission A band maximum intensity versus the excitation laser intensity. Excluding the saturation region at the highest intensities, the experimental data can be fitted by the simple power law of the form
I ∝ Lγ (3)
where I is the PL intensity, L is the excitation laser intensity and γ is a dimensionless exponent. It was found that the PL intensity at the emission band maximum increases sublinearly (i.e. γ = 0.97) with respect to the excitation laser intensity (figure 5). Saturation starts at L > 2.06 W cm−2. It is well known that for an excitation laser photon with an energy exceeding the bandgap energy
A Aydınlı et al
Figure 3. Temperature dependence of PL intensity at the A band of TlInS2. The arrow shows the starting point of the intensive
quenching.
Figure 4. Excitation laser intensity versus A band peak energy at T = 11.5 K. The full curve gives the theoretical fit using equation (2).
Eg, the coefficient γ is generally 1 < γ < 2 for the free- and bound-exciton emission, and γ 6 1 for free-to-bound and donor–acceptor pair recombinations [25]. Thus, the obtained value of γ = 0.97 further confirms our assignment of the observed A band in TlInS2 spectra to donor–acceptor pair recombination.
The analysis of the observed PL spectra as a function of temperature and excitation laser intensity allows us to propose a possible scheme for the donor–acceptor levels located in the forbidden energy gap of the TlInS2 crystal. These donor–acceptor levels are involved in the radiative recombination of the photoexcited carriers observed in this work. In the proposed scheme, a shallow acceptor level a is located at 0.02 eV above the top of the valence band. On the
602
Figure 5. Dependence of the PL intensity at the A band maximum versus excitation laser intensity at T = 11.5 K. The full curve gives the theoretical fit using equation (3).
basis of a general expression for the emission energy of a donor–acceptor pair [20] and taking into account Eg and E , the sum of the activation energies of the donor (Ed)
∞
and acceptor (Ea) levels has been estimated as Ed +Ea = Eg −E∞ = 2.58 eV−2.31 eV = 0.27 eV. (4) Consequently, a donor level d, located at 0.25 eV below the bottom of the conduction band, is introduced into the forbidden energy gap of TlInS2. From thermally stimulated current measurements the activation energies of moderately deep donor levels in p-type TlInS2 were found to be 0.22 eV [26] and 0.28 eV [27]. We propose that the moderately deep donor level in the p-type TlInS2 layered crystal is associated with dislocations or stacking faults. Because of the weakness of the forces (van der Waals) between adjacent layers, creation of such extended defects is relatively easy in these materials. Similarly, moderately deep donor levels were also revealed in p-type GaSe layered crystals [16,18].
Taking into account the above assignments, the observed A band emission has been attributed to the radiative recombination of an electron occupying a donor level d (Ed = 0.25 eV) and a hole occupying an acceptor level a (Ea = 0.02 eV).
4. Conclusions
The experimental data obtained from the PL study of TlInS2 single crystals in the 500–860 nm wavelength and in the 11.5–100 K temperature range show that the PL intensities of the A and B bands decrease with increasing temperature. Rapid thermal quenching of the A band is observed above T = 35Kindicatingthepresenceofashallowimpurity. This behavior was understood in terms of a shallow acceptor level located at 0.02 eV above the valence band in p-type TlInS2. A moderately deep donor level located at 0.25 eV below the conduction band is then introduced into the energy-band diagramofTlInS2 crystal. Theseobtainedvaluesofthedonor and acceptor activation energies are consistent with available data obtained by other methods. The blue shift of
the A band peak energy with increasing excitation laser intensity is explained using the inhomogenously spaced donor–acceptor pair model. Also, the intensity of the A band increases sublinearly with respect to the excitation laser intensity and confirms our assignment that the observed A band in TlInS2 is due to donor–acceptor pair recombination.
References
[1] Yee K A and Albright A 1991 J. Am. Chem. Soc. 113 6474 [2] Muller D and Hahn H 1978 Z. Anorg. Allg. Chem. 438 258 [3] Hanias M P, Anagnostopoulos A N, Kambas K and
Spyridelis J 1992 Mater. Res. Bull. 27 25
[4] Abutalybov G I, Abdullaeva S G and Zeinalov N M 1982
Sov. Phys. Semicond. 16 1348
[5] Gasanly N M, Goncharov A F, Melnik N N, Ragimov A S and Tagirov V I 1983 Phys. Status Solidi b 116 427 [6] Kalomiros J A and Anagnostopoulos A N 1994 Phys. Rev. B
50 7488
[7] Allakhverdiev K, Akhmed-zade N, Tagyev M and Shirinov M 1989 Phys. Status Solidi b 152 317 [8] Allakhverdiev K, Akhmed-zade N, Tagyev M, Shirinov M
and Haisler S 1988 Phys. Status Solidi b 148 K93 [9] Kulbujev B, Rabkin Z, Torgashev V and Izuk Y 1988 Fiz.
Tverd. Tela 30 195
[10] Abdullaev G B, Abutalybov G I, Aliev A A, Larionkina L S, Neimanzade I K and Salaev E Yu 1983 JETL Lett. 38 632 [11] Arai T, Aoyagi J, Maryama Y, Onari S, Allakhverdiev K R
and Bairamova E 1993 Japan. J. Appl. Phys. 32 (suppl 3) 754
Donor–acceptor recombination in TlInS2
[12] Abutalybov G I, Aliev A A, Larionkina L S, Neimanzade I K and Salaev E Y 1984 Sov. Phys. Solid State 26 511 [13] Allakhverdiev K R, Gasanly N M and Aydınlı A 1995 Solid
State Commun. 94 777
[14] Leyris J P, Aicardi J P and Soule S 1983 J. Lumin. 28 65 [15] Pankove J I 1971 Optical Processes in Semiconductors
(Englewood Cliffs, NJ: Prentice-Hall) p 150
[16] Shigetomi S, Ikari T and Nakashima H 1997 Phys. Status
Solidi A 160 159
[17] Montie E A and van Gurp G J 1989 J. Appl. Phys. 66 5549 [18] Capozzi V 1983 Phys. Rev. B 28 4620
[19] Kalkan N, Papadopoulos D, Anagnostopoulos A N and Spydelis J 1993 Mater. Res. Bull. 28 693
[20] Yu P Y and Cardona M 1995 Fundamentals of
Semiconductors (Berlin: Springer) p 348
[21] Gasanly N M, Serpenguzel A, G¨ url¨ u O, Aydinli A and¨ Yilmaz I 1998 Solid State Commun. 108 525
[22] Anedda A, Casu M B, Serpi A, Barlakov I I, Tiginyanu I M and Ursaki V V 1997 J. Phys. Chem. Solids 58 325 [23] Bacewicz R, Dzierzega A and Trykozko R 1993 Japan. J.
Appl. Phys. 32 (suppl 3) 194
[24] Zacks E and Halperin A 1972 Phys. Rev. B 6 3072
[25] Schmidt T, Lischka K and Zulehner W 1992 Phys. Rev. B 45 8989
[26] Ozdemir S, Suleymanov R A, Civan E and Firat T 1996
Solid State Commun. 98 385
[27] Bakhyshov A E, Samedov S R, Benyamin M, Bagiev V E, Bules S and Tagirov V I 1978 Sov. Phys. Semicond. 12 320