Quantitatively Correct UV-vis Spectrum of Ferrocene with TDB3LYP
Ulrike Salzner*
Department of Chemistry, Bilkent University, 06800 Bilkent, Ankara, Turkey
ABSTRACT: The ultraviolet−visible light (UV-vis) absorp-tion spectrum of ferrocene is modeled with time-dependent density functional theory employing LSDA, BLYP, B3LYP,
and CAM-B3LYP functionals in combination with 6-31G*,
6-31+G*, CC-PVTZ, and aug-CC-PVTZ basis sets. With the
exception of LSDA, all functionals predict a reasonable Fe-CP
distance of ∼1.67 Å. Diffuse functions are essential for the
strongly allowed states at high energy but of lesser
consequence for the visible range of the spectrum. Dipole forbidden states are examined with vibrationally excited structures,
obtained from the normal modes of the infrared (IR) spectrum. Despite earlier claims, TDB3LYP predicts the UV−vis spectrum
of ferrocene quantitatively correct. TDBLYP predicts a large number of spurious charge-transfer states, TDCAM-B3LYP and TDwB97XD are correct in the low-energy region but overestimate the energy of strongest peak of the spectrum by 0.8 eV. The
amount of charge transfer involved in“d−d transitions” is equal to that in “charge-transfer states”.
■
INTRODUCTIONFerrocene was discovered in 19511and has revolutionized the
views of chemists about how metals bind to organicπ-systems.
Its electronic structure and ultraviolet-visible light (UV-vis)
absorption spectrum have become textbook2examples, and one
would assume that not much new can be said about them. However, comparison between results obtained with time-dependent density functional theory (TDDFT) by the author
and theoretical data from the literature3−15 revealed several
discrepancies, which prompted the present investigation. Pure ferrocene is a very stable light orange powder, and the
UV−vis absorption spectrum of ferrocene has been investigated
in detail.16−19Upon cooling, the color changes from orange to
lemon yellow.16,17 The orange color stems from a
dipole-forbidden absorption at 440 nm (2.81 eV) and a shoulder at
528 nm (2.34 eV),16−18 both of which gain oscillator strength
only through vibronic coupling.8 Outside the visible range, a
weak peak occurs at 324 nm (3.83 eV) and several relatively weak but allowed absorptions are present between 265 nm and 230 nm. The strongest absorption of ferrocene is observed at 202 nm (6.12 eV) in solution and 6.31 eV in the vapor
phase.16−19The oscillator strength of this allowed absorption is
350 times stronger than that of the peak at 440 nm.
B3LYP produces the structural parameters of ferrocene with
errors of 2 pm or less,20 and there is consensus that, in
agreement with experiment, theory predicts the eclipsed form to be more stable than the staggered one. Several authors have cautioned, however, against using B3LYP for excited-state
calculations of ferrocene.6,10,12,15Boulet et al.,6Li et al.,10and
Scuppa et al.12 promoted gradient-corrected pure DFT
functionals, and Fromager et al.15 promoted the
range-separated CAM-B3LYP functional. In this investigation,
TDDFT results with several functionals and different
all-electron basis sets are analyzed. It is demonstrated that B3LYP
works perfectly fine and that the differences between B3LYP
results and experiment found in earlier studies arise from
incorrect assignment of the excited states,6,10,12,15 use of
inadequate pseudopotentials,6 and that agreement between
theory and experiment at other levels of theory was
manipulated by using Cp−Fe distances that were too short.6,12
Based on ligand field theory, the low-energy peaks are
assigned to be d−d transitions and the stronger absorptions to
charge-transfer (CT) states.15,21Analysis of density differences
and charge differences on Fe between ground and excited states
reveals that low- and high-lying excited states involve similar amounts of charge transfer, so that the distinction between n
d−d and CT transitions21is not justified.
The paper is outlined as follows. First, the effects of structure,
solvent, theoretical method, and basis set are evaluated for the high-energy part of the spectrum. Second, vibrationally excited structures of ferrocene are obtained from frequency calculations and UV-vis spectra are predicted for distorted conformers. This allows identifying the peaks that become visible only upon vibration. Then the area between 4 and 6 eV, which includes the onset of allowed transitions, is investigated. Finally, the
electronic transitions are characterized with density difference
plots and natural population analysis.22
■
METHODSThe structure of ferrocene was optimized in eclipsed (D5h) and staggered (D5d) conformations. UV-vis spectra were calculated for both structures and for several lower symmetry
forms (Scheme 1) that were obtained from the first seven
vibrational modes of D5h ferrocene at the B3LYP/6-31+G*
level of theory.
UV-vis spectra were calculated with TDDFT. The number of excited states was increased until the strongly allowed excited
Received: April 19, 2013
Published: July 23, 2013
state that occurs experimentally at 6.31 eV with oscillator strength 0.69 in the vapor phase was found. The number of excited states required to reach the strongly allowed state depends on the level of theory and basis set and lies between 36
and 90. The functionals tested include LSDA,23,24 BLYP,25,26
B3LYP,26,27 CAM-B3LYP,28 and wB97XD.29 The basis sets
employed are 6-31G*, 6-31+G*, 6-311+G*, CC-PVTZ, and
aug-CC-PVTZ.30,31 Relativistic effects were not considered
because comparison with results of Scuppa et al.12 and
Fromager et al.,15who employed relativistic pseudo-potentials,
revealed no major differences. Solvent effects of methylene
dichloride were treated with the polarized continuum
method.32 All calculations are done with Gaussian 09.33 UV
spectra are generated with Gabedit.34The peaks are convoluted
with Lorentzian functions with peak widths at half-maximum of
0.05 eV. Orbitals and density differences are plotted with Gauss
View 5.
■
RESULTSEffect of Structure and Solvent on the Spectrum. The
eclipsed D5h ferrocene is 0.71 kcal/mol more stable than the
staggered D5d form at B3LYP/6-31G* and B3LYP/6-31+G*.
Thefirst vibrational mode, which rotates the cyclopentadienyl
(Cp) rings relative to each other, has a vibrational energy of 43
cm−1 at B3LYP/6-31+G*. Because of the small energy
difference between both forms and because of the low
vibrational energy, both forms are expected to be present at room temperature.
The distance between Fe and the Cp rings in the D5h
structure is 1.654 Å at B3LYP/6-31G*, 1.675 Å at
B3LYP/6-31+G*, and 1.690 Å at B3LYP/aug-CC-PVTZ, showing that
increasing the basis set increases the Fe−Cp distance. With the
6-31+G* basis set, the Fe−Cp distance is 1.675 Å with BLYP
and B3LYP, 1.660 Å with CAM-B3LYP/6-31+G*, and 1.645 Å
with wB97XD, indicating that increasing amount of Hartree−
Fock (HF) exchange decreases the Fe−Cp distance. These
values are in reasonable agreement with coupled cluster theory
(1.655 Å) and experiment (1.661 Å).5,20 LSDA/6-31+G*
predicts a Fe−Cp distance of 1.579 Å that is too short.
Figure 1 compares gas and solution phase absorption spectra
of D5h and D5d ferrocene at B3LYP/6-31+G*. There are no
allowed absorptions in the visible range for both forms. The first peak with low oscillator strengths occurs at 5.32 eV in
solution and at 5.59 eV in the gas phase. Solvent effects as
predicted with the polarized continuum model reduce the excitation energy of the main peak by 0.07 eV for D5h (0.09 eV for the D5d), which is about half of the experimental solvent
effect (0.11 eV−0.19 eV). The solvent effect on the oscillator
strength is exaggerated. Theory predicts increase of 0.41 for
both forms but the experimental solvent effect on the oscillator
strength is only 0.08.18It will be shown, throughout the paper,
that oscillator strength is also very sensitive to details of the basis set.
The main peak is observed for D5h ferrocene at 6.45 eV
(gas) and 6.38 eV (in CH2Cl2), and for D5d at 6.40 eV (gas)
and 6.31 eV (in CH2Cl2). The experimental values are 6.31 eV
in the vapor phase and 6.12 eV18 or 6.2019 in solution. The
oscillator strengths are larger by 0.08 for the D5d form in gas and solution phases. Hence, any presence of D5d ferrocene may cause peak broadenings or appear as shoulders in experimental spectra. The D5d form will not be considered further.
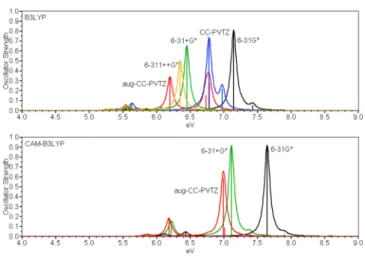
Effect of Basis Set Enlargement. The effect of basis set
enlargement at the B3LYP and CAM-B3LYP levels is seen in
Figure 2. Data with basis sets that include diffuse functions are
summarized in Table 1. B3LYP/aug-CC-PVTZ was taken as the reference for a tentative assignment of the allowed states to Scheme 1
Figure 1.UV spectra of gas phase and methylene dichloride solution
spectra of eclipsed (D5h) and staggered (D5d) ferrocene at the
B3LYP/6-31+G* level of theory.
Figure 2. Effect of basis set enlargement on the UV spectrum of
eclipsed (D5h) ferrocene with the B3LYP and CAM-B3LYP functionals.
Table 1. Excitation Energies (in eV) and Oscillator Strength (Given in Parentheses) of D5h Ferrocene a LSDA BLYP B3LYP CAM-B3LYP wB97XD Exp solution, 16 gas 18 Sym 6-31+G * (dFe ‑Cp = 1.579 Å) 6-31+G * (dFe ‑Cp = 1.675 Å) 6-31+G * (dFe ‑Cp = 1.675 Å) aug-CC-PVTZ (dFe ‑Cp = 1.690 Å) 6-31+G * (dFe ‑Cp = 1.660 Å) aug-CC-PVTZ (dFe ‑Cp = 1.674 Å) 6-31+G * (dFe ‑Cp = 1.645 Å) 2.35 16,18 (sh) 4e2 ′→ 5e1 ″ 3.47 2.66 2.26 2.18 2.27 2.20 2.41 Mode 5: 2.24 (0.0012) Mode 5: 2.16 (0.0012) 2.82 16,18 (0.0012) 18 4e2 ′+8a 1 ′→ 5e1 ″ 3.43 2.91 2.60 2.51 2.65 2.56 2.74 Mode 2: 2.61 (0.0044) Mode 3: 2.56 (0.0041) 3.83 16,18 (0.0034) 18 4e2 ′+8a 1 ′→ 5e1 ″ 4.08 3.54 3.45 3.35 3.53 3.42 3.65 Mode 7: 3.75 (0.0013) Mode 7: 3.75 (0.0012) 4.67 16,18 (0.025) 18 4.77 16 6e1 ′→ 5e1 ″ 5.26 5.21 5.72 5.67 5.84 Mode 5: 4.76 (0.0022) 4.83 (0.0186) Mode 5: 5.11 (0.0034) 5.18 (0.0192) 5.02/5.08 18 (0.0121) 4e2 ′→ 5e2 ′+6e 2 ′ 5.69 (0.0027) 4.91 (0.0053) 5.32 (0.0071) 5.26 (0.0054) 5.87 (0.0092) 5.84 (0.0078) 5.85 (0.0098) 5.23 18 (0.0121) 18 6e1 ′+4e 2 ′→ 5e1 ″+4e 2 ″ 5.25 (0.0083) 4.68 (0.0029) 5.59 (0.0459) 5.55 (0.0514) 6.22 (0.1553) 6.19 (0.1830) 6.30 (0.1123) 5.81 18 (0.104) 18 8a1 ′→ 7e1 ′ 4.95 (0.0281) 4.51 (0.0152) 6.05 (0.0113) 5.71 (0.0069) 7.07 (0.0101) 7.01 (0.0874) 7.32 (0.0101) 6.16 18 (0.001) 18 8a1 → 7a2 ″ 5.14 (0.0162) 4.61 (0.0135) 6.21 (0.0006) 5.85 (0.0046) 6.76 (0.0067) 6e1 ′→ 9a1 ′ 5.89 (0.0004) 7.23 (0.0022) 6.31 18 (0.691) 18 6e1 ′+4e 2 ′→ 5e1 ″+4e 2 ″+5e 2 ″ 6.33 (0.1948) 6.52 (0.2850) 5.56 (0.2450) 6.45 (0.6582) 6.20 (0.3360) 7.12 (0.90) 6.99 (0.5843) 7.26 (1.0878) 6.58 18 (0.04) 18 4e1 ″+6e 1 ′+8a 1 ′+4e 2 ′→ 7e1 ′+5e 1 ″+6e 1 ″+8a 2 ″ 6.27 (0.6807) 7.04 (0.1110) 6.73 (0.1535) 4e1 ″+6e 1 ′+8a 1 ′+4e 2 ′→ 7e1 ′+5e 1 ″+6e 1 ″+8a 2 ″+5e 2 ″+6e 2 ″ 6.79 (0.2749) * 4e2 ′→ 7e1 ′ 5.03 (0.0001) 4.21 (0.0001) 5.20 (0.0009) 4.92 (0.0003) 6.05 (0.0010) 6.40 (0.0003) 6.33 (0.0009) (0.0016) 4e2 ′→ 7e1 ′ (0.0015) 4.22 (0.0015) 5.20 (0.0001) 4.92 (0.0002) * 4e2 ′→ 5e2 ′+6e 2 ′ 5.28 (0.0039) 4.59 (0.0010) 5.67 (0.0004) 5.49 (0.0010) 6.56 (0.0001) (0.0003) a Allowed states are shown in bold font; dipole forbidden states from vibrationally excited structures are indicated in italic font (“ sh ” = shoulder). Symmetries are determined at B3LYP/aug-CC-PVTZ. The last two rows marked with an asterisk (* ) list weakly allowed di ffuse states that might be spurious charge-transfer (CT) states.
experiment. States at the other levels of theory were organized
so that their electronic configurations match those at B3LYP/
aug-CC-PVTZ and are therefore not listed according to increasing energies.
Basis set enlargement lowers the excitation energy of the
strong peak. Most important are diffuse functions as they lower
the excitation energy by 0.7, from 6-31G* to 6-31+G* and by
0.6 eV upon augmentation of the CC-PVTZ basis set.
Increasing the basis set from 6-31+G* to aug-CC-PVTZ
reduces the energy of the strong peak by another 0.25 eV. The
lower energy peaks respond very little to the presence of diffuse
functions and differ by only up to 0.1 eV with the 6-31+G* and
aug-CC-PVTZ basis sets, so that 6-31+G* is adequate for the
lower energy range of the spectrum.
Increasing the basis set reduces the oscillator strength of the main peak. At B3LYP/aug-CC-PVTZ, the oscillator strength is less than half of the experimental one. The two higher peaks at
6.73 and 6.79 eV arise from similar electron configurations as
the main peak and their presence therefore reduces the
oscillator strength of the main peak.35−37 The transfer of
oscillator strength into these states at the ionization threshold
of ferrocene at 6.6−7.1 eV38might be an artifact of the diffuse
butfinite basis set.
Compared to B3LYP, the allowed states are shifted to higher energy by 0.8 eV with the range-separated CAM-B3LYP functional employing the same basis set. The dipole-forbidden
low-energy states differ by only up to 0.1 eV. This trend seems
logical, as range-separated functionals increase the amount of HF exchange as a function of the distance from the center.
Therefore, high-energy diffuse excited states should be affected
more than compact valence excited states. Compared to the experiment, CAM-B3LYP/aug-CC-PVTZ overestimates the main peak by 0.7 eV. The basis set dependence is less with CAM-B3LYP than with B3LYP, and there is no splitting of the main peak into several components. This might be attributed to
the larger energy difference between orbital energies with
increasing amount of HF exchange, which reduces mixing of
different electronic configurations.
Effect of the Density Functional. Spectra predicted with
the 6-31+G* basis set are shown in Figure 3. The results for the
first three dipole-forbidden states (see Table 1, invisible in
Figure 3) differ very little with B3LYP, CAM-B3LYP, and
wB97XD. Only BLYP and, in particular, LSDA predict substantially higher excitation energies for these states. With
LSDA, this can be traced back to the short Fe−Cp distance
(1.579 Å), which strongly influences low excitation energies.
Note also that thefirst two states have almost the same energy
with inversed order, compared to the other functionals. In addition, LSDA leads to a splitting of the main peak at 6.31 eV into two weak states. A search for additional peaks, which included 70 excited stated states and covered the energy range
up to 6.77 eV, produced no additional absorption. Thus, LSDA has trouble with the structure and with high and low energy peaks and will not be considered further.
Comparison of BLYP and B3LYP results reveals that HF exchange decreases low and increases high excitation energies, pushing the states apart. Range-separated hybrid functionals CAM-B3LYP and wB97XD continue this trend as low excitation energies increase by 0.15 eV, at the most, but the high energy peaks by up to 1 eV. As a result, range-separated functionals overestimate the excitation energy of the strongly allowed state of ferrocene severely, even with large basis sets (compare with Figure 2), while leading to no improvement for the low-energy states. This leaves us with BLYP and B3LYP.
However, BLYP/6-31G* predicts a lower excitation energy for
the strong peak than B3LYP and is therefore expected to underestimate the excitation energy upon basis set enlargement more than B3LYP, which already slightly below experiment. A further drawback of BLYP is that it produces a large number of
spurious low-lying states.39 With the 6-31+G* basis set, the
strong state is excited state number 78 with BLYP, number 49 with B3LYP, number 46 with CAM-B3LYP, and number 42 with wB97XD. Thus, 36 states predicted with BLYP disappear with the range-separated wB97XD functional that includes 100% of long-range HF exchange. A ZINDO calculation, producing the main absorption as excited state 43 at 6.85 eV,
confirms that the remaining low-lying states are not DFT
artifacts. With the aug-CC-PVTZ basis set, B3LYP and CAM-B3LYP agree that the strong state is excited state number 51. Thus, B3LYP with 20% of HF exchange removes the spurious states equally well as CAM-B3LYP.
Taking all issues together, the global hybrid B3LYP is the only one among the tested density functionals that can predict the spectrum of ferrocene over the entire range of excitation energies from 2 eV to 7 eV. Therefore, B3LYP will be used for the following detailed analysis of the ferrocene spectrum.
The Visible Part of the Spectrum. The spectra presented so far do not show any absorption in the visible and consequently predict ferrocene to be colorless. However, calculations with all density functionals and basis sets produce a large number of excited states with zero oscillator strength below the strongly allowed transition. Figure 4 depicts TDB3LYP/6-31+G* energies of all excited states, regardless of oscillator strength. (Peaks that have nonzero oscillator strength are shifted slightly upward.)
Figure 4 shows four isolated peaks at low energy; two of them are in the visible range (below 3.2 eV). Each peak consists
Figure 3.Effect of HF exchange on UV spectra of eclipsed (D5h)
ferrocene.
of two degenerate states. These four excited states in the visible part of the spectrum are dipole-forbidden but may become
weakly allowed through vibronic coupling.8 Most
dipole-forbidden states are found between 5 and 6 eV, where
ferrocene starts to absorb more strongly. The effect of
vibrations was modeled by calculating the IR spectrum of the D5h ground state and extracting vibrationally excited structures according to normal modes 1, 2 (degenerate with 3), 4, 5 (degenerate with 6), and 7. Then, UV spectra of the vibrationally excited structures (Scheme 1) were calculated and added to the spectrum of the D5h form in Figure 5. The inset shows the low-energy part of the spectrum with stretched vertical axes, to make the weak absorptions visible.
Mode 1 at 43 cm−1does not lead to absorption in the visible
region. Mode 2 (162 cm−1) (black spectrum in Figure 5)
activates excited states 3 and 6 (almost invisible). Normal mode 4 is a symmetric stretch of the Cp rings, relative to Fe, and does not activate any excited states but shows that decreasing the
Fe−Cp distance by 0.2 Å increases the first excitation energy
from 2.2 eV to 3.9 eV. Mode 5 (363 cm−1) activates excited
state 2 at 2.24 eV and excited state 10 at 4.83 eV. Mode 7 has
its strongest effect on excited state 6, imparting oscillator
strength on the peak at 3.75 eV. Energies and oscillator strength of the states activated by vibrations are given in Table 1 in italics below the corresponding states of the D5h form. It is interesting to note that the rather strong structural distortions
(with exception of decreasing the Fe−Cp distance) change the
excitation energies of the states relatively little.
In Figure 5, the lower vibrational energy of mode 2, compared to mode 5, and the higher oscillator strength of excited state 3 (black), compared to excited state 2 (green), suggests that the experimentally observed peak at 2.82 eV is excited state number 3 calculated at 2.61 eV and not excited state 1 (degenerate with 2) as assumed in other theoretical
studies.6,10,12,15Excited state number 2 at 2.24 eV seems to be
responsible for the shoulder at 2.35 eV, which was suggested by
Scott and Becker16and by Scuppa et al.12to arise from a triplet
excitation. The assignment of excited state 2 to the 2.35 eV shoulder, however, is in agreement with the disappearance of this peak and the color change of ferrocene from orange to
yellow upon cooling.16Because the vibrational energy of mode
5 is substantially higher than that of mode 2, cooling should let excited state 2 at 2.24 eV vanish before excited state 3 at 2.61 eV. Since the absorbance at 2.24 eV is in the green part of the spectrum with the complementary color red, ferrocene should appear more orange at higher temperature. Of course, the presence of this singlet state does not rule out the simultaneous presence of a triplet state. The weak absorption at 3.82 eV in the experimental spectrum appears to be related to excited state number 6 at 3.75 eV, and the features at 4.68 and 4.77 eV can
be associated with strong absorption at 4.83 eV produced by mode 5.
Low-Lying Allowed States. The absorption spectrum of
ferrocene vapor at 35°C shows at least six peaks in the range
between 4.5 eV and 6.2 eV. The top panel of Figure 6 shows an
enlarged version of this spectral range, as predicted at the
B3LYP/6-31+G* and B3LYP/aug-CC-PVTZ levels for the
D5h form. The energies of the peaks differ by <0.1 eV with the
two basis sets, and both basis sets predict two or three peaks
but not six or more. There are many weakly allowed diffuse
states in this energy range (the last two rows of Table 1). The positions of these states are dependent strongly on the amount of HF exchange and they move out of this energy range with range-separated functionals. As outlined above, it is reasonable to assume that these states are spurious CT states. However, there are many dipole-forbidden valence states in this energy range (see Figure 4) that persist with wB97XD and ZINDO. Therefore, it is reasonable to assume that the missing peaks are vibrationally excited states. The spectrum in the bottom panel of Figure 6 is a composition of the D5h spectrum plus spectra of vibrationally excited structures of modes 2 and 5. The spectrum shows a remarkable similarity with the vapor spectrum of ferrocene, reproducing all the major features of the vapor spectrum between 4 and 6 eV with errors of 0.2 eV or less. Although such an approach can only provide an estimate for the vibronically coupled absorption spectrum (no attempt was made for weighting the contribution according to vibrational energy for instance), the results present strong evidence that the visible region and the region between 4 and 6
eV of the ferrocene spectrum are strongly influenced by
vibronic coupling.
Characterization of the Excited States. According to
ligandfield theory, the low-lying excited states of ferrocene are
d−d transitions on Fe and the higher energy states are CT
states. To assess the actual amount of charge transfer upon electronic excitation, excited states contributing most to the
spectrum are examined with density difference plots and NBO
analysis.22,40,41
Figure 5.UV spectrum of ferrocene in vibrational ground and excited
states at the B3LYP/6-31+G* level of theory.
Figure 6.(Top) Allowed states of D5h ferrocene at B3LYP/6-31+G*
and B3LYP/aug-CC-PVTZ. (Bottom) Combined spectra of ferrocene D5h and of vibrationally excited structures corresponding to modes 2 and 5.
The charge in the D5h ground state on Fe is +0.56 e at
B3LYP/6-31G* but changes to −0.27 e at B3LYP/6-31+G*.
This might come as a surprise, considering that the oxidation state of Fe is +2. However, ferrocene has been shown,
theoretically, to be ∼50% covalent,42 and the result is in
agreement with experimental findings by Makal et al.43NBO
analysis is quite independent of the basis set and large shifts in NBO charges upon enlargement of the basis set, usually reflect
true improvements in the electron density.44This is consistent
with the improvement of the spectra upon inclusion of diffuse
functions. In any case, shifts in charge density upon excitation
are qualitatively similar with 6-31G* and 6-31+G* basis sets
(albeit larger with 6-31+G*, especially for more-diffuse
high-lying states).
The order of the occupied orbitals that are involved in the excitations is the same with all density functionals (excluding LSDA) and basis sets. Orbitals 42 and 43 are bonding linear
combinations of Fe d- and Cp-HOMO orbitals of 4e1″
symmetry. Orbitals 44 and 45 (6e1′) are bonding combinations
of Fe p- and Cp-HOMO orbitals. Orbital 46 is the Fe dz2orbital
of 8a1′ symmetry. The degenerate HOMO pair is the bonding
combination of Fe d- and Cp-LUMO orbitals of 4e2′ symmetry.
The ordering of the unoccupied orbitals depends on the basis
set. With increasing number of diffuse functions, more
low-lying diffuse orbitals appear between the valence orbitals. The
strongly allowed excited states predicted with different basis
sets, however, involve analogous orbitals, regardless how many
diffuse functions have slipped between them. Only the number
of states with little or no oscillator strength differs as described
in the previous section. The following discussion is done with
6-31+G* for the low-lying states where there is little difference
with different basis sets and with 6-31+G* and aug-CC-PVTZ
basis sets for the high-energy part of the spectrum.
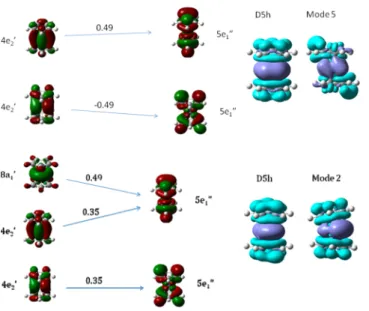
Excited states 1 and 2 (Figure 7, top) are electronic
transitions from the two degenerate HOMOs (4e2′) to the two
degenerate (5e1″) unoccupied molecular orbitals. The 4e2′
orbitals are polarized toward Fe, the 5e1″ orbitals toward Cp.
Accordingly, the density difference plots reveal increased
electron density (light blue) on Cp and decreased electron
density (dark blue) on Fe in the excited state. The amount of charge transferred is 0.40 e, according to NBO analysis.
Excited states 3 and 4 (see Figure 7, bottom panel)
additionally involve the (8a1′) dz2-orbital of Fe but are
otherwise very similar to states 1 and 2. Similar to the previous case, Cp rings act as electron acceptors. The amount of charge transferred from Fe to Cp is also 0.40 e.
Excited states 5 and 6 (see Figure 8) are different linear
combinations of the same orbitals involved in excited states 3 and 4. The amount of charge transfer is 0.41 e.
Excited state number 14 (Figure 9) arises from an electronic
transition from 6e1′ to 5e1″. The total charge transfer amounts
to 0.38 e.
Thefirst allowed states of the D5h form are excited states 18
and 19 (see Figure 10) which involve transitions from 4e2′ to a
combination of higher-lying unoccupied valence and diffuse
orbitals of 5e2′ and 6e2′ symmetry with a total charge transfer of
Figure 7.(Top) Excited state 2, 2.26 eV f = 0 in the D5h form, 2.24
eV, f = 0.0012 in mode 5. (Bottom) Excited state 3, 2.60 eV, f = 0 in the D5h form, 2.61 eV, f = 0.0044 in mode 2.
Figure 8.Excited state 6, 3.45 eV, f = 0 in the D5h form, 3.75 eV, f =
0.0012 in mode 7.
Figure 9.Excited state 14, 5.26 eV, f = 0 in the D5h form, 4.83 eV, f =
0.0186 in mode 5.
0.70 e. These states are the only ones with a substantially larger charge transfer.
The next allowed state of the D5h form is excited state number 26 at 5.59 eV (see Figure 11). This state arises from
electron transfer from a linear combination of 4e2′ with the 6e1′
orbitals below. The acceptors are 5e1″ and 4e2″ orbitals, the
latter being the antibonding combination of the Cp-LUMOs
having no coefficient on Fe. The amount of charge transfer is
0.30 e.
The main peak of the spectrum (see Figure 12) involves the same orbitals as excited state 26 in Figure 11. The density
difference plot reveals the diffuse nature of this excited state and
rationalizes the large influence of diffuse functional on its
excitation energy. Nonetheless, the CT amounts to only 0.46 e. The splitting of this state into a main peak and a lower energy satellite (excited state 26) is obtained at all levels of theory employed in this investigation. The satellite falls into the region where ferrocene starts absorbing and is mixed with the vibrationally coupled dipole forbidden transitions.
Because 6-31+G* and aug-CC-PVTZ results predict very
different oscillator strengths for the main peak of the spectrum,
orbital plots of the main excitation and the two following states are shown also at B3LYP/aug-CC-PVTZ. Figure 13 shows no
dramatic difference between the main peaks with the two basis
sets. With aug-CC-PVTZ there are two very small additional
electronic configurations from the HOMOs into two additional
higher-lying Cp antibonding orbitals of e2″ symmetry.
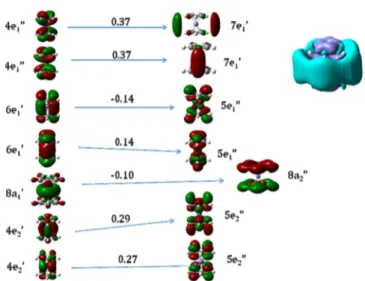
Excited state 80 at 6.73 eV (see Figure 14) involves linear
combinations of the 4e1″ and 4e2′ orbitals with contributions
from 6e1′ and 8a1′ and transfers electrons into 5e1″ and 5e2″
orbitals and into diffuse functions.
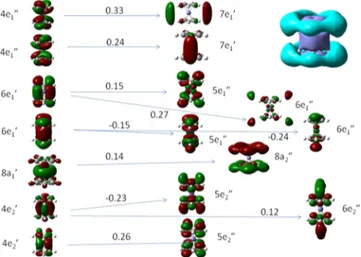
Excited state 85 (see Figure 15) resembles excited states 51
(49 with 6-31+G*) and the satellite state 26 (with 6-31+G*).
As excited states 51, 80, 85, and the satellite involve the same donor orbitals, the oscillator strength is distributed among
these states.35−37 As stated previously, the splitting is absent
with CAM-B3LYP and might be an artifact of the diffuse but
finite basis set that might lead to artificially bound states that are actually above the ionization threshold.
The molecular orbitals in Figures 7−15 reflect the partially
covalent42nature of ferrocene, since all occupied orbitals are
delocalized over the entire molecule. In all excited states, the Cp rings act as electron acceptors, so that none of the excited
states can be considered a pure d−d transition. The weak
formally forbidden absorptions at 2.24 and 2.61 eV shift only 0.06 e less from Fe to Cp than the strong absorption at 6.45 eV, which is generally assumed to be a CT state. The only state that sticks out is excited state 18, which has a charge transfer of 0.70
Figure 11.Excited state 26, 5.59 eV, f = 0.0459, D5h.
Figure 12.Excited state 49, 6.45 eV, f = 0.66, D5h.
Figure 13.Excited state 51, with B3LYP/aug-CC-PVTZ, 6.20 eV, f =
0.34, D5h.
Figure 14.Excited state 80, with B3LYP/aug-CC-PVTZ, 6.73 eV, f =
e. The distinction between the so-called d−d transitions and
the CT states of ferrocene is therefore unjustified.
Comparison with Earlier Work. Table 2 summarizes relevant results from previous theoretical studies, leading to the conclusion that TDB3LYP should not be used to calculate the
absorption spectrum of ferrocene. Boulet et al.6employed
time-dependent density functional response theory (TDDFRT) with LDA and gradient corrected functionals. The basis sets consisted of pseudo-potentials plus Slater-type polarized
triple-ζ valence basis sets. The results were compared to
those at TDB3LYP/LAND2DZ. TDB3LYP faired particularly poorly, in comparison with LB94/LDA results. Boulet et al. considered the LDA structure superior to the B88P86 structure, because the former leads to 0.3 eV higher excitation energies. In
contrast, the LDA structure is clearly inferior because the Fe−
Cp distance is too short. Table 2 shows that thefirst excitation
energy at TDB3LYP/LAND2DZ is 0.44 eV below that obtained here with large all-electron basis sets. Thus, the
difference between TDB3LYP and TDDFRT results stems
largely from use of different geometries and different basis sets.
Finally, underestimation of the excitation, compared to the
experiment, is aggravated by assigning thefirst rather than the
third excited state to the absorption at 2.82 eV.
Scuppa et al.12included relativistic effects through the
zero-order regular approximation (ZORA) and spin orbit effects
with the van Leeuwen−Baerends (LB94) correlation functional
and concluded that spin-orbit effects are small. The best results
were found with the PBE geometry that predicts a Cp−Fe
distance 1.638 Å. As shown already by Boulet, decreasing the
Cp−Fe distance increases the first excitation energy. Therefore,
using an incorrect geometry is not an improvement but rather error cancellation.
Comparison of the results of Ishimura et al.7employing the
symmetry-adapted cluster configuration interaction (SAC−CI)
method with the present ones shows several differences
between the SAC−CI and DFT methods. First, the ordering
of the HFT orbitals, which are the starting point for the SAC−
CI calculations, is very different from that of DFT orbitals.
Previous work on HFT and DFT orbital energies, including
inner valence down to−30 eV, suggests that the DFT orbital
ordering and energy spacing are usually in much better
agreement with the experiment than HFT orbital energies.45,46
Because of the different orbital orderings, the excited states with
SAC−CI and DFT also differ. With SAC−CI, there is not a
single excited state involving the low-lying unoccupied 5e1″
orbital. Instead, 9e1″, which lies almost 7 eV above 5e1″, is the
preferred acceptor. Nonetheless, the energies and electronic
configurations of the first three low lying states with SAC−CI
are in agreement with TDB3LYP (although the 4e2′−5e1″
(HOMO−LUMO) transition at TDB3LYP corresponds to the
4e2′−9e1″ (HOMO-2 to LUMO+6) transition with SAC−CI).
The first excited state that is generally claimed to be
underestimated at the TDB3LYP level occurs at even lower energy with the ab initio method. For the states between 5.25
eV and 5.60 eV, originating from the 4e1″ orbitals, there is no
counterpart with DFT, since all states in this energy range arise
from 6e1′ and 4e2′ orbitals. The first allowed peak, which
Ishimura et al. assigned to the strong absorption of ferrocene, is
a transition into two diffuse orbitals of a1′ symmetry. Ishimura
et al. do not give the oscillator strength for any of the states, but
the present work shows that excitations into the diffuse states
have very low oscillator strength. Therefore, it seems more likely that the strong state is the one at 6.45 eV, which arises
from transfer of electrons from 6e1′ to 9e1″. This state is similar
in nature to the strong state at TDB3LYP, which involves 6e1′
to 5e1″.
The TDB3LYP results of Li et al.10differ by less than 0.1 eV
from the present ones. Li et al. calculated only the first four
excited states, which are predicted at slightly higher energy with pure DFT functionals than with hybrids. The conclusion that PBE should be preferred over B3LYP arises from assigning excited state 1 rather than excited state 3 to the peak at 2.82 eV.
Finally, Fromager15 compared TDB3LYP and
TDCAM-B3LYP excitation energies with the relativistic version of the basis set employed here and concluded that range-separated functionals should be used for metallocenes. The low excitation energies are very similar with both functionals and with the
present results. This confirms that the relativistic effects are
Figure 15.Excited state 85, with B3LYP/aug-CC-PVTZ, 6.79 eV, f =
0.27, D5h.
Table 2. Comparison of Present Results with Those of Previous Work
Excitation Energy (eV)
this work B3LYP/aug-CC-PVTZ Boulet6 Ishimura7SAC−CI Li10B3LYP Scuppa12ZORA Fromager15B3LYP CAM-B3LYP
2.18 1.74 2.11 2.18 2.81 2.43 2.33 2.51 2.27 2.27 2.53 2.91 2.70 2.65 3.45 3.22 4.03 3.38 3.44 3.48 3.45 5.26 5.29a* 5.41 5.85 5.55 5.48a 5.72 6.25 5.89 6.34 6.20 6.45
small for ferrocene and that a nonrelativistic all-electron basis
sets can be employed. The oscillator strength of the twofirst
allowed states with the B3LYP functional at 5.41 and 5.72 eV (here, 5.26 eV (0.0054) and 5.55 eV (0.0514)) were omitted, giving the impression that there are no allowed states in this region with B3LYP. Moreover, Fromager et al. erroneously assigned the excited state at 6.25 eV with an oscillator strength of 0.107 to the strong absorption at 6.12 eV and concluded that CAM-B3LYP predicts correct excitation energy but under-estimates oscillator strength. It is obvious from a comparison with data in Table 1 and Figure 2 that the state at 6.25 eV is the low-energy satellite of the strongly allowed state that is shifted to higher energy with CAM-B3LYP, compared to B3LYP. It is typical for range-separated functionals to predict higher
excitation energies than global hybrids also for conjugated
π-systems.47 Because the overestimated energy of this satellite
almost coincides with the strong transition found experimen-tally at 6.12 eV, Fromager et al. missed the proper state which is predicted at 6.99 eV with an oscillator strength of 0.58 at CAM-B3LYP/aug-CC-PVTZ. Therefore, the correct conclusion is that CAM-B3LYP overestimates the excitation energy, while the oscillator strength is reasonable.
■
CONCLUSIONSThe structure and absorption spectrum of ferrocene can be calculated with errors not exceeding 0.2 eV over the entire range of excitation energies at the TDB3LYP level of theory
with all-electron basis sets that include diffuse functions.
Relativistic effects are negligible. Earlier claims regarding the
failure of TDB3LYP are demonstrated to arise from use of the inadequate LANLDZ pseudo-potential basis sets and incorrect assignment of the peaks.
Dipole-forbidden excited states of ferrocene in the visible range can be modeled by using vibrationally excited structures. Energies and oscillator strengths are in good agreement with experiment and explain the color change from orange to yellow of ferrocene upon cooling.
Low and high energy excitations involve almost identical
amounts of charge transfer (0.40−0.46 e), according to NBO
analysis. Therefore, the differentiation into Fe-centered d−d
transitions and CT states is not borne out by the present calculations. The only state with a larger charge transfer (0.70 e) is excited state 18 at 5.32 eV.
The effect of including increasing amounts of Hartree−Fock
(HF) exchange into the density functional is a reduction in low excitation energies and an increase in high excitation energies. Examination of the entire spectrum suggests that B3LYP is once more the golden middle. Twenty percent (20%) of HF
exchange with B3LYP is sufficient to remove most of the 36
spurious charge-transfer states that are present with
BLYP/6-31+G*. In contrast, large amounts of HF exchange in the
long-range part of the functional, as with CAM-B3LYP and wB97XD, are excessive and lead to overestimation of energies
of diffuse states, such as the strong absorption at 6.31 by 0.8 eV.
■
AUTHOR INFORMATIONCorresponding Author
*Tel.: +90 312 290 2122. Fax: +90 312 266 4068. E-mail: [email protected].
Notes
The authors declare no competingfinancial interest.
■
ACKNOWLEDGMENTSThis work was supported by Bilkent University. The author
thanks Lutfiye Hallioglu, Eylul Karaca, and Cansu Kavsat for
doing some of the calculations during their undergraduate projects. The author thanks Prof. Michael Bendikov and Prof. Roi Baer for helpful discussions.
■
DEDICATIONThis work is dedicated to the memory of my dear friend and colleague, Prof. Michael Bendikov of the Weizmann Institute of Science, who passed away July 2, 2013.
■
REFERENCES(1) Kealy, T. J.; Pauson, P. L. Nature 1951, 168, 1039−1040.
(2) Huheey, J. E.; Keiter, E. A.; Keiter, R. L. Inorganic Chemistry; 4th ed. ed.; Harper Collins: New York, 1993.
(3) Kirchner, R.; Loew, G.; Mueller-Westerhoff, U. Theor. Chim. Acta 1976, 41, 1−6.
(4) Taylor, T. E.; Hall, M. B. Chem. Phys. Lett. 1985, 114, 338−342. (5) Koch, H.; Jorgensen, P.; Helgaker, T. J. Chem. Phys. 1996, 104, 9528−9530.
(6) Boulet, P.; Chermette, H.; Daul, C.; Gilardoni, F.; Rogemond, F.; Weber, J.; Zuber, G. J. Phys. Chem. A 2001, 105, 885−894.
(7) Ishimura, K.; Hada, M.; Nakatsuji, H. J. Chem. Phys. 2002, 117, 6533.
(8) Parac, M.; Grimme, S. J. Phys. Chem. A 2002, 106, 6844−6850.
(9) Nemykin, V. N.; Makarova, E. A.; Grosland, J. O.; Hadt, R. G.;
Koposov, A. Y. Inorg. Chem. 2007, 46, 9591−9601.
(10) Li, Y. L.; Han, L.; Mei, Y.; Zhang, J. Z. H. Chem. Phys. Lett. 2009, 482, 217−222.
(11) Martin, J.; Baker, J.; Pulay, P. J. Comput. Chem. 2009, 30, 881− 883.
(12) Scuppa, S.; Orian, L.; Dini, D.; Santi, S.; Meneghetti, M. J. Phys. Chem. A 2009, 113, 9286−9294.
(13) Bean, D. E.; Fowler, P. W.; Morris, M. J. J. Organomet. Chem. 2011, 696, 2093−2100.
(14) Mohammadi, N.; Ganesan, A.; Chantler, C. T.; Wang, F. J.
Organomet. Chem. 2012, 713, 51−59.
(15) Fromager, E.; Knecht, S.; Jensen, H. J. A. J. Chem. Phys. 2013,
138, 084101-1−084101-14.
(16) Scott, D. R.; Becker, R. S. J. Chem. Phys. 1961, 35, 516−531.
(17) Scott, D. R.; Becker, R. S. J. Chem. Phys. 1961, 35, 2246−2247.
(18) Armstrong, A. T.; Smith, F.; Elder, E.; McGlynn, S. P. J. Chem.
Phys. 1967, 46, 4321−4328.
(19) Sohn, Y. S.; Hendrickson, D. N.; Hart Smith, J.; Gray, H. B. Chem. Phys. Lett. 1970, 6, 499−501.
(20) Coriani, S.; Haaland, A.; Helgaker, T.; Jorgensen, P. Chem. Phys. Chem. 2006, 7, 245−249.
(21) Yamaguchi, Y.; Ding, W.; Sanderson, C. T.; Borden, M. L.; Morgan, M. J.; Kutal, C. Coord. Chem. Rev. 2007, 251, 515−524.
(22) Reed, E. A.; Curtiss, L. A.; Weinhold, F. Chem. Rev. 1988, 88, 899.
(23) Slater, J. C. In Quantum Theory of Molecular and Solids;
McGraw−Hill: New York, 1974; Vol. 4.
(24) Vosko, S. H.; Wilk, L.; Nusair, M. Can. J. Phys. 1980, 58, 1200−
1211.
(25) Becke, A. D. Phys. Rev. A 1988, 38, 3098−3100.
(26) Lee, C.; Yang, W.; Parr, R. G. Phys. Rev. B 1988, 37, 785−789.
(27) Becke, A. D. J. Chem. Phys. 1993, 98, 5648−5652.
(28) Yanai, T.; Tew, D. P.; Handy, N. C. Chem. Phys. Lett. 2004, 393, 51−57.
(29) Chai, J.-D.; Head-Gordon, M. Phys. Chem. Chem. Phys. 2008, 10, 6615−6620.
(30) Dunning, J. T. H. J. Chem. Phys. 1989, 90, 1007−1023. (31) Kendall, R. A.; Dunning, J. T. H.; Harrison, R. J. J. Chem. Phys. 1992, 96, 6796−6806.
(32) Frisch, E.; Frisch, M. J.; Clemente, F. R.; Trucks, G. W. Gaussian 09 User’s Reference; Gaussian, Inc.: Wallingford, CT, 2009.
(33) Frisch, M. J.; Trucks, G. W.; Schlegel, H. B.; Scuseria, G. E.; Robb, M. A.; Cheeseman, J. R.; Scalmani, G.; Barone, V.; Mennucci, B.; Petersson, G. A.; Nakatsuji, H.; Caricato, M.; Hratchian, H. P.; Izmaylov, A. F.; Bloino, J.; Zheng, G.; Sonneberg, J. L.; Hada, M.; Ehara, M.; Toyota, K.; Fukuda, R.; Hasegawa, J.; Ishida, M.; Nakajima, T.; Honda, Y.; Kitao, O.; Nakai, H.; Vreven, T.; Montgomery, J. A., Jr.; Peralta, J. E.; Ogliaro, F.; Bearpark, M.; Heyd, J. J.; Brothers, E.; Kudin, K. N.; Staroverov, V. N.; Kobayashi, R.; Normand, J.; Raghavachari, K.; Rendell, A.; Burant, J. C.; Iyengar, S. S.; Tomasi, J.; Cossi, M.; Rega, N.; Millam, J. M.; Klene, M.; Knox, J. E.; Cross, J. B.; Bakken, V.; Adamo, C.; Jaramillo, J.; Gomperts, R.; Stratmann, R. E.; Yazyev, O.; Austin, A. J.; Cammi, R.; Pomelli, C.; Ochterski, J. W.; Martin, R. L.; Morokuma, K.; Zakrzewski, V. G.; Voth, G. A.; Salvador, P.; Dannenberg, J. J.; Dapprich, S.; Daniels, A. D.; Farkas, O.; Foresman, J. B.; Ortiz, J. V.; Cioslowski, J.; Fox, D. J.; Gaussian, Inc.: Wallingford, CT, 2009.
(34) Allouche, A.-R. Gabedit, Version 2.1.8; 2007. (35) Thomas, W. Naturwissenschaften 1925, 13, 627. (36) Reiche, F.; Thomas, W. Z. Phys. 1925, 34, 510−525. (37) Kuhn, W. Z. Phys. 1925, 33, 408−412.
(38) http://webbook.nist.gov/cgi/cbook.cgi?ID=C102545&Mask= 20#Ion-Energetics
(39) Magyar, R. J.; Tretiak, S. J. Chem. Theor. Comput. 2007, 3, 976− 987.
(40) Reed, A. E.; Weinhold, F. J. Chem. Phys. 1985, 83, 1736. (41) Reed, E. A.; Weinstock, R. B.; Weinhold, F. J. Chem. Phys. 1985, 83, 735.
(42) Rayón, V. M.; Frenking, G. Organomet. 2003, 22, 3304−3308. (43) Makal, A. M.; Plazuk, D.; Zakrzewski, J.; Misterkiewicz, B.; Wozniak, K. Inorg. Chem. 2010, 49, 4046−4059.
(44) Reed, A. E.; Curtiss, L. A.; Weinhold, F. Chem. Rev. 1988, 88, 899.
(45) Salzner, U. J. Phys. Chem. A 2010, 114, 10997−11007. (46) Salzner, U.; Baer, R. J. Chem. Phys. 2009, 131, 231101-1− 231101-4.
(47) Salzner, U.; Aydin, A. J. Chem. Theor. Comput. 2011, 7, 2568− 2583.