A new
approach to holographic video imaging : Principles and simulations
Levent Onural, Gözde Bozdai, and Abdullah Atalar, Bilkent University, Dept. of Electrical and Electronics Eng.,
06533 Ankara, Turkey
ABSTRACT
As the importance of display of 3-dimensional information in many fields increases, more attention is given to holographic displays. Different kinds of holographic displays are reported in the literature, but the resolution of the available display media is not sufficient to support the extraordinary spatial detail of holograms. In this paper, we propose a new acousto-optical holographic display device which solves significantly the display resolution and the refreshing problems that are common to available holographic displays. The technique is based on the reproduction
of the hologram using traveling surface waves. The SAW device that is used as the medium of display has an
array of electrodes attached to it. An electrical signal applied to any one of these electrodes generates an acoustical
wave propagating on the surface of the crystal where the electrodes are the sources. If signals are applied to all
of the electrodes simultaneously, propagating waves from the electrodes superpose to form a time-varying surface
field pattern on the crystal. This pattern, at a specific time, forms the hologram. The signals which should be applied to the electrodes, in order to have a specified field pattern on the crystal at a specified time instant are
found through a mathematical inversion relation. The inversion relationship is derived from the underlying physics. Computer simulations of the proposed TV display show that the proposed system will work as desired. In addition, our preliminary studies show that the proposed system can be constructed with the available acoustical, optical, electronic technology and with the application of digital signal processing techniques.
1.INTRODUCTION
Some three-dimensional television display systems, including both the camera and the display ends are reported
in the literature.2'4'5 Some of these are holographic systems whereas others are based on stereoscopic imaging. At
the transmitter side of a holographic television system, a two-dimensional pattern (hologram) is formed by using well-known holographic techniques, and it is transmitted to one or many receivers. A frame by frame operation may be assumed where the hologram patterns are transmitted one after another at a proper rate for continuous
motion observation, as in the conventional television. A receiver gets the two-dimensional hologram pattern, and then reconstructs a three-dimensional image frame from each transmitted two-dimensional hologram frame. The technique
used for duplication of the hologram at the receiver side of these systems may be properly named "spatial light
modulation."
In this paper, a novel structure and a technique is presented for the display end of a holographic three-dimensional television system. The used technique is based on the reproduction of the desired pattern, in our case the hologram, using traveling surface waves. Thus, the technique proposed in this paper is conceptually different than the available techniques which use the direct scanning of the hologram.
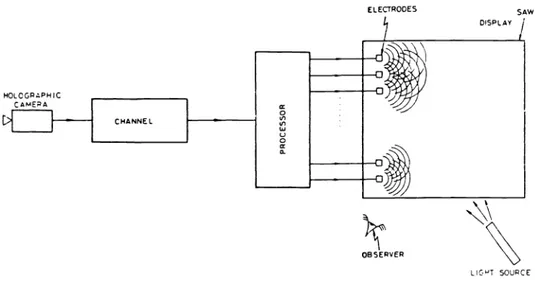
In Fig.1, a possible three-dimensional holographic television system which utilizes the proposed technique is shown. At the transmitter side, there is a video camera which captures the two-dimensional hologram pattern in front of it. The hologram represents the three-dimensional scene as seen by the camera. The hologram pattern captured by the camera is converted into electrical video signal and then transmitted through a channel to the receiver. The received video signal is then processed by the block labeled "processor" . This processor performs the proposed inversion process to get the electrode signals. It is also possible to interchange the order of the channel and the processor depending on the economics. These electrode signals then generate the time-varying field pattern on the crystal surface, which is a surface acoustic wave device (SAW). The time-varying field will yield a reproduction of the hologram in front of
ELECTROOES
Figure 1: A practical implementation
DISPLAY
the video camera at a time instant t2. Right at this time, a pulse of coherent light, may be from a laser, is passed
through the crystal, to reconstruct the three-dimensional scene, seen by the camera, in front of the observer. Since there is no need to erase the written hologram explicitly, the system is ready for another frame in a short time where this duration is limited only by the propagation speed of the surface waves on the crystal. If consecutive frames are sent frequently enough, as in conventional television, the observer will see a three-dimensional motion picture.
2.FORMING A PATTERN BY SUPERPOSING PROPAGATING WAVES
Suppose that our surface is denoted as the (x, y) plane, with the upper left corner being the origin. We locate
electrodes on the y-axis. From now on, we assume that the variation along the y-axis is continuous, so the applied signal is given by a two-dimensional function f(t, y). After finding the result for the continuous case, it can be easily discretized. Also, for the sake of simplicity, we assume that the y-axis extends from —oc to +x.
Let the time varying field on the crystal surface be 'j(X,y). At a specific instant of time t2 we want to find the
electrode signals, f(t, y), from the surface pattern, b(x, y).
Consider a propagating sinusoidal plane wave which can be written as ejt_kTx, where, k is the wavenumber vector (ks, k)T, and, x is the position vector (x, )T. The direction of propagation is given by c =
(., )T.
The speed of propagation is where1 wI
—=c=
IaI
(1)Now, let the wave be multiplied by the linear phase component ei'Y at the crystal edge. This is analogous to the diffraction of light through a prism, or by a sawtooth transparent phase grid. For a wide range of u, the plane wave continues its propagation after the edge, on the crystal surface, but now it is refracted by a linear phase component. Therefore, if the signal
64 I SPIE Vol. 1667 Practical Holography VI (1992)
f(t, y) =
e3eiY
is applied to the electrodes, then there will be a time-varying field over the crystal surface as
We know the wave number in the y-direction from the excitation as k =—u. So, by using Eq.1 we can find k as
k=tJ(_u2).
(2)If
I 1>1 k = then this argument is no longer valid, since in this case the wave will not propagate on thecrystal surface.
Now, consider an arbitrary surface pattern, t,(X,y)
at t
= t2. We want to find f(t, y) which will yield this pattern. So our problem reduces to a two-dimensional transformation. Considering the (t,y)domain as the input domain, andthe (x, y) domain as the output domain, we want to transform the surface field, 't2(X,y), to the electrical signals
applied to the electrodes, f(t, y). To find this transformation we use the well-known Fourier transform relationships.
We can easily decompose the arbitrary L'1(x, y) into its sinusoidal components using the 2-D inverse Fourier
transform as
1
°°
°°
t1(x,y)
=
fcc W;(Qz,y)eieinYYdrdy.
(3)where the complex weights can be found from the Fourier transform as
+00
+c
t1(X,y)
=
f
J_
(4)Note that
= —k
and=
—k. We have shown previously that in order to get a surface field patterni(.r, y) =
ei(txxyy),
we have to apply f(, y) = to the electrodes.So, in order to get at instant t =
t
we must apply to the electrodes. Finally, it can beargued that
f(t, y) =
results in1(x,y) =
where
W(II.,
f1,) isa constant for fixed and Q,.Therefore, in order to get the arbitrary surface field pattern
1(x, y) =
f j
(5)we must have
f(t, y) =
i_: J_:300 Qy)ei(t_t;)eiYYd1Ixdy. (6)
From Eq.2 we know that
1w
=ck+k.
Hence,I
ck+k
fco
w=<
(7)I
—ck+k
if>O
or, equivalently, w=
c/c1
+ c1.
(8)The reason for the change in the sign ofw due tois that the wave propagates away from the excitation electrodes, i.e., always in the positive x-direction.
By substituting Eq.8 in Eq.6 we get wave pattern."3
f(t, y) =
':
'-= •;J_ 1100
Lw,,/w _
11Y)2Q2ei(t)edQYdw.
(9)If
we represent f(t, y) in terms of its sinusoidal components by using the Fourier transform, we get+0° +00
f(t)=j j F(w,u)ee''dudw.
(10) As a result if we compare Eq.9 and Eq.10 we get— 2 —
F(w,
u)I=i
= (
WI — ç2f)
W e1't' (11)C
2/w
fl2CV7
Therefore we can always find the unique input signal f(, y) in order to get the specified surface field pattern
(x, y) at time t, and the relationship between the Fourier transforms of these two signals is as given above.
If we look at the above equations carefully we see that the bands of F(w, u) and Wt(g(, ii),u) are not the same.
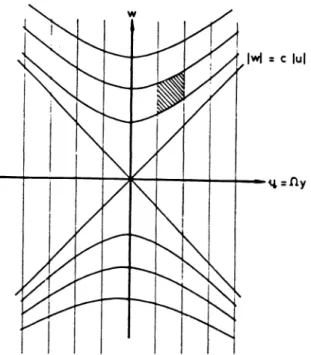
The relationship can easily be found analytically or graphically. Fig.2 shows an example: L'(x, y) is a bandpass signal with a rectangular passband, and the corresponding passband of f(t, y) is shown in Fig.3. As shown previously, the
coordinate transformation is valid only for u <
.. After
the coordinate transformation we see that the band is nolonger rectangular. fix —
—
— — —
•1——
— — —.1.— —--
-
- -
-
-Figure 2: 'I'(,, Q,) with a rectangular pass-band.
= fly
SPIE Vol. 1 667 Practical Holography VI (1 992) I 67
fly
,Iwl :C lul
3.DIGITAL SIMULATION OF INVERSION RELATIONSHIP
The simulations performed in this part tests whether the inversion relationship is correct and how the actual system works. The inversion relationship between the source signal f(t, y) and the surface field i(x, y) is given in the previous section in continuous domain. In practice the length of the crystal edge where the sources are located is finite; the source is not continuous but a discrete array. In simulations, we carried out all the tasks in discrete time. In a way,
this is an advantage; because we have the chance to consider the discrete/finite source effects which we will face with in the actual system. However, during the simulations, we must take care of the aliasing and periodicity effects as shown in this section.
Let us denote the discrete surface wave pattern as ''D (n, in) for n =
ON
—1,
in =
O...M—1, and the discreteexcitation signal by f(a,b) for a =
ON'
— 1,b =O...M'—1. One can take the DFT (Discrete Fourier Transform) oflD(fl,m) to get 't$D'1',") as in Eq.12
N-i M—1
=
>.: i: ZD(n,m)ee
(12)n=Om=O
where
k=O...N—1,l=O...M--1.
If there were no aliasing during the sampling of (x,
y) to get I'tID (
)
elements of WilD (k, 1) are the samples of the continuous Fourier transform 'I' (l ,Q).
Knowing these samples, which are located on a rectangular grid, we can also find the samples of the F(, u) through the relation 13=
W1(Uk,Vl)— —IUkl cU/c
F'
1Uk1(j2k2 ,T2l2
Vi —Uk tT2k2 + V212 Uk
=
—IUkI cUkF(k* 1*). (13)
Uk v"U2k2 + V212
where 0 k* < N', 0 i < M'. U and V are the sampling periods, c is the propagation speed of the wave, N' and M' are given by Eq.14 and Eq.15:
N' =
f[cU2(N
—1)2+ V2(M —1)9, (14)
M' =
V(M
—1).
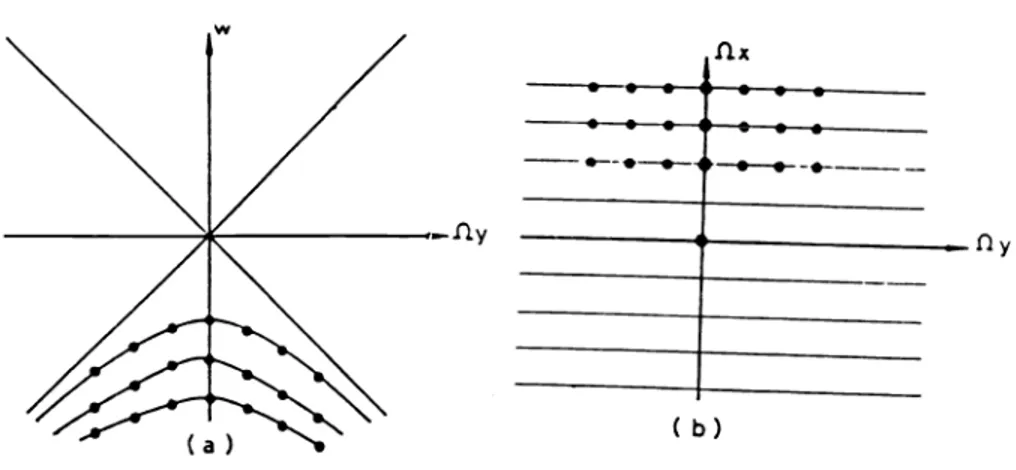
(15) However, the sample locations in this case do not form a rectangular grid. The locations are shown in Fig.4. In order to use an inverse DFT to get the discrete time signals, uniformly sampled data is required; i.e., we have to know
F(d,e)ford=O,...,N'— 1 and e=O,...,M'—l.
This can be achieved rather easily, because the sampling in the u-direction is already uniform. A column of points,
corresponding to a constant k = e (or equivalently to a constant u) can be taken at a time, digitally interpolated
by a sufficient amount first and then sampled again to get the samples of F(w, u) at the proper locations to form a rectangular sampling grid. Of course, the interpolation is different for each e.
After interpolation and resampling, taking the inverse DFT of F(d, e) for d =0...N' —1,
e =
0...M' —1 will giveus the discrete time signals f(a, b) where
NY
My(a)
Figure 4: Sample locations after and before transformation
f(a,b) =
(16)d=O e=O
fora=O...N'—l,b=O...M'—l.
As we are working in discrete domain we need the samples of It(w, ,Wy). Sampling in frequency domain yields periodic repetition of çb(n, in) in space domain as given by Eq.17.
1(k, 1) =W(w,
==
: : b(n
+ Ni, rn + Mj) (17)where N and Al are the periods.
After the coordinate transformation given by Eq.13 we get
F(d, e) =
F(,
U)Iw2d,ue
f(a + N'i, b + M'j).
(18)As we have a periodic input pattern given by the righthand side of Eq. 17, the time signal that must generate it
must also be periodic as given by the righthand side of Eq.18, but we have overlaps in the time signal. The reason
for these overlaps is the infinite extent of the time signal in both variables i and y. If one wishes to have a perfect reconstruction of the periodic pattern, >
> (n
+ Ni, rn + Mj), then an infinite array of electrodes all radiating at all times must be considered. However, we must restrict ourselves to a finite number of electrodes, i.e. a finite number of periods of the time signal in y-direction. If only one period (in y-direction) of the time signal is chosen, then all of the 2-D periods of the space pattern degrades but the degredation is less in the main period. The degredation is due to missing information introduced by not using all the periods.Even though we can get a perfect reconstruction by using an infinite array of electrodes we can not get rid of the
SPIEVol. 1667 Practical Holography VI (1992) /69
(b)
overlapping effect due to the infinite extent of the time signal for each electrode."6 This effect can be decreased by proper choices of N and M, i.e. by zero padding the input pattern. If we choose N and Al large enough we get
t/;(n, rn)
>: : (n
+ Ni, in + Mj)for the main period. So the time signal required to generate this pattern is also more concentrated over the main
period.
The above procedure is implemented by using SUN workstations as follows:
. The first step is to zero pad the input image, the image which will be on the crystal at a given instant as a result
of the propagation of the electrode signals, and take the 2-D NxM discrete Fourier transform. The Fourier
transform is taken by using a Radix 4 algorithm. The real and imaginary parts are stored separately.
. If the original signal has a DC value, it must be supressed because the magnitude after the coordinate transfor-mation blows up to infinity on the ut = I4l/clineswhich correspond to = 0. Let us denote this lower cut-off frequency as 1low ."
.
Now the coordinate transformation given by Eq. 13 can be done. As stated previously, after the coordinatetransformation we will have no more uniform samples. So, interpolation and resampling must be done.
Various interpolation algorithms are found in literature for both nonuniform and uniform samples. The inter-polation algorithms for uniform sampled data are much easier and more efficient to implement. In this step, we performed the interpolation between the samples of W(k, 1) which are known on a uniform rectangular grid. In the discrete domain Eq.2 becomes
k* _-UkIyU2k2 + V212
(19)where U, V are the sampling periods and c is the speed of propagation. The constant c is chosen such that the DFT size does not change after the coordinate transformation, i.e., N = N', M = M'.
By using Eq.21 we can find dmjn and dmaz where dmjn C.liow and
dn,az cU.U.N/2.N/2 + V.V.M/2.M/2 as k = N/2, I = M/2 corresponds to the highest frequency in discrete
domain.
Now, we want to find the value of F(k, 1) at each k, 1 for kmjn k < kmaz. For this, we perform the inverse
coordinate transformation to find the corresponding value in the (k, 1) domain as
k' = L7(.
_ j72e2) (20)where 0 k' < N. As seen from Eq.20 the k' may not be an integer. Since the pixel values are defined only at integer values of k and 1, using non-integer values causes a mapping into locations of Ii for which no gray levels are defined. It then becomes necessary to infer what the gray level values at those locations should be, based on the pixel values at integer coordinate locations using interpolation.
SIMULATION RESULTS
Fig.5.a shows the simulated hologram of a 2-D pattern. The electrode signals are obtained as indicated by the
theory using computation. The electrode signals are presented in Fig.5.b. Here, the vertical axis is the "electrode" axis, whereas the horizontal axis is the time. If these signals are applied to the electrodes, the propagating waves from
each electrode will superpose to generate the pattern shown in Fig.5.c at a specific instant. Here, the desired result
is to have Figures 5.a and 5.c exactly equal to each other. However, due to propagation (and some computational errors) the two pictures will be slightly different. Using this new pattern as the hologram (which would be on the surface of the SAW), the original object (which is a 2-D, i.e., flat pattern located in 3-D space, for this figure) can
be reconstructed as in usual holography. This is shown in Fig.5.d. For comparison, the same simulation method is
applied to the original hologram of Fig.5.a. The result of this simulation is shown in Fig.5.e Here, the measure of
success is the similarity of Figures 5.d and 5.e. The stripes are due to the well known holographic effects, and not due
to the inadequacy of neither the proposed method, nor the computational errors. The similarity of Figures 5.d and
5.e are evident, and this indicates that the proposed system will work.
Figure 5: (a)The simulated hologram of a 2-D pattern, (b) The computed time signal, (c) The reconstructed hologram after radiation of time signal, (d) Reconstruction from hologram in (a), and (e) Reconstruction from hologram in (c)
(a) (c)
(d) (b) (e)
CONCLUSION
In this paper, we presented a technique for the display end of a holographic three-dimensional television system and carried out the computer simulations. The technique is based on the reproduction of the hologram using traveling surface waves. Our primary objective is to provide a simple but effective 3-D holographic television display. As a result of simulations, we see that the proposed system will work as desired. The system will be expected to solve the resolution problem in holographic displays, because the space resolution is determined by the acoustic wave and therefore can be easily increased to the optical limits which is in the order of micrometers. A typical hologram pattern consists of interference fringes with variable frequencies. These variations are centered around the "center frequency" which depends on the angle between the so called "object beam" and the "reference beam" during the recording of the original hologram. For a typical seperation angle of 1O and laser wavelength of O.6prn, the center frequency is 290000 fringes/m corresponding to a 3.4pm spacing between the fringes. If LiNbO3 is used as the SAW device, this corresponds to a 970 MHz center frequency for the time-varying electrode signals. The variation of the fringe frequency around the center frequency depends on the span of the "view angle" of the hologram. This variation is well within the limits of the SAW frequency that can be easily generated and supported on the piezoelectric crystal. Furthermore, the proposed system solves the sequential write-and-erase problem of other holographic video displays. Since the wave pattern on the crystal surface varies continuously, the hologram will be available only for a very short time and then it will disappear. If there is no other input from the electrodes, the time-varying field pattern will decay in time by itself, so there is no need to spend special effort to erase a written hologram. The maximum frame repetition rate is related to the crystal length and speed of wave propagation over the surface. For example, for a 6cm long LiNbO3 crystal, the speed is 3300 m/sec, yielding a maximum rate of 55000 frames/sec.
In simulations, we consider the effects due to discrete/finite number of electrodes which we will face with in the
actual system. However, the system will be expected to differ from the simulation results in some aspects, when
implemented. For example, in simulations, the reflections from the edges of the crystal are neglected, and also the number of electrodes which are treated as point sources, is varied without considering physical limitations. On the other hand, in actual system implementation, the errors due to round off,etc. will no more effect the resultant pattern
as in simulations. Also, in actual system, the stripes due to the small angle between the reference and the object
beams during recording, will not be present in the reconstructed image. The linearity assumptions of the SAW device in terms of the surface signals is completely acceptable for these week signals. So, if the necessary number of electrodes can be used and the information content of the input image is rather distributed around the center, we can say that the actual system will work as shown by the simulation results. Furthermore, the simulator may be easily improved to consider some non-ideal real life situations. This may result in generation of more appropriate electrodesignals which may cancel undesirable effects of non-ideal situations.
6.REFERENCES
1. G. Bozdai, "Simulation of a 3-D Television Display," MS. Thesis, Bilkent University, Dec. 1990.
2. J.S. Kollin, eLal "Real-Time Display of 3-D Computed Holograms by Scanning the Image of an Acousto-Optic Modulator" ,Proc. of the 2nd Inter. Congress of Optical Sciences and Engineering, 1989.
3. L. Onural, and A. Atalar, "An Acousto-Optical Holographic Three-Dimensional Television Display," US Patent Application number 07/684,845.
4. P.St. Hilaire, eLal. "Electronic Display system for Computational Holography," SPIE Proc., vol. #1212
Practical Holography 4, pp .1212-1220 , 1990.
5. S.A. Benton, elal. "Experiments in holographic Video Imaging," Proceedings of the SPIE Institute on
Hologra-phy, 1991.
6. G.Bozdagi, L. Onural, A. Atalar, "Simulationof a New Holographic 3-Dimensional Television Display," ISCIS VI, Oct. 1991.