SOLID-SOLUTION OF Cd
1-xZn
xS NANOCRYSTALS IN THE
CHANNELS OF MESOSTRUCTURED SILICA FILMS
A THESIS
SUBMITTED TO THE DEPARTMENT OF CHEMISTRY
THE INSTITUTE OF ENGINEERING AND SCIENCES OF
BILKENT UNIVERSITY
IN PARTIAL FULFILLMENT OF THE REQUIREMENTS
FOR THE DEGREE
OF
MASTER OF SCIENCE
By
YAŞAR AKDOĞAN
JANUARY 2006
I certify that I have read this thesis and in my opinion it is fully adequate, in scope and quality, as a thesis of the degree of Master of Science
———————————————— Assoc. Prof. Dr. Ömer Dağ (Supervisor)
I certify that I have read this thesis and in my opinion it is fully adequate, in scope and quality, as a thesis of the degree of Master of Science
———————————————— Prof. Dr. Şefik Süzer
I certify that I have read this thesis and in my opinion it is fully adequate, in scope and quality, as a thesis of the degree of Master of Science
———————————————— Prof. Dr. Hüseyin İşçi
I certify that I have read this thesis and in my opinion it is fully adequate, in scope and quality, as a thesis of the degree of Master of Science
———————————————— Assoc. Prof. Dr. Margarita Kantcheva
I certify that I have read this this thesis and in my opinion it is fully adequate, in scope and quality, as a thesis of the degree of Master of Science
———————————————— Asst. Prof. Dr. Dönüş Tuncel
Approved for the Institute of Engineering and Sciences
———————————————— Prof. Dr. Mehmet Baray
ABSTRACT
SOLID-SOLUTION OF Cd
1-xZn
xS NANOCRYSTALS IN THE
CHANNELS OF MESOSTRUCTURED SILICA
YAŞAR AKDOĞAN
M.S. in Chemistry
Supervisor: Assoc. Prof. Dr. Ömer DAĞ JANUARY 2006
Mesostructured silica can be used as a reaction medium to produce solid-solution of Cd1-xZnxS nanocrystals as thin films. These films were synthesized from oligo(ethylene oxide) non-ionic surfactant (CH3(CH2)11(OCH2CH2)10OH, (C12EO10)), cadmium and zinc nitrate salts ([Cd(H2O)4](NO3)2 and [Zn(H2O)6](NO3)2), water, and tetramethylorthosilicate (TMOS, as silica source) mixtures using a liquid crystalline templating (LCT) approach and metal containing liquid crystalline (MLC) mesophase. Metal ion to surfactant mole ratio was 1.0 which determines the stability and structure of the mesostructured silica. The mesostructured silica film has a 3D hexagonal structure with oriented channels. The silica pore size can be controlled by controlling ageing temperature and time. The pore diameter of the silica channels that aged at room temperature (RT) for two days is 4.7 nm and the one aged at 2500 C for 30 minutes is 3.3 nm.
Cd(II) and Zn(II) incorporated film samples can be reacted at RT under H2S atmosphere to produce zinc blend, Cd Zn S nanocrystals (nano-Cd Zn
S-meso-SiO2) in the channels of the mesostructured silica. The band gaps of the nano-Cd 1-xZnxS-meso-SiO2 vary between 2.6 eV for CdS and 4.1 eV for ZnS. The Cd (II) rich nanoparticles are larger (4.4 nm) than Zn (II) rich nanoparticles (3.1 nm). The silica wall thickness that can be controlled by ageing at different temperatures confines the growth of the Cd1-xZnxS nanocrystals in the pores. By controlling the size of the silica channel between 4.7 and 3.3 nm, one can control the band-gap of the CdS nanocrystals between 2.6 and 2.8 eV.
Keywords: Mesostructured silica, non-ionic surfactant, mesopores, ageing, Metal containing Liquid Crystals, solid solution of Cd1-xZnxS, nanoparticle, semiconductor, band-gap.
ÖZET
MEZO YAPILI SİLİKA FİLM İÇERİSİNDE Cd1-xZnxS
NANOKRİSTALLERİNİN KATI ÇÖZELTİLERİ
YAŞAR AKDOĞAN
Kimya Bölümü Yüksek Lisans Tezi Tez Yöneticisi: Doç. Dr. Ömer DAĞ
OCAK 2006
Mezoyapılı silika, Cd1-xZnxS katı çözeltilerini ince filmler halinde hazırlanmasında tepkime ortamı olarak kullanılır. İnce film numuneler oligo etilen oksit, iyonik olmayan yüzey aktif, (CH3(CH2)11(OCH2CH2)10OH, (C12EO10)), kadmiyum ve çinko nitrat tuzları ([Cd(H2O)4](NO3)2 ve [Zn(H2O)6](NO3)2), su ve tetrametilenortosilikat (TMOS, silika kaynağı) karışımından ve sıvı kristal kalıplama (SKK) yaklaşımı ve metal içeren sıvı kristal (MSK) mesofazların beraber kullanılmasıyla oluşur. Kullanılan tuz:yüzeyaktif mol oranı 1.0, ve bu oran silika mesoyapının kararlılığını ve yapısını tayin eder.Silika mezoyapı 3B hekzagonal yapıda ve oldukça düzenlidir. Silika gözenek boyutları, tepkime süresi ve sıcaklığı ile kontrol edilebilir. Oda sıcaklığında iki gün bekletilmiş filmlerde gözenek çapı 4.7 nm iken 2500C de yarım saat bekletilmiş filmlerin gözenek çapı 3.3 nm dir.
Cd(II), Zn(II) içeren filmler hidrojen sülfür (H2S) ile tepkimeleri sonucunda, çinko blend yapısında Cd1-xZnxS kristalleri mezoyapılı silika kanalları içerisinde oluşur. Cd1-xZnxS nanotaneciklerinin band aralıkları (Eg) 2.6 eV (CdS) ve 4.1 eV (ZnS) arasında değişir. Cd (II)’çe zengin nanotaneciklerin boyutu (4.4 nm), Zn (II)’çe
edilebilen silika duvarlarının kalınlığı Cd1-xZnxS nanotaneciklerin silika gözenekler içerisinde büyümesini sınırlar. Silika kanallarının boyutlarını 4.7 nm ve 3.3 nm arasında kontrol ederek CdS nanotaneciklerinin band aralıklarını 2.6 ve 2.8 eV arasında kontrol etmek mümkündür.
Anahtar Kelimeler: Mesoyapılı silika, iyonik olmayan yüzey aktifler,
mesogözenekler, ageing, metal içeren sıvı kristaller, Cd1-xZnxS katı çözeltileri, nanotanecik, yarıiletken, bant aralığı.ACKNOWLEDGEMENT
I would like to extend my gratitude to;
... Assoc. Prof. Dr. Ömer DAĞ for his encouragement and supervision throughout my studies…
…my family and my wife Gülçin, for their continuous support and help… ... Serhat, Serap, and Letice Günkan, for their hospitality…
…Çağrı Üzüm and Faik Demirörs, for their efforts in this project…
... Past and present members of Chemistry Department; where I learned a lot and made great friends during last 6 years.
TABLE OF CONTENTS
1. INTRODUCTION 1
1.1 Liquid Crystals………... 1
1.2 Mesostructured Materials………... 4
1.3 Nanosized Materials………... 6
1.4 Sol-Gel Processes of Silica……….... 8
1.5 Mesoporous Silica………...……9
1.6 The Lyotropic LC system of Salt:Surfactants and Synthesis of Transition Metal Ions Modified Mesostructured Silica...11
1.7 Cd1-xZnxS Nanoparticles...13
2. EXPERIMENTAL 19
2.1 Materials...19
2.2 Synthesis...20
2.2.1 Synthesis of Mesostructured Silica Templates...21
2.2.2 Synthesis of Cd1-xZnxS nanoparticles………..21
2.2.3 Calcination of the nano-CdS-meso-SiO2………21
2.3 Instrumentation...21
2.3.1 Polarized Optical Microscopy………...21
2.3.2 X-Ray Diffraction...21 2.3.3 UV-Vis Spectra...22 2.3.4 FTIR Spectra...22 2.3.5 TEM Images………...………...22 2.3.6 29Si MAS-NMR...23
3. RESULTS AND DISCUSSION 24
3.1 The Synthesis of Mesostructured Silica...24
3.2 Synthesis of CdS, ZnS and Cd1-xZnxS in Mesostructured Silica Films……….……..35
3.2.1 POM, TEM, EDX, and XRD Analysis…….…………...35
3.2.2 High Angles XRD Analysis of Cd1-xZnxS Nanoparticles…. .41 3.2.3 UV-Vis Absorption Analysis of Cd1-xZnxS Nanoparticles...43
3.3 Effect of Ageing Over the Size of CdS, ZnS and Cd1-xZnxS Nanoparticles in Mesostructured Silica………...49
3.4 Thermal Properties of Nanocrystals………...………59
3.5 Calcination Process……….…….61
3.6 Future Project…….………..………65
4. CONCLUSION……….…….………...68
5. REFERENCES……….………...70
LIST OF TABLES
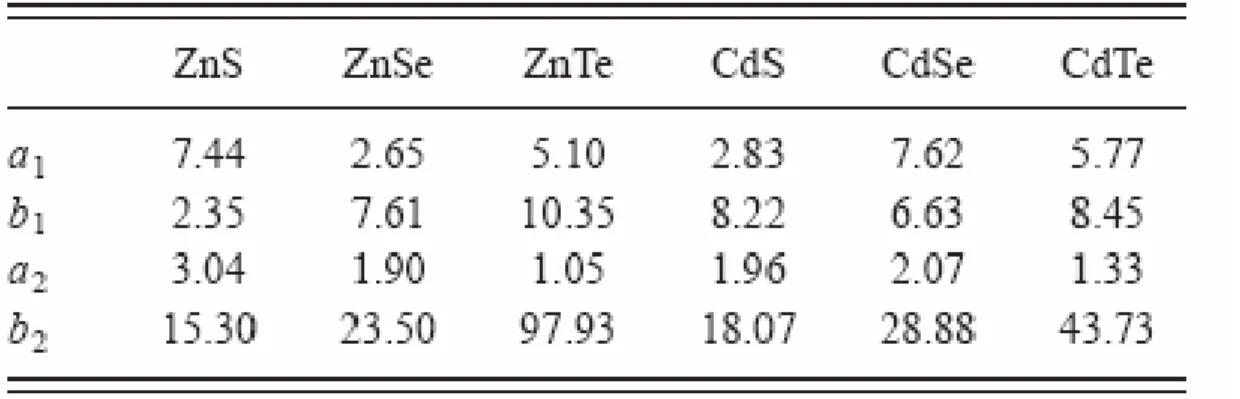
1. Parameters of a and b used in Sarma’s equation…...47 2. Silica channels size difference after applying 3 methods...62
LIST OF FIGURES
1 Representative of phase transition...1 2 Cross sectional diagrams of two structures formed by
amphiphilic molecules in water: (a) micelle and (b) vesicle...3 3 (a) hexagonal phase, (b) lamellar phase, and (c) inverse
hexagonal phase...4 4 Members of mesoporous M41S materials. a)MCM-41,
b)MCM-48, and c) MCM-50...5 5 Representation of the general formation of MCM-41
from inorganic precursors and organic surfactants...6 6 Hydrolysis and condensation reactions of silica oxide...8 7 The schematic diagram of ion-exchange reaction and
CdS formation...16 8 A schematic representation of a hexagonal LC structure,
the small circles represent [M(H2O)n]2+ and NO3 - ions………17 9 The POM images of ZnX2-meso-SiO2, CdX2-meso-SiO2 and
Cd0.5Zn0.5X2- meso-SiO2...26 10 Diffraction of X-Rays and Bragg’s Law...27 11 A plot of linear relation between d-spacing
and (8/(10.667(h2+hk+k2)+3l2))1/2 ...28 12 The XRD patterns of A) (a) [M(H2O)n](NO3)2-meso-SiO2 film and
(b) powder samples, B) Oriented thick and aged at high temperature [M(H2O)n](NO3)2-meso-SiO2 film sample recorded at three different
orientations………..………..29 13 Rotating the film samples from +200 position to -200 position...30 14 The XRD patterns of a) [Cd(H2O)4](NO3)2-meso-SiO2
c)([Cd(H2O)4](NO3)2)0.4-([Zn(H2O)6](NO3)2)0.6-meso-SiO2and
d) [Zn(H2O)6](NO3)2-meso-SiO2...30 15 The XRD patterns of (A) ([Cd(H2O)4](NO3)2)0.5- ([Zn(H2O)6](NO3)2)0.5– meso-SiO2 after aging at RT a) 1 hour, b) 4 hours, c) 1 day, d) 2 days. (B) [Zn(H2O)2](NO3)2-meso-SiO2 after aging at RT a) 1 hour,
b) 4 hours, c) 1 day, d) 2 days...31
16 Schematic representation of a relation between d-spacing and pore size.32 16 The XRD patterns of [Cd(H2O)4](NO3)2- meso-SiO2 after ageing
at 1000C a) 30 minutes b) 3 hours, c) 5 hours, d) 1 day e) 2 days...32 17 The XRD patterns of [Cd(H2O)4](NO3)2- meso-SiO2 film
sample after ageing at a) RT, b) 500C, c)1000C, d)1500C, e)2000C, and f) 2400C...32 18 The 29Si-MAS NMR of 0.5 [Cd(H2O)4](NO3)2-meso-SiO2 samples aged at RT (bottom), 100oC (middle) and 240oC (top)...34 19 The POM images of nano-ZnS-meso-SiO2, and
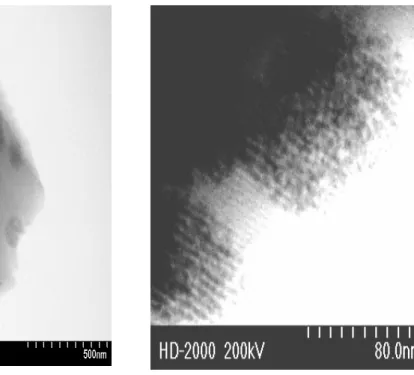
nano-Cd0.5Zn0.5S-meso-SiO2 mesostructured silica films...36 20 The TEM images of thin film samples; A) a bright field
(scale bar is 500 nm) and B) a bright field image
(scale bar is 80 nm) of nano-Cd0.5Zn0.5S-meso-SiO2...37 21 The TEM images of thin film samples A) a dark field image of
nano-Cd0.3Zn0.7S-meso-SiO2 (scale bar is 30 nm) and B) a bright field image of an aged sample of
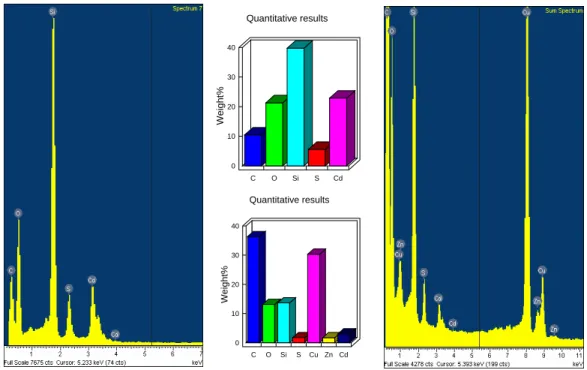
nano-CdS-meso-SiO2 (scale bar is 50 nm)...38 22 The EDX spectra and quantitative elemental analysis of
nano-CdS-meso-SiO2, left and top and nano-Cd0.7Zn0.3S-meso-SiO2, right and bottom, respectively……….……..39 23 The XRD patterns obtained from fresh samples of
a) nano-CdS-meso-SiO2
b) [Cd(H2O)4](NO3)2-meso-SiO2 c) nano-Cd0.7 Zn0.3S-meso-SiO2 d) ([Cd(H2O)4](NO3)2)0.7-([Zn(H2O)6](NO3)2)0.3-meso-SiO2
f) ([Cd(H2O)4](NO3)2)0.4-([Zn(H2O)6](NO3)2)0.6-meso-SiO2
g) nano-ZnS-meso-SiO2 h) [Zn(H2O)6](NO3)2-meso-SiO2...40 24 The XRD patterns of nano-Cd1-xZnxS-meso-SiO2 of mesostructured silica films, where x is (a) 0.00,(b) 0.25 (c) 0.5,(d) 0.85 (e) 1.00……...42 25 A plot of the unit cell parameters evaluated from the XRD patterns
in Fig.3.2.6 versus composition, x in nano-Cd1-xZnxS-meso- SiO2……42 26 The UV-Vis absorption spectra of nano-Cd1-xZnxS-meso-SiO2 films, the spectra in between the spectra of CdS and ZnS are
from the Cd1-xZnxS nanocrystals...44 27 Band-gap values of three compositions in nano-Cd1-xZnxS
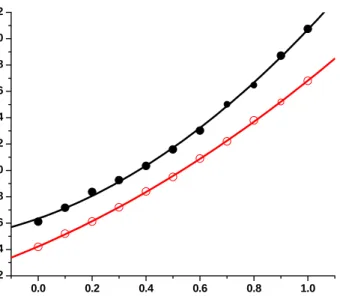
-meso-SiO2 films, when x is equal to 0.0, 0.5, 1.0……….45 28 Plots of Eg versus x of (a) nano-Cd1-xZnxS-meso-SiO2 and
(b) bulk materials………...…...46 29 Plots of band-gap shift (∆Eg) of CdS and ZnS obtained
from an empirical formula of equation (5). ………..………48 30 A plot of particle size evaluated from Fig. 3.2.11 versus x in the
nano-Cd1-xZnxS-meso-SiO2……….……..49 31 The XRD patterns of nano-CdS-meso-SiO2 film samples at
RT for different ageing times, a) 5 min b) 30 min c) 60 min d) 80 min e) 110 min f) 150 min g) 5 hours
h)1 day i) 2days j )3 days………..…..……..50 32 The XRD patterns of [Zn(H2O)6](NO3)2-meso-SiO2 and
nano-ZnS-meso-SiO2, nano-ZnS-meso-SiO2 after ageing at RT for a) 1 hour, b) 4 hours, c) 1 day, d) 2 days e) before H2S reaction……...51
33 The XRD patterns of nano-Cd
0.5Zn0.5S-meso-SiO2 aged atRT before H2S reaction for a) 1 hour, b) 4 hours, c) 1 day, d) 2 days and e) ([Cd(H2O)4](NO3)2)0.5-([Zn(H2O)6](NO3)2)0.5
-meso-SiO2 before H2S reaction………..52 34 The UV-Vis absorption spectra of nano-CdS-meso-SiO2 films,
35 The XRD patterns of [Cd(H2O)4](NO3)2-meso-SiO2 and nano-CdS -meso-SiO2, (A) [Cd(H2O)4](NO3)2-meso-SiO2 pre-reaction after ageing at 1000C a) 30 minutes b) 3 hours, c) 5 hours, d) 1 day e) 2 days. (B) nano-CdS-meso-SiO2 after ageing at 1000C a) 30 minutes b) 3 hours, c) 5 hours,
d) 1 day e) 2 days f)3 days……….………...54
36 Comparison of nano-CdS-meso-SiO
2 XRD patterns aged at RTand 1000 C before H2S reaction, a)30 min, RT b) 30 min,
1000C , c)5 hs, RT d) 5 hs, 1000C e)2 days, RT f) 2 days, 1000C……...54 37 The XRD patterns of [Cd(H2O)4](NO3)2-meso-SiO2 and
nano-CdS-meso-SiO2 (A) [Cd(H2O)4](NO3)2-meso-SiO2 pre-reaction after ageing at a) RT, b) 500C, c)1000C, d)1500C, e) 2000C, and f) 2400C. (B) nano-CdS-meso-SiO2 after ageing at
a) RT, b) 500C, c)1000C, d)1500C, e)2000C, and f) 2400C………..…...55 38 The UV-Vis absorption spectra of nano-CdS-meso-SiO2 films, after ageing at 200 C, 500 C, 1000 C, 1500 C, 2000 C, 2400 C with a
time interval of 45 minutes.……….56 39 The UV-Vis spectra of nano-CdS-meso-SiO2 thin films aged
with 200C and 2400C……….………....56 40 The XRD patterns of films that are; a) [Cd(H2O)4](NO3)2-meso-SiO2 aged at 1500C, b) nano-CdS-meso-SiO
2, aged at 1500C c) nano-CdS-meso-SiO2, ageing at 1500C and washed with ethanol-water mixture, d) [Cd(H2O)4](NO3)2-meso-SiO2 aged at 2200C, b) nano-CdS-meso-SiO2, aged at 2200C
c) nano-CdS-meso-SiO2, ageing at 2200C and washed
with ethanol-water mixture……….…….….…57 41 The XRD patterns of films that are a) before reaction,
[Cd(H2O)4](NO3)2-meso-SiO2 aged at 2500C, b) after reaction, nano-CdS-meso-SiO2, aged at 2500C and washed with
a) before reaction,
b) after reaction, and heating after reaction at c)750C, d) 1500C, e)2500C f) 2500 C for 5 hours. A) No ageing before the reaction, B) Aged at 1500C before the reaction, and C) Aged at 2400C
before the reaction………..……..…….60 43 The UV-Vis spectra of heated nano-CdS-meso-SiO2 at different
temperatures………..61 44 The XRD patterns of the nano-CdS-meso-SiO2 samples that
was aged at 1700C, a) before reaction, b) after reaction, and c) calcination after reaction at 4500C (the temperature was gradually increased in 5 hours from RT to 4500C and heated
for 5 hours at 4500C)………..…...63 46 The UV-Vis absorption spectra of calcined films at 4500C
that was aged at 1700C, a) salt free system, b) before H2S reaction, and c) nano-CdS-meso-SiO2. The inset is the
sample c but reacted with H2S at 1500C………...64 47 The FT-IR spectra of nano-CdS-meso-SiO2 before and
after calcination at 4500 C………..…...65 48 A) The XRD patterns of a)[Cd(H2O)4](NO3)2-meso-SiO2 and
b)nano-CdS-meso-SiO2 and (B)The UV-Vis spectrum of nano-CdS- meso-SiO2 with [Cd(H2O)4](NO3)2:P123
mole ratio of 3.0……….………...66
1. INTRODUCTION
1.1 Liquid Crystals
The term liquid crystal implies a state of aggregation that is intermediate between the amorphous liquid and the crystalline solid. The first observations of liquid crystalline or mesomorphic behavior were made by Reinitzer and Lehmann in 1880th. Several thousands of organic compounds are known to form liquid crystals. They distinguish from liquids by the small degree of order among the molecules that destroys the isotropy of liquids (all directions are equivalent) and produces anisotropy (all directions are not equivalent). Solids can be either isotropic or anisotropic depending on the molecules occupying lattice sites and crystal lattice.1 (Fig: 1.1)
Anisotropic Anisotropic Isotropic
Fig.1.1. Representative of phase transition
Does a liquid crystal more resemble to a solid or a liquid? The amount of energy required to cause a phase transition is called the latent heat of transition and it is a useful
cholesteryl myristate from solid to liquid crystal transition is 65 cal/g, while the latent heat for the liquid crystal to liquid transition is only 7 cal/g.2 This smaller latent heat of the liquid crystal to liquid phase transition is evidence that liquid crystals are more similar to liquids than they are to solids. When a solid melts to a liquid crystal, most of the order of solid is lost, and retained small amount of order is lost at the liquid crystal to liquid phase transition.
The liquid crystal system passes through one or more mesophases before transforming into the liquid phase. These intermediate states may be brought by purely thermal processes (thermotropic liquid crystals, TLC) or by the influence of solvents (lyotropic liquid crystals, LLC). Temperature is the variable that determines which phase of matter exists for all of the TLC. Although temperature is still an important variable in determining the phase, the concentration of one component with respect to the other is far more important in the LLC systems. Through out this thesis work, we used LLC systems. The lyotropic liquid crystals are made by mixing water with amphiphiles which are composed of hydrophobic and hydrophilic blocks. These blocks are covalently linked so microphase separation does not occur and the result is structured with dimensions on the order of 2-10 nm.3 The ratio of water to surfactant determines the structure of the mesophase. If a small amount of surfactant is mixed with water, micelle and vesicles are formed according to strength of the polar head group of the surfactant molecules. If the surfactant molecules have a strong polar head group relative to the nonpolar part, they begin to arrange themselves into spheres with polar groups outside and the alkyl tail group toward the center. This structure is called a micelle. If the head group is not strong, the molecules form spherical vesicles, in which double layers of surfactant molecules form a shell with water inside and outside. Cross sections of vesicles and micelles are shown in Fig. 1.2 .
water water water water
(a) (b)
Fig.1.2. Cross sectional diagrams of two structures formed by amphiphilic molecules in
water: (a) micelle and (b) vesicle.
If the concentration of surfactant material is increased, micelles or vesicles combine to form meso structures such as hexagonal mesophase, in which the long cylindrical rods of surfactant molecules arrange long rod axes in a hexagonal array. Another structure that forms at even higher concentrations is lamella mesophase in which the surfactant molecules form flat bilayers separated from each other by water. Fig. 1.3 shows the hexagonal and lamellar phases. A cubic mesophase forms at concentrations between the hexagonal and lamella mesophases.
Fig.1.3. (a) hexagonal phase, (b) lamellar phase, and (c) inverse hexagonal phase.
Hydrophilic domains are dark colored; hydrophobic domains are light colored.
Hydrophilic and hydrophobic domains of lyotropic liquid crystals may be used as nanoreactors due to their uniform arrangements in nanometer scale. By controlling liquid crystalline mesophase, it is possible to control the size, shape, connectivity, and dimensionality of these nanoreactors,4 and also to control the size and shape of the nanoparticles formed inside them.3 This synthesis mechanism is called template based synthesis mechanism. Inorganic materials copy the shape and the size of the organic templates.5 In this study, hexagonal lyotropic liquid crystal mesophase has been used as a template for sculpting and shaping mesostructured materials.
1.2 Mesostructured Materials
Sol-gel chemistry and self-assembly procedures are used to control the texture of
materials at nanometer scale.6 The growth of soft chemistry, which is derived by inorganic and organized surfactant assemblies allowed to construct mesoscopic materials (2-50 nm); the best examples are mesostructured hybrids and mesoporous inorganic materials.7
Inorganic solids that contain pores with diameters in the size range of 20-500 Å are considered mesoporous materials.8 Extremely high surface areas ( > 1000 m2g-1) and precise tuning of pore sizes put these materials on the center of great interest in the field of nanomaterials.9 Examples of mesoporous materials are: M41S family (16-100 Å), aerogels (> 100 Å), and pillared layered (10 Å, 100 Å) structures.
In the early 1990s, Kato10 and Kresge from Mobil Research and Development Corporation14 declared a new class of materials called FSM and MCM led to a new synthesis strategy for preparing mesoporous materials, respectively. Kato’s and Kresge’s groups used supramolecular templating to produce ordered mesoporous silica with high surface area and pore size, in the range of 2 to 10 nm. The M41S family was synthesized for the first time with regular, well-defined channels in a variety of pore sizes by the Mobil Research group. The liquid crystalline structures formed by the surfactant molecules have been used to assemble mesostructured silica. MCM-41 is the first reported example of mesoporous silica materials from M41S family that has 2D hexagonal pore arrangements.11 Cubic, MCM-48 and lamella, MCM-50 are other members of the M41S family. (Fig.1.4)
Fig.1.4. Members of mesoporous M41S materials, a)MCM-41, b)MCM-48, and c)
MCM-5012
Over one decade, extensive research has been devoted to make more stable materials by expanding the pore size, extending the framework compositions, and
mesoporous materials with pore sizes from 2 to 50 nm,13-14 and mesoporous transition metal oxides,15-19 metal sulfides,20-25 and hybrid silica/organic frameworks.26- 29
There have been a number of mechanisms proposed to explain the formation of mesoporous materials. In general, these mechanisms are based on the presence of surfactants and inorganic precursors (Fig.1.5). According to surfactant molecules concentration and hydrophilic-hydrophobic part lengths, different mesoporous materials are formed with inorganic precursor’s interaction. The metal salts can be used as inorganic precursors to synthesis mesostructured host. Therefore, metal ions can locate easily inside the mesopores to form nanosized materials.
Fig.1.5. Representation of the general formation of MCM-41 from inorganic precursors and organic surfactants.
1.3 Nanosized Materials
Synthesis of nanosized materials has become an important research field because these materials have particular optical and electronic properties, which differ significantly from their bulk materials. Low dimensional materials, including zero dimensional
quantum dots and one dimensional quantum wires, have attracted special attention because of size quantization effects and potential applications in optoelectronics. Some physical properties, such as enhanced local field effects for metals,30 quantum confinement for semiconductors,31 are observed from nanocrystals, smaller than 10 nm. The quantum confinement effect describes how the electronic and optical properties change when the size of materials are smaller than 10 nm. When the length of a semiconductor is reduced below exciton Bohr radius, the quantum confinement effects are observed. The exciton is an electron-hole pair, existing in a material and the distance between the electron and hole within the exciton is called exciton Bohr radius (i.e., a few nanometers). The quantum confinement effect arises in semiconductors when excitons are confined by a potential well in 1D (quantum well), 2D (quantum wire), or 3D (quantum dot). A quantum well is a structure where the size of one direction is comparable with the Bohr exciton radius while the exciton can move freely in other two directions. In quantum wire structure, sizes of two directions are about the Bohr exciton radius, and a quantum dot is a structure where all dimensions are near the Bohr exciton radius, so the exciton can not move freely in quantum dot structure. Therefore, the physical properties of nanocrystals strongly depend on their size, shape, surface state, and arrangement of nanoparticles.
Despite the wide applications of such materials, controlling the particle dimensions can be one of the major problems. For instance, aggregation of nanoparticles and the difficulty of controlling their morphology are known problems.32-33 In order to prevent aggregation, nanoparticles have previously been covered with a protective layer (mono or multi layer films34-35) or have been attached to a variety of support materials (microemulsion,36 sol-gel,37-38 or polymer39-41). Using solid support as a medium for nanoparticle formation has been shown to stabilize the particles and to control their growth.
1.4 Sol-Gel Processes of Silica
Preparation of silica by the sol-gel process usually involves use of a silicon alkoxide. The resultant microstructures of silica gels depend on the concentration of reactants, reaction temperatures, water to alkoxide mol ratios and acidity or basicity of the catalyst. Various starting compounds have been used to prepare silica gels. The most frequently used starting materials are silicic acid, and alkoxysilanes; particularly tetramethoxysilicate (TMOS) and tetraethoxysilicate (TEOS).
In the polymerization reaction, condensation starts as soon as the alkoxy group has been hydrolyzed (Fig. 1.6); silicon-oxygen-silicon bonds are formed immediately after addition of water and catalyst,42 because initial polymerization around hydrolyzed alkoxysilane molecules is quite fast. At a later stage, further polymerization is possible with cross-linking of chains which are separated from one another by alcohol and water molecules. The cross-linking of those chains eventually leads to gel formation.
Fig.1.6. Hydrolysis and condensation reactions of silica oxide.
1.5 Mesoporous Silica as Host Materials
Periodic mesoporous silica materials are one of the most important materials to support nanocrystals. These mesoporous materials can be used as molds to obtain nanocrystals with controlled size and shape. Support materials are prepared using surfactants as structure directing agents. The second step of the process is to modify the internal surface of these support materials. There is a rapidly growing interest in modification methods to produce new functional materials.11 Chemical vapor deposition,43 ion- exchange,44-45 impregnation,46-47 liquid crystalline templating (LCT), 48-49 functionalizing pore walls with organic groups,50 doping mesopores with quantum dots,51 etc. are some methods for modifying mesoporous silica materials.Drug delivery systems,52 synthesis of optical materials,44, 53-54 synthesis of polymers,55 monolayer depositions of thiols,56 encapsulation of metal ions and metal nanoclusters,51, 52-62 etc. are some examples for the modified mesoporous silica materials. Mesoporous silica materials also offer various morphologies such as thin films,63 powders,64 and monoliths,48 for this purpose. There are many studies concerning growth of nanoparticles in the channels of mesoporous powders.43, 65-70 However, in these structures, the particles are usually randomly distributed within the pores where their sizes are not well controlled. Only few studies have reported synthesis of periodic arrays of nanoparticles with rather small domains.71-72 Synthesis of nanowires inside mesoporous powders has also been reported.72-73
For optical applications, it would be better to organize nanoparticle arrays in the film samples instead of the powder samples. Mesoporous silica films are of special interest because of their wide application in optics and electronics, such as lasers74-75 sensors,76 and photochromic films.77 Since mesoporous silica materials are rigid solids, it has to be shaped into thin films at the post synthesis stage. Dip coating provides the means to obtain high quality films. Evaporation induced self-assembly process is basis of the formation of thin films in the dip coating method. Evaporation of the co-solvent at the interface between liquid and air results in concentration of the non-volatile species,
formation of surfactant micelle species and followed by their self-assembly with the silica species.78
Many of the mesopores silica films have regular porous structure. However the structural control on macroscopic scale is difficult. Several parameters have been examined to control the alignment of tubular mesopores in mesoporous silica such as reactant flow,79-80 shearing,81 strong magnetic field,82 and using various substrates with surface structural anisotropy.83-86 Mesoporous silica thin films are potentially excellent hosts for semiconductor structures because of their high degree of order and large band-gap of silica which serves as a barrier material between the nanoparticles.
Synthesis of mesopores silica films using LLC mesophase as a templating media was first reported by Attard et al.48 They have used nonionic surfactants (CnEOm) in their LLC mesophase to produce mesopores silica films and monoliths. Some advantages of using non-ionic surfactants over the ionic surfactants are: thicker inorganic walls, easy tuning of pore diameter and easy removal of surfactant molecules.7,31 Note also that the phase diagrams of the surfactant/silica/water system at high surfactant concentration are similar to the phase diagram of surfactant/water alone. Attard’s method is also known as liquid crystalline templating (LCT) method that uses nonionic surfactants, water and tetramethyl orthosilicate (TMOS). The mixture is a liquid at early stages of the mixing. However, hydrolysis of TMOS, condensation of silica species and evaporation of methanol (hydrolysis side product) and some of water molecules reforms the LC mesophase after a short period of time (5-10 min). Further polymerization of this silicatropic LC mesophase causes the transition from LC phase to mesostructured solid phase.
1.6 Lyotropic LC system of Salt: Surfactants and Synthesis of
Transition Metal ions Modified Mesostructured Silica
Water and surfactant molecules form binary LLC mesostructures which originates from weak intermolecular forces such as van der Waals, dipole-dipole interactions and hydrogen bonding. Small amount of metal salts could be added to the binary system as a third component without a phase separation or a LC phase collapse. The variation in components concentration, salt content, pH and temperature affect stability and structure of the mesophase.
However, some transition metal aqua complex salts could be dissolved in surfactant molecules and induce the surfactants to undergo self-assembly into a LC mesophase without water. Advantage of this salt/surfactant binary system is that one can introduce large amount of salts without destroying the LC mesophase. Dag et. al.87 reported that assemblies formed between the non-ionic oligo-(ethylene oxide) surfactants C12H25-(CH2CH2O)10OH and transition metals aqua complex salts have LC mesophase at various salt/surfactant ratios. Influence of transition metal salt ions to the LC phase has been extensively studied.87-90
The new lyotropic liquid crystalline (LLC) phase can be formed using oligo-(ethylene oxide) surfactants (CnEOm)87 or Pluronics (EOxPOyEOx)91 and some transition metal aqua complex salts [M (H2O)x]Y2 (where M is some of the first and second row transition metal ions and Y is NO3 -, Cl -, and ClO4 – counteranions).87-90 In the new system, different transition-metal salts could be dissolved in water free CnEOm, or in water-CnEOm systems to obtain the LC mesophase. The type and concentration of the metal salts and interactions of metal aqua complex surfactant and metal ion-counteranion collectively induce a self assembly into hexagonal or cubic mesophases. The salt-surfactant system is liquid at low salt concentration (0.5-1.2
higher salt concentrations (above 3.2 mol ratios).87 Addition of water to the salt: surfactant system affects structure of the LLC mesophase. For instance a mixture of water:salt:surfactant at low salt concentrations (salt/surfactant mole ratio below 1.2) is liquid crystalline that collapses upon water evaporation. At higher salt concentrations, the mixture is in liquid phase and evaporation of excess water leads to an ordered mesophase.90 In both systems, salt-surfactant and water-salt-surfactant systems, free water in the LLC and coordinated water (M-OH2) in the new systems49 mediates the self- assembly processes.
In all these organizations, Hofmeister’s series (SO42- > HPO42- > CrO4- > CO32- > Cl- > Br- > NO3- > I- > ClO4- > SCN-) is effective. Anions on the left-hand side of the series are lyotropic and make surfactant molecules more hydrophobic; anions on the right hand side are hydrotropic and make the surfactant molecules more hydrophilic. Therefore, metal salts of lyotropic anions should be less soluble in surfactant, such as SO42-, and Cl- salts are not soluble in CnEOm nonionic surfactants.87 Dag et. al.89 demonstrated that transition metal perchlorate salts are less soluble than nitrate salts in a salt:surfactant LC system despite of the Hofmeister’s series. Coordination of nitrate ion to metal ion center plays an important role in this observation.89
Nitrate ions exist as coordinated and free in the mixture. The coordination of nitrate ion reduces the symmetry of free nitrate ion from D3h to C2v such that stretching mode of free ions splits into two. The spectral changes show that free and coordinated nitrate ions have an equilibrium (1).
[M(H2O)n]2+ + 2NO3- ↔ [M(H2O)n-1(NO3)]+ + NO3- + H2O (1)
At low water concentration, the equilibrium shifts to right and nitrate ions coordinate to metal center. It makes the complex ion +1 charged rather than +2 charged in the free ion case. Coordination of nitrate anions to metal ions reduces ionic strength of medium and it prevents crystallization of the salt in the LC medium. Consequently, position of anions in the medium determines the LC phase stability and structure.
However, in presence of silica species, the LC mesophase appears at relatively low salt concentrations. For example, the LC mesophase of a [Cd(H2O)4](NO3)2-C12EO10 appears at a ~ 1.20 mole ratio with a hexagonal structure,92 but in presence of silica species, the LC mesophase exist at even 0.0 mole ratio. The 2D and 3D hexagonal mesophases are observed in the nitrate salt systems at low salt concentrations.
Addition of silica sources to a mixture of water-salt-surfactant LC phase, a metal ion containing silicatropic LC mesophase forms with hydrolysis and condensation reactions in this media, which eventually goes to a solid phase to form mesostructured silica. Therefore, addition of transition metal ion can be handled at the first step of the process. With complete silica polymerization, the structure becomes stable and can be used as a rigid template for production of nanoparticle.
1.7 Cd1-xZnxS Nanoparticles
Synthesis and characterization of semiconductors are of great interest for both fundamental research and technical applications. There are many novel properties due to large number of surface atoms and three-dimensional confinement of electrons in nanocrystalline semiconductors.93-98 By changing size of particles, degree of confinement of electrons changes and this affects electronic structure of the solid, especially band gaps of the semiconductors.
Among various semiconductor materials, binary metal chalcogenides of group IIB have been the most studied due to their potential applications. They have nonlinear optical and luminescence properties,93-101 quantum size effect,93-104 and other important physical and chemical properties.105-110 For example; nanocrystalline thin films of CdS and ZnS are attractive materials in photoconducting cells and optoelectronic devices such as solar cells and photodetectors.111-112 Also, relevant ternary compound Cd Zn S is a
wide band gap semiconductor. It has various potential applications such as high density optical recording devices, blue or even ultraviolet laser diodes, and photovoltaic cells. 113-114 These applications are based on the quantum-well structures of Cd
1-xZnxS which show adsorption edges changing from green to UV.115
It is well established that well-controlled size and shape can be achieved by controlling thermodynamics and kinetics during nucleation and growth of nanocrystals.116-117 A good control, at the nucleation and growth stages, is one of the most necessary conditions for producing high quality nanocrystals. If the nucleation and growth of nanocrystals occurs at same time, product will have a broad size distribution. One of the methods to separate these two stages is to achieve one pot synthesis without precursor injection method.118 Cao et al. demonstrated the nanocrystals nucleation and growth stages separation in a homogeneous system with the presence of nucleation initiators.
There are different techniques for preparation of CdS nanoparticles such as ionic reactions in liquids,95,114 gas-liquid precipitation,119 and solid state reactions.120 Qian and co-workers developed a solvothermal method to synthesize CdS.121-122 Thermolysis of single source precursor is also an important method to synthesize metal sulfide nanocrystals.124-125 Zhong and co-workers reported a new facile chemical route to size controllable high quality CdS, ZnS and Cd1-xZnxS nanocrystals by using one-pot method in high boiling point long chain amines at high temperatures.125 Low temperature synthesis of group II-VI semiconductor provided several advantages.126 As an example, Parkin et al. developed a liquid ammonia method to synthesize metal chalcogenides at room temperature.127 There are still some limitations by using these methods to synthesize semiconductor nanoparticles. For example, dissatisfying photoluminescence quantum yields, broad particle size distributions or toxic, unstable and pyrophoric agents were employed such as H2S, (TMS)2S or Cd(CH3)2.
Several media such as dispersed media,128 reverse micelles,129 and vesicles128 have been used to form Cd1-xZnxS ternary alloys at room temperature. When nanoparticles are capped inside a dielectric matrix, quantum confinement may be achieved with attractive optical properties and narrow size distributions can be achieved.130 For this reason, several groups have studied these techniques. For example, Atta et al.131 used sol gel technique for the preparation of microcrystalline CdS and (Cd, Zn)S doped titania films to study their optical absorption and fluorescence properties, Padam et al.132 reported structural, optical and electrical properties of solution grown thin films of Cd1-xZnxS and B. Bhattachrjee et al.130 reported the Cd1-xZnxS nanocrystals in the silica thin film matrix. There are few groups investigating synthesis of CdS nanoparticles in channels of mesopores materials. The methods used ion-exchange or impregnation methods that involve reaction under H2S gas.133-134 Zhang et al135 described a method of assembling nanoparticles inside the mesopores of externally functionalized silica MCM-41 materials through the metal ions transportation via ion-exchange reactions. In this method, SiO- is an anion on the nanopore surface and surfactant ions are cationic and organized in the form of a cylindrical micellar structure. They have weak Coulombic interaction that can be easily broken by another cation through ion exchange. Therefore, the surfactant ions can be used to transport metal ions inside the mesopores while the external surface is capped with hydrophobic phenyl group to prevent the possibility of adsorption of hydrophilic metal ions on the external surfaces during the ion-exchange reaction. In the final step, treatment with H2S produced the CdS nanoparticles inside the MCM-41 powder (Fig.1.7). Average diameter of the CdS nanoparticles is less than 2.5 nm and pore diameter is around 3.6 nm.
Fig.1.7 The schematic diagram of ion-exchange reaction and CdS formation.
Besson et al.46 synthesized the CdS nanoparticles within the channels of mesopores silica films with impregnation method. These films have open pores that allow different solutions to fill by impregnation method. The films were calcined at 4500C to remove the surfactant molecules to obtain highly ordered hexagonal films. The cadmium ions were introduced with a basic solution of cadmium nitrate and they were adsorbed on silica walls (cationic metal and Si-O- interaction) that form the internal surface. Diffusion of the H2S into the film precipitates the metal ions to metal sulfides nanoparticles eventually fills the silica pores. To obtain saturated silica pores with CdS nanoparticles, impregnation and precipitation were repeated several times. The formation of nanoparticles inside the silica pores are usually monitored by UV-visible and XRD techniques.
Nanosized ZnS has also been synthesized in the channels of MCM-41 materials by using surface modification methods.43 The pure mesoporous silica sample was obtained by calcination at 5400 C. Functional groups (ethylenediamine groups) were introduced to the pore surfaces of mesoporous silica and the resulting hybrid materials absorbed the
Zn2+ ions in water and ethanol solutions. After reaction with H2S, nanosized ZnS (< 2.5 nm) was produced in the channels of MCM-41 powder.
In this thesis, the Cd1-xZnxS nanocrystals were synthesized in the channels of mesostructured silica films. Our template mechanism is built by the extension of lyotropic liquid crystalline (LLC) mesophase with a new metal ion containing liquid crystalline (MLC) mesophase87-90 that consists of transition metal salts (TMS) and nonionic surfactants, CnEOm. (Fig.1.8) We have added the Cd2+ and Zn2+ ions to the synthesis mixture where the metal ions contribute to the template formation. They locate within the mesopores and form nanocrystals after reaction with H2S. Therefore, we do not need any additional methods such as ion-exchange, impregnation and surface modification to transfer the metal ions into the channels of mesoporous silica films. Other methods need many reaction steps and auxiliaries to synthesize the nanosized materials; however, MLC technique consists of only two steps and does notneed many auxiliaries to synthesize Cd1-xZnxS nanocrystals.
Fig.1.8. A schematic representation of a hexagonal LC structure, the small circles represent [M(H2O)n]2+ and NO3 - ions.
In this assembly process, a mixture of surfactant, acid (as a catalyst), TMOS (as a silica source), and water first produces a liquid mixture, then with hydrolysis and condensation of the silica source liquid mixture is transformed to LC mesophase. Finally, a solid phase by maintaining the structure of the LC mesophase forms. In this system, coordinated water molecules, M-OH2, organize the self-assembly process as Si-OH in the silicatropic and M-OH in the other metallotropic systems.136-137 The LLC and MLC approach collectively allow us to incorporate large amounts of transition metal ions into mesopores. This method has advantages for controlling the morphology, transparency and concentration of nanocrystals in the mesostructured silica materials.
This method allows incorporation of more than one type of transition metal ions at once, such that the compositional flexibility can be introduced into the final materials. The other advantage of the mechanism is structural flexibility in the final material by controlling the structure of the MLC mesophase. Varying the salt concentration, ionic-strength and the type of counter anion in the media49,90 controls the structure of MLC mesophase. For example, transition metal salts with nonionic surfactants, CnEOm produce a 2D hexagonal mesophase; however 2D hexagonal structure changes to 3D hexagonal mesophase with increasing the water concentrations.90 Counter anion also determines the structure of the mesophase. For example, perchlorate salts usually produce cubic mesophase, whereas nitrate salts usually produce hexagonal mesophase.90 Therefore, preparing metal ion containing liquid crystalline mesophase with composition of Cd / Zn mol ratio from zero to infinity enables us to control;
1-The homogeneous distributions of Cd 2+ and Zn 2+ ions in channels of the mesostructured silica films.
2-The structure of the mesostructured silica films.
3-The composition of the Cd1-xZnxS nanoparticles after exposing the silica films to H2S gas.
2. EXPERIMENTAL
2.1 Materials
All chemicals and solvents were reagent grade and used as received without any further treatment.
Surfactants used throughout this work, homogeneous polyoxyethylene 10 lauryl ether, CH3(CH2)11(OCH2CH2)10OH, (designated as C12EO10, Mw=626.862 g/mol) is commercially available from Aldrich, Germany and the triblock copolymer having a poly(ethylene oxide)-poly(propylene oxide)-poly(ethylene oxide) (EO-PO-EO) so called Pluronics, P123 (PEO
20PPO70PEO20, Mw =5800 g/mol) was donated by BASF Corp. and used without further treatment.
Salts, cadmium(II) nitrate tetrahydrate ([Cd(H2O)4](NO3)2), and zinc(II) nitrate hexahydrate ([Zn(H2O)6](NO3)2),were obtained from Aldrich, Germany. Concentrated nitric acid HNO3 (70 %), silica source, tetramethylorthosilicate (TMOS, %99 pure) and hydrogen sulfide (H2S, 99.5 % pure) were also obtained from Aldrich, Germany.
2.2 Synthesis
2.2.1 Synthesis of Mesostructured Silica Templates
Various amounts, respectively, moles of 1-x and x (x is between 0.0 and 1.0) of the [Cd(H2O)4](NO3)2 and [Zn(H2O)6](NO3)2 salts were dissolved in 3 ml of H2O that was acidified by 0.10 grams of concentrated nitric acid (70 %). To this mixture, first 1.00 gram of C12EO10 (1.595 x 10⁻³ mol) and then 1.60 grams of TMOS (1.05 x 10⁻² mol) were added at once. Either gentle heating or simple shaking homogenized the resulting liquid mixture in 30 minutes. Thin film samples were prepared by dip coating with a coating speed of 0.4 mm/s over a glass, quartz and silicon surfaces for various measurements. The thick film samples were prepared by spreading the mixture over the surfaces of microscope slides for POM and XRD measurements at high angles. The Cd2+ and Zn2+ containing mesostructured materials were prepared by varying the Zn2+/Cd2+ and M2+/C12EO10 (M = Zn and Cd) mole ratios from 0.0 to and 1.0, respectively. The mesostructured silica thin films were aged in the oven at various temperatures (RT-2500 C) for various times (Discussed in detail in the results and discussion section).
In the case of Pluronic (P123) surfactant, the preparation route is similar. However, a mixture of TMOS, water, acid, and surfactant (P123) with a composition of 1.6 g: 3.0 g: 0.1 g: 1.0 g, respectively and 3.0 mole ratio of salt:surfactant. P123 is more difficult to homogenize than the C12EO10 surfactant. Therefore, the mixture was stirred to homogenize by a magnetic stirrer before and after the TMOS addition. The clear solution was either dip coated on glass slides or casted over glass slides and investigated by XRD and UV-Vis absorption spectroscopy.
2.2.2 Synthesis of Cd1-xZnxS nanoparticles
The thin film and thick samples were reacted in an evacuated reaction chamber under 150-200 torrs of H2S gas for 5 and 10 minutes, respectively. This process usually produces stable transparent nano-Cd1-xZnxS-meso-SiO2 composite materials with yellow color in the Cd(II) rich samples and colorless at Zn(II) rich samples. The film samples were then washed using water/ethanol (1:1 v/v) solution to prevent the degradation of the Cd1-xZnxS nanoparticles in the channels of silica host.
2.2.3 Calcination of the nano-CdS-meso-SiO2
The thin film samples of nano-CdS-meso-SiO2 material were aged at 1700 C for 15 minutes and then calcined by heating from 25°C to 450°C in 5 hours and kept at 450°C for 5 hours in a temperature controlled oven. Then, the samples were cooled to measure the XRD patterns, UV-Vis and FTIR spectra.
2.3 Instrumentation
2.3.1 Polarized optical microscopy
Polarized optical microscopy (POM) images were obtained in transmittance
mode on a Meije Techno ML9400 series Polarising Microscope with transmitted light illumination, using convergent white light between the parallel and crossed polarizer. The POM images have been used to characterize the mesophases formed from salt:surfactant:silica systems.
2.3.2 X-Ray Diffraction
patterns were recorded in low and high angle regions to monitor both the mesophase and Cd1-xZnxS nanocrystals, respectively. Both the thin films and thick films were prepared on glass and silicon surfaces. The XRD patterns of a sample were collected at least twice in the 1-5, 2θ range with a scan rate of 0.800/minute. The high angle diffraction patterns of some samples were also recorded between 15-600, 2θ values with a scan rate of 0.500 /minute.
2.3.3 UV-VIS Spectra
UV-VIS Spectra were recorded using a Varian Cary 5 double beam
spectrophotometer with a 100 nm/min speed and a resolution of 2 nm over a wavelength range, from 800 to 200 nm. The UV-Vis absorption spectra were obtained from the film samples of nano-Cd1-xZnxS-meso-SiO2 materials over glass and quartz slides.
.
2.3.4 FT-IR Spectra
FT-IR spectra were recorded with a Bruker Tensor 27 model FTIR spectrometer. A DigiTectTM DLATGS detector was used with a resolution of 4 cm-1 and 64 scans for all samples. The FTIR spectra were recorded as thin films on a single Si (100) wafer.
2.3.5 TEM Images
TEM images were recorded on a Hitachi HD-2000 STEM operating at 200kV
and 30mA and a Philips 430 microscope with an accelerating voltage of 120 kV. The samples were prepared by dispersing the powder/fragments onto a carbon film-supported 200 mesh copper grid or embedded in epoxy resin and microtomed.
2.3.6 29Si MAS-NMR
29
Si MAS-NMR (magic angle spinning nuclear magnetic resonance) proton
coupled spectra were recorded using a Bruker DSX 400 spectrometer. Samples were spun at 5000 Hz, the chemical shift values were reported with respect to tetramethylsilane (TMS).
3. Results and Discussion
3.1 Synthesis of Mesostructured Silica Templates
In this thesis, thin film of mesostructured silica was used as a template for the
synthesis of metal sulfide nanoparticles. Metal Containing Liquid Crystalline (MLC) media was used to prepare the mesostructured silica films. Salts ([Zn(H2O)6](NO3)2, and [Cd(H2O)4](NO3)2), surfactant (C12EO10) and water form liquid crystalline mesophases. The salt:surfactant mole ratio is important to create stable lyotropic liquid crystalline mesophase as thin films. In the binary salt:surfactant systems, salts’ hydrate ions interact with surfactant hydrophilic groups and form LC mesophases. Therefore, salt amount must be adequate to form the mesophase. If water is added to the salt:surfactant medium, the LC mesophase form even at low salt-surfactant mole ratio, however, evaporation of the water collapses the mesophase at low salt concentrations.
[Cd(H2O)4](NO3)2, (CdX2) and [Zn(H2O)6](NO3)2, (ZnX2) salts are optically anisotropic when dissolved in CnEO10 surfactants between the ranges of 1.4-3.2 and 1.2-3.4, salt/surfactant mole ratios, respectively.87 Above these mole ratios, they form isotropic cubic mesophase. The change from hexagonal to cubic phase is a result of equilibrium between hydrophilic and hydrophobic domains.87
In order to preserve the LC mesophase as a thin film, we have added silica to the salt:surfactant media that has a salt:surfactant mole ratio of 1.0. Silica species are hydrophilic and assist the salt ions in their interactions with the surfactant molecules. Therefore, despite the water evaporation from the thin film, the polar silica oligomers preserve the LC mesophase. In addition to the hydrophilic effect of the silica species, polymerization with time stabilizes the mesostructure. In this assembly process, the LC mesostructured thin film transforms to solid mesostructured thin film by the hydrolysis
and condensation reactions of TMOS. Nitric acid was used as a catalyst for the silica polymerization reaction. To obtain a highly polymerized silica wall, surrounding the mesopores, the thin films were aged at RT for a long time (1 day to 1 week) and at higher temperatures for shorter time. Ageing process causes further polymerization of the silica walls of the films.
The silica species are hydrophilic and increase the hydophilicity of the media in a salt:surfactant system. At low salt concentrations, the mixture produces 3D hexagonal mesostructured silica. However, the anisotropic mesophase disappears at around a salt to surfactant mole ratio of 1.25 in salt:surfactant silica system.49 Therefore, we optimized the reaction composition by changing the salt:surfactant mole ratio in our synthesis media. A composition of 1.6 g: 3.0 g: 0.1 g: 1.0 g TMOS, water, acid, and surfactant, respectively and 1.0 mole ratio of salt:surfactant produces good quality film samples, which were characterized using POM and XRD techniques.
Anisotropic LC materials have usually two different indices of refraction that allow us to observe optical textures between crossed polarizers. The polarized optical microscopy is a common technique used to determine the structure of LC mesophases. For example, 2D and 3D hexagonal LC phases produce different focal conic fan textures between crossed polarizers. On the other hand, isotropic cubic LC phases do not produce any kind of texture, and its POM image is completely dark.
The silica samples obtained from the [Zn(H2O)6](NO3)2 ,(ZnX2), [Cd(H2O)4](NO3)2 ,(CdX2), and Cd0.5Zn0.5X2: C12EO10 : water : TMOS : HNO3 mixtures display 3D hexagonal fan texture at 1.0 mole ratio of salt/surfactant upon ageing for 1 day. Fig. 3.1.1 shows the POM images of ZnX2-meso-SiO2, CdX2-meso-SiO2 and Cd0.5Zn0.5X2-meso-SiO2 samples. All the images are characteristic of the 3D hexagonal mesostructure.
(a) (b)
(c)
Fig.3.1.1. The POM images of a) ZnX2-meso-SiO2, b) CdX2-meso-SiO2 and c) Cd0.5Zn0.5X2-meso-SiO2.
To complement and further analyze the structure of the film samples, X-ray diffraction method has also been applied. The XRD method is another powerful technique to identify the structure of mesostructured materials. Usually, these materials have diffraction lines at low angles, between 1 and 100, 2θ. The hexagonal (2D and 3D), cubic and lamellar structures are the mostly observed structure types in mesostructured
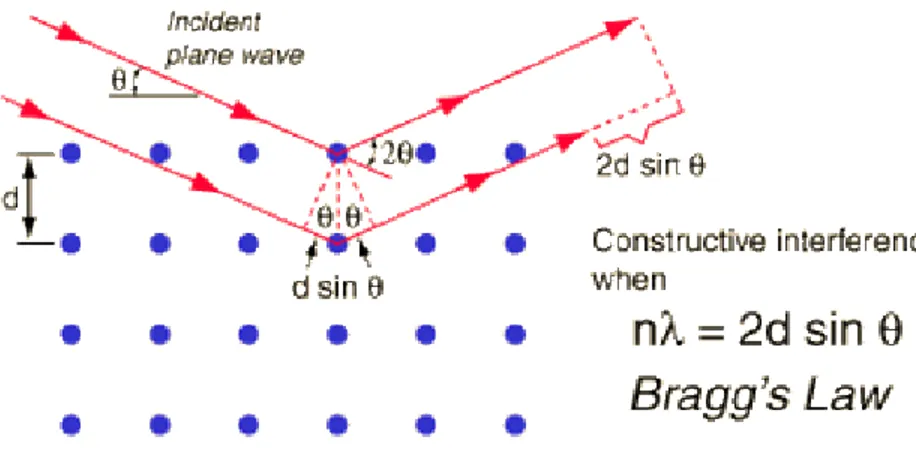
obtained using Bragg’s equation. Fig. 3.1.2 shows the diffraction of X-rays and Bragg’s law.
Fig. 3.1.2. Diffraction of X-Rays and Bragg’s Law
(λ: wavelength, d: the spacing of the layers, θ: the incident angle of the photons).
The silica materials used in this work have a 3D hexagonal structure. The 3D hexagonal structure displays diffraction lines, connected to the following relationship
(where d is d-spacing, h, k, l are reflection indices, and a and c are unit cell parameters).
1/d
2=4/3(h
2+hk+k
2)/a
2+l
2/c
2(1)
The 3D hexagonal structure has a linear correlation in a plot of d spacing versus (8/(10.667(h2+hk+k2)+3l2)).1/2 The slope of this plot gives a parameter with a zero intercept. Fig.3.1.3 displays a plot of the relation between d spacing values of the first four planes in the 3D hexagonal structure and h, k, l relation. The unit cell parameter a is 59.6 Å, and c is 97.3 Å with a c/a = 1.632 with a space group of P63 mm. These are all consistent with 3D hexagonal structure.
0.0 0.2 0.4 0.6 0.8 1.0 0 10 20 30 40 50 60 d-spacing value( Å ) (8/(10.667(h 2+hk+k2)+3l2))1/2 y= 5 9 .6 1 3 -0 .0 0 6 7 x a = 59.6 (100) (002) (101) (102)
Fig.3.1.3 A plot of linear relation between d-spacing and (8/(10.667(h
2
+hk+k2)+3l2)).1/2
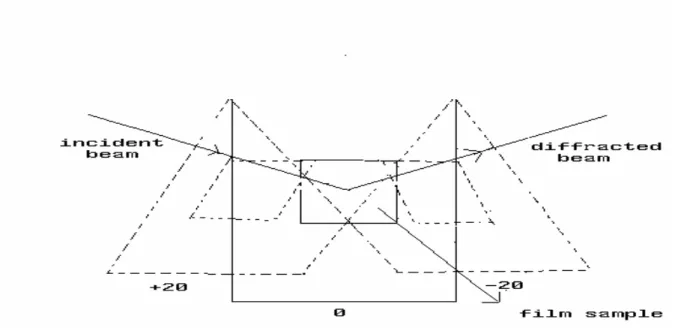
The film samples are usually oriented in one direction and the diffraction planes along these directions dominate to the diffraction pattern. Therefore, we measured the diffraction patterns of the oriented film samples at different orientations to determine the structure of the silica host, Figure 3.1.4 (A) and (B). Figure 3.1.4 (A) and (B) show the characteristic 3D hexagonal XRD patterns with 5 diffraction lines between 1.5 and 5.0, 2θ range, indexed to (100), (002), (101), (102), and (110) lines at 51.6, 48.6, 45.6 and 35.4, 29.8 Å d spacings, respectively.
Fig. 3.1.4. The XRD patterns of A) (a) [M(H2O)n](NO3)2-meso-SiO2 film and (b) powder samples, B) Oriented thick and aged at high temperature [M(H2O)n](NO3)2-meso-SiO2 film sample recorded at three different orientations.
The reason of seeing one diffraction line in the thin film’s XRD pattern (Fig.3.1.4.A-(a)) is the orientation in (100) or in some cases in (101) directions during the film making process. Therefore, measurements at different orientations with respect to the incident beam reveal the other plane of the structure (see Figure 3.1.5). In Figure 3.1.4 (B), the measurements were recorded in three different orientations. Rotating the samples from +200 positions to the zero position, the intensity of (100) line goes down while the intensity of (002) line goes up, Figure 3.1.5. Another way to observe these diffraction lines is to run the powder form of the samples. Crashing the films or monoliths destroys the initial orientations. However, this reduces the intensities of all diffraction lines, Fig. 3.1.4 (A). The XRD and POM results collectively reveal that the [M(H2O)n](NO3)2-meso-SiO2 (M= Zn and Cd) materials have 3D hexagonal structure. Figure 3.1.6 shows typical XRD patterns of thin film of [M(H2O)n](NO3)2-meso-SiO2 (where M is Zn(II), Cd(II), mixed Cd(II)-Zn(II) and salt:surfactant mole ratio of 1.0). The film samples are oriented and display only one diffraction line at 1.800.
1.5 2.0 2.5 3.0 3.5 4.0 0 400 800 1200 (b) 2θ x1/5 (1 0 0 ) (0 02) (101 ) (1 0 2 ) (110) In te n s it y (c p s ) (a)
A)
1.6 2.0 2.4 2.8 3.2 3.6 0 9000 18000 27000 Inte ns ity (cps) 2Θ -20 +20 0 (10 0 ) (0 02) B)
Fig. 3.1.5. Rotating the film samples from +200 position to -200 position.
1 2 3 4 5 0 100000 200000 300000 400000 500000 600000 c d b Intensity (cps) 2Θ a
Fig.3.1.6. The XRD patterns of a) [Cd(H2O)4](NO3)2-meso-SiO2 b) ([Cd(H2O)4](NO3)2)0.7-([Zn(H2O)6](NO3)2)0.3-meso-SiO2
c) ([Cd(H2O)4](NO3)2)0.4-([Zn(H2O)6](NO3)2)0.6-meso-SiO2 d) [Zn(H O) ](NO ) -meso-SiO .
In this thesis, we worked with two types of materials, fresh and aged thin films. Thin films were aged with time at room temperature (RT) or at high temperatures to enhance silica polymerization and to obtain rigid silica walls. Ageing process has an important effect in producing nanocrystals because mesostructured silica becomes rigid that limits the growth of nanoparticles. XRD patterns of aged (at RT) thin films of ([Cd(H2O)4](NO3)2)0.5-([Zn(H2O)6](NO3)2)0.5-meso-SiO2 and [Zn(H2O)2](NO3)2 -meso-SiO2 are shown in Figure 3.1.7. They all have similar diffraction patterns at low angles. The silica polymerization at RT up to two days did not change the pore diameter, (4.7 nm). 1 2 3 4 5 0 20000 40000 60000 80000 d c Intensity (cps) 2Θ a b A 1 2 3 4 5 0 20000 40000 60000 80000 100000 120000 d b c In ten s ity (c ps ) 2Θ a B
Fig.3.1.7. The XRD patterns of (A) ([Cd(H2O)4](NO3)2)0.5-([Zn(H2O)6](NO3)2)0.5 -meso-SiO2 after ageing at RT a) 1 hour, b) 4 hours, c) 1 day, d) 2 days. (B) [Zn(H2O)2](NO3)2 -meso-SiO2 after ageing at RT a) 1 hour, b) 4 hours, c) 1 day, d) 2 days.
In hexagonal structure, the d-spacing corresponding to (100) planes give an idea about the pore size. Figure 3.1.8 shows a schematic diagram of a unit cell. The thickness of the silica wall is about 1.0 nm48. The relation below can be used to estimate the pore size in these materials.
Fig. 3.1.8. Schematic representation of a relation between d-spacing and pore size.
However, heating the films at higher temperatures shrinks the pores due to further condensation of SiOH groups. Figure 3.1.9 shows the XRD patterns of the [Cd(H2O)4](NO3)2-meso-SiO2 samples that were aged at 1000 C from 30 minutes to 3 days. The diffraction line shifts from 1.870 (Figure 3.1.9(a)) to 2.120 (Figure 3.1.9(e)) as a result pore size decrease from 4.5 nm to 3.8 nm upon ageing at 1000 C for 2 days.
1 2 3 4 0 20 000 40 000 60 000 e c d b Intensit y (cps) 2Θ a
Fig. 3.1.9. The XRD patterns of [Cd(H2O)4](NO3)2-meso-SiO2 after ageing at 1000C a) 30 minutes b) 3 hours, c) 5 hours, d) 1 day e)2 days.
The silica condensation constantly shrinks the silica walls until it collapses at higher temperatures. As a result, the diffraction line shifts to higher angles and disappears above 2500C. Figure 3.1.10 shows the diffraction patterns between 1.20 and 30, 2θ, at various temperature of a [Cd(H2O)4](NO3)2-meso-SiO2 film sample. The diffraction line shifts from 1.80 to 2.40 corresponding to a pore size decrease from 4.7 nm to 3.3 nm due to heating from RT to 2400C. 2 3 0 2000 4000 6000 8000 10000 12000 14000 16000 18000 a f e c d In te n s ity (c p s ) 2Θ b
Fig. 3.1.10. The XRD patterns of [Cd(H2O)4](NO3)2-meso-SiO2 film sample after ageing at a) RT, b) 500C, c)1000C, d)1500C, e) 2000C, and f) 2400C.
The mesostructured silica film samples have further investigated using 29Si Magic Angle Spinning Nuclear Magnetic Resonance (MAS-NMR) Spectroscopy. Fig. 3.1.11 shows a series of 29Si MAS-NMR spectra of aged samples (RT, 100oC and 240oC). The 29Si MAS-NMR spectra of the samples display 3 peaks at δ -91, -101, and -110 with
units, respectively. The trend in the spectra shows that Q4 band at -110 ppm increases in intensity with increasing temperature indicating further condensation of the silanol groups. Q2 band at -90 ppm is decreasing due to further condensation of silanol groups at higher temperatures. Q2 and Q3 bands transform to Q4 band with ageing samples.
Fig.3.1.11. The 29Si-MAS NMR of [Cd(H2O)4](NO3)2-meso-SiO2 samples aged at RT (bottom), 100oC (middle) and 240oC (top).
3.2 Synthesis of CdS, ZnS and Cd
1-xZn
xS in Mesostructured Silica Films
3.2.1 POM, TEM, EDX and XRD Analysis
The metal ions of Cd(II) and Zn(II) inside the silica channels react with hydrogen sulfide gas (H2S) to form CdS, ZnS and Cd1-xZnxS nanoparticles. The thin film samples were reacted in an evacuated reaction chamber under 150-200 torrs of H2S gas to produce stable transparent film (represented as nano-Cd1-xZnxS-meso-SiO2) composite materials (where x is from 0.0 to 1.0).
The H2S gas pressure and exposure time collectively affect the nanocrystals formation in the film samples. Deep coating method provides very thin films so we do not need high pressure of H2S gas for its diffusion to all parts of the sample. 150-200 torrs of pressure was enough to obtain transparent nano-Cd1-xZnxS-meso-SiO2 film samples. The top layer of the film reacts with H2S immediately, however layers under the surface react with H2S relatively slow. Therefore, the thin films were exposed to gas for 5 minutes and thicker films were exposed for 10 minutes. If the samples were exposed to gas for long time, sulfur (S8) formation was observed in the thicker films.
The film samples display the same POM image due to 3D hexagonal mesostructured silica before and after H2S treatment. Figure 3.2.1 shows two representative POM images of nano-Cd0.5Zn0.5S-meso-SiO2 and nano-ZnS-meso-SiO2 of mesostructured silica films. The 3D hexagonal mesostructure was preserved after nanoparticle formation inside the silica channels.
(a) (b)
Fig.3.2.1. The POM images of a) nano-ZnS-meso-SiO2, and b) nano-Cd0.5Zn0.5 S-meso-SiO2 mesostructured silica film.
Tunneling Electron Microscopy (TEM) can be used to obtain images of the samples in nanometer scale. Bright-field imaging and dark-field imaging methods are two most common TEM imaging methods. Bright-field images are constructed using the direct electrons, while dark-field images use the diffracted electrons. In the bright-field imaging, regions of the sample that scatter many electrons, like defects such as dislocations, look darker. With dark-field images, strongly diffracting regions look brighter. Figure 3.2.2 shows two TEM images of nano-Cd1-xZnxS-meso-SiO2 and
nano-CdS-meso-SiO2 film samples. Figure 3.2.2 (A) shows a bright field image of a portion of
a nano-Cd0.5Zn0.5S-meso-SiO2 film sample. The Cd1-xZnxS nanoparticles are indicated as
darker spots of sub-micron size (100 nm = 0.1 µ). Figure 3.2.2 (B) clearly shows that these sub-micron spots are composed of small nanoparticles that are around 4 nm. Figure 3.2.2 (B) displays images due to oriented silica channels and Cd0.5Zn0.5S nanoparticles
 2 -meso-SiO 2](https://thumb-eu.123doks.com/thumbv2/9libnet/6023781.127259/45.918.199.800.142.476/figure-shows-typical-xrd-patterns-film-meso-sio.webp)

 2 -meso-SiO 2 film sample after ageing at a) RT, b) 50 0 C, c)100 0 C, d)150 0 C, e) 200 0 C, and f) 240 0 C](https://thumb-eu.123doks.com/thumbv2/9libnet/6023781.127259/49.918.282.759.348.775/fig-xrd-patterns-meso-sio-film-sample-ageing.webp)