PERFORIVIANCE OF MUTUAL FUNDS
IH
TURKEY:
AN EMPRICAL INVESTIGATION
A Thesis
SubmittaiJ to The Faculty and Graduate School
of Business Administration of BHkent University
in Partial Fulfillment of The Requirements
for The Degree of
Master of Business Administration
by
Hakan Kalkan
и G. Li'D äO І Э З Ч
I certify that I have read this thesis and in my opinion it is fully adequate, in scope and reality, as a thesis for the degree of Master of Business Adininistration.
Assoc. Prof Kiir§at Aydogan
I certify that I have read this thesis and in my opinion it is fully adequate, in scope and reality, as a thesis for the degree of Master of Business Administration.
Assoc. Pr6f Göklran Qapoglu
I certify that 1 have read this tliesis and in my opinion it is fully adequate, in scope and reality, as a thesis for the degree of Master of Business Administration.
Assist. Prof Gühiur Muradoglu Approve^I for the Graduate School of Business Adimnistration
ABSTRACT
PERFORMANCE OF MUTUAL FUNDS IN TURKEY:
AN EMPIRICAL INVESTIGATION
Hakan Kalkan
Supervisor: Assoc. Prof. Kui§at Aydogan
Professionally managed portfolios are expected to outperfonn maiket portfolio and ordinary investment alternatives. Managed portfolios have to have both excess maiket timing and asset selectivity skills with respect to naive investment strategies. These expectations cause to many research and studies about performance of professional funds. A majority of recent studies have shown that managed portfolios could not perform better perfonnance than market portfolio.
In this study, the Turkish case is investigated by examining eighteen Turkish mutual fluids between Januai"y 1989 and April 1992. Various mostly used perfoimance evaluation methods (Treynor, Shaqie, Jensen, Treynor-Mazur, Bhattcharya-Pfleiderer) are used to achieve more significant results and a better evaluation by comparmg the results of different methods. A market portfolio that is more appropriate for measuring perfonnance of Turkish funds is developed. This maiket portfolio also indicates a naive investment strategy of ordinaiy investors.
The empirical evidence is consistent with many recent studies. Results show poor mutual hind perfomiance with respect to the market portfolio. Findmgs with different measurement methods are consistent with each other. Market timing and security selection skills found to be weak and support the other results. Findings ai e claimed by significant t-test results.
ÖZET
TÜRK YATIRIM FONLARININ PERFORMANSI: DENEYSEL BİR ARAŞTIRMA
Hakan Kalkan
Yilksek Lisans Tezi, İşletme Enstitüsü Tez Yöneticisi: Doç. Dr. Kürşat Aydogan
Profesyonel yönetime salıip portföylerin market portföyüne ve sıradan yatırım alternatiflerine göre dalıa iyi perfonnans göstenneleri beklenir. Profesyonel fon yönetimleri hem market zamanlaması hem de yatırım aracı seçiminde sıradan yatının stratejilerine göre üstünlük sağlamahdırlaı·. Bu beklentiler profesyonel fon yönetimlerinin performansları ile ilgili birçok arastınna ve çalışma yapıhnasma sebep olmuştur. Araştırmaların büyük bir bölümü profesyonel fon yönetimlerinin market portföyüne üstünlük saglayamadığmı göstenniştir.
Bu çalışmada, Türkiye'deki dumm onsekiz Türk yatırım fonunım Ocak 1989 ve Nisan 1992 dönemindeki perfonnansları ile araştırılmıştır. Dalıa anlamlı sonuçlar ve daha iyi bir değerlendirme için çeşitli, çokça kullanılan performans ölçüm metodları (Treynor, Sharpe, Jensen, Treynor-Mazur, Bhattacharya-PfIeiderer) ve bu metodlarm sonuçlarının karşılaştırılması yapılmıştır. Türk yatmm fonlarının performanslarının ölçümü için daha uygun bir market portföyü geliştirilmiştir. Bu market portföyü ayrıca sıradan yatırımcıların basit yatırım stratejilerini göstermektedir.
Deneysel bulgular öneeden yapılan birçok araştırma ile tutarlıdır. Sonuçlar Türk market portföyüne göre Türk fon peıfomıanslaıımn zayıf olduğunu göstennektedir. Değişik ölçüm metodlarmın bulguları birbirleri ile tutarlıdır. Market zamanlaması ve yatırım aracı seçimi zayıf bulunmuş, ve diğer sonuçları desteklemiştir. Bulgular istatistiksel olaıak anlamlı t-testi sonuçları ile desteklenmiştir.
ACKNOWLEDGEMENTS
I would like to thank to my supervisor Associate Professor Kürşat Aydoğan for his direct support, contributions and valuable comments on tliis study. Also, I would thank to my other thesis committee members Associate Professor Göklımı Çapoğlu and Assistant Professor Giilnur Muradoğlu for their contributions.
I also would like to thank to Tuba Cetin and Nihal Otak from SPK Ankara, who have provided me historical data and related infonnation.
1 also would like to thank to my colleagues İrfan Çetmer, Arda Kaya and Cem Kurdoğlu for their suggestions, to Alev İşler for her helps m editmg, and to Nad Sığın for his encouragement and attention to this study.
Finally, I would like to thank to my family for tlieir love and care, and without whom I would not able to write this thesis study.
TABLE OF CONTENTS
ABSTRACT
OZET
ACKNOWLEDGEMENTS
TABLE OF CONTENTS
LIST OF TABLES
1. INTRODUCTION
1.1 INTRODUCTION
1.2 PROBLEM DEFINITION
2. LITERATURE SURVEY
2.1 BASIC CONCEPTS ON MUTUAL FUNDS
2.1.1 Development Of Investment Companies
2.1.2 Classification Of Investment Companies
2.2 A REWIEW OF LITERATURE
3. THE DATA AND METHODOLOGY
3.1 THE DATA AND SOME CONSIDERATIONS
3.2 METHODOLOGY OF THE STUDY
3.2.1 Form.ation Of Data
3.2.2 Formation Of The Market Portfolio
3.2.3 Models Used In The Study
3.2.4 Evaluation Of The Performance
3.2.4.1 Linear Model In Absence Of Market-Timing
V Vi
ix
1
11
4
4
4
5
9
22
22
24
25
26
28
29
29
IIIAPPENDIX B
Linear Regression Results Of 18 Funds
Bl
B2 Quadratic Regression Results Of 18 Funds
B7
B3 Results Of Quadratic Regression Residuals
B26
3.2.4.2 Market Timing And Selectivity Model
4. FINDINGS
4.1 PART I: Findings On Linear Model
4.2 PART II; Findings On Market-Timing Model &
Comparison Of The Models
5. CONCLUSIONS AND RECOMMENDATIONS
REFERENCES
APPENDIX A
A1 Results Of Alpha Values In Analysis Of Linear
Regression Model (Market Timing is Absent)
A2 Results Of Sharpe Performance Measure
A3 Results Of Treynor Performance Measure
A4 Results Of Alpha Values In Analysis Of Quadratic
Regression Model (Market Timing Is Present)
A5 Results Of Beta-2 (p
2) Values With
Market Timing Model
A6 Results Oi
, S \ And r In Analysis Of
Bhattacharya & Pfieiderer Model
A7 Results Of Alpha Values In Analysis Of Linear
Regression Model (Fund No. 10 Excluded)
A8 Results Of Alpha Values In Analysis Of Quadratic
Regression Model (Fund No. 10 Excluded)
A9 Summary Of Results Of Models Used
(Funds Are Ranked According To Their Id No.s)
35
35
38
41
44
A1
A2
A3
A4
A5
A6
A7
A8
A9
32
LIST OF TABLES
TABLE 2.1
Growth Of Investment Company Assets (USA)
7
TABLE 2.2
Sizes And Proportions Of Funds By Type
(Dec. 31, 1980 USA)
TABLE 2.3
Average Portfolio Structures Of 36
Mutual Funds In Turkey (Dec. 29,1989)
10
TABLE 3.1
Mutual Funds Examined In The Study
25
TABLE 4.1
Average Returns For Funds And Market
Portfolio Assets
38
TABLE 4.2
Comparison Of Equally Weighted Portfolio
With Market Portfolio
39
TABLE 4.3
Summary Statistics For The Effect Of
Market Timing
1. INTRODUCTION
1.1 INTRODUCTION
The investment performance of mutual fund managers has been extensively examined in the finance literature. The topic is important for clients who invest their money in mutual funds and expect better returns beeause of a managed portfolio, for professional mutual fund managers who are directly responsible for the success and/or failure of mutual funds and evaluate the success and effectiveness of their strategies and responses, and for legal regulators (like various government agencies) that design the rules and policies of the market operations.
1.2 THE PROBLEM STATEMENT
The investment performance of managed portfolios has received a great deal of interest and attention in academie areas and finance literature.
Mutual funds should give or expected to give at least higher returns than the market average or a small investor who is unable to analyse and manage an effective portfolio. However, reeent studies have shown somewhat different
evidence and conclusions about the superior performance of mutual funds examined.
Although there is no consensus on superior performance of mutual funds and performance evaluation techniques, there are some different hypothesis, empirical findings and evidences that each tries to give a different explanation about the theory and the actual results. The major complexity and discussions arise in evaluating the performance and interpreting the findings.
Sharpe (1966), Treynor (1965) and Jensen (1968) developed some measures for performance measuring in mid-sixties. Although all of these measures have some weakness, they are commonly used in the empirical studies.
Most studies are based on the validity of
Capital Asset Pricing Model
(CAPM), however some researchers argue that
Arbitrage Pricing Theory
(APT) is more useful in performance measuring and approaching to different findings and results.In the 80's, research focused on market timing and selectivity performances of mutual funds. More advanced and different measures are used for this evaluation rather than previous measures. Studies show different results in the presence of market timing and selectivity and without them.
The purpose of this study is to investigate the Turkish case; that is whether Turkish mutual funds outperform the market or not. Unfortunately, unlike
foreign countries such as USA, there are a few numbers of mutual funds in Turkey and they have been in place for only a few years. This survey investigates the performances of eighteen Turkish funds between January 1989 and April 1992 according to Sharpe, Trcynor and Jensen performance measures.' Since almost all of these funds show money market fund characteristics, it is irrelevant to compare their performances with Istanbul Stock Exchange (IMKB) index or similar indexes; rather it is more appropriate to construct a composite index which consists of several securities that all funds have invested in. Also for simplicity, the weight (proportions) of the securities in composite index is not changed to represent a naive and diversified (passive) investment policy providing an unmanaged diversified portfolio. This index also can be considered as an average non-professional investor's portfolio; in the rest of this text, this composite index is defined and used as the market index or the market portfolio in the rest of this study. The market portfolio is composed of eight assets: Gold, US Dollar, German Mark, Treasury bills, certificates of deposit (CD), commercial paper, corporate bonds, and common stock. Also a market timing and selectivity analysis are made for comparing the results with the former ones.
By the end o f April 92, there were more than 70 mutual funds in Turkey. But most o f them were established after 1990, this brings difficulties o f (1) increasing the examined funds will reduce the covered time period, (2) extending the time period will reduce the number o f funds examined. So, the time period is selected to
2. LITERATURE SURVEY
Beiore introducing the basic literature of mutual fund performance evaluation, it is better to examine some basic concepts of mutual funds, the differences among them, and to review some definitions about the mutual funds.
2.1 BASIC CONCEPTS ON MUTUAL FUNDS
Investment companies sell their shares of stock and invest the funds obtained by selling these stocks to various kinds of securities in market.
Investment companies are preferred by individuals as small investors because of their wide diversification that results from investing in a wide variety of securities and professional management that provide professional analysis of market and securities and expected to outperform an unmanaged portfolio invested by small individual investors. However, very few of mutual funds provided superior performance results for an extended period, so did small investors.
After 1940, mutual fund industry showed a great amount of growth and
SEC
(Seciiriiy Exchange Commission)
in USA put some legislation andregulations to protect individuals who invest in investment companies such like providing investors with complete and accurate information concerning the characteristics of fund securities, strategies and policies etc.
In 1970, the legislation is redesigned to provide more accurate establishment of sales charges, fees and commissions.
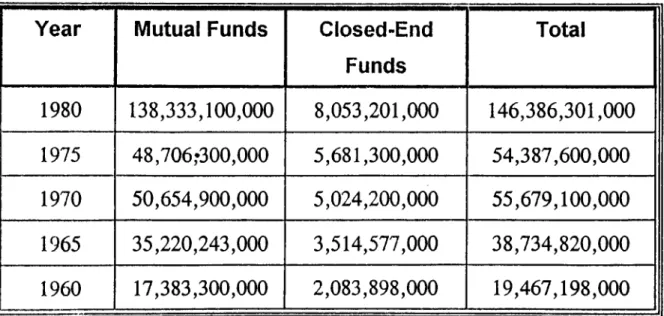
The growth and size of investment companies is shown in Table 2.1. This development caused life insurance companies entering the market and created many funds for the last twenty five years. In late 1970s, new types of investment companies like money market and liquid management are formed because of
rising interest rates and stationary stock market.
2.1.2 Classification of Investment Companies
Investment companies can be classified according to readiness to sell additional shares (open capitalisation) such as open-end or mutual funds and closed capitalised or closed-end funds. Mutual funds are ready to sell, always, additional shares; but closed-end funds, like a business corporation, have
Table 2.1 GROWTH OF INVESTMENT COMPANY ASSETS (USA)
Year
Mutual Funds
Closed-End
Funds
Total
1980 138,333,100,000 8,053,201,000 146,386,301,000 1975 48,706,-300,000 5,681,300,000 54,387,600,000 1970 50,654,900,000 5,024,200,000 55,679,100,000 1965 35,220,243,000 3,514,577,000 38,734,820,000 1960 17,383,300,000 2,083,898,000 19,467,198,000stationary outstanding shares, however, closed-end funds may sometimes sell additional securities such like stock as business corporations do. In 1980, almost 95% of the total assets of all investment companies were mutual funds. ( Refer to Table 2.1 for comparison of mutual and closed-end funds )
Another classification is to group investment companies according to their investment strategies and policies. Each management team has to state its policy so that investors prefer funds whose policy coincides with his investment strategy. Main policies are as follows:
Common Stock Funds; These funds continuously invest 90% to 95% in common stocks. There are growth and growth and income funds in this category.
Balanced Funds: These funds continuously have diversified portfolios composed of several securities like common stocks, preferred stocks, bonds; and proportions are indicated by these funds. They seem like conservative and passive investment strategies and lost their importance by time and their proportion dropped from 4% in 1978 to 2.5% in 1980
Income Funds: These funds invest in securities for relatively high income. Their proportion in total funds dropped from 14% in 1977 to 7% in 1980.
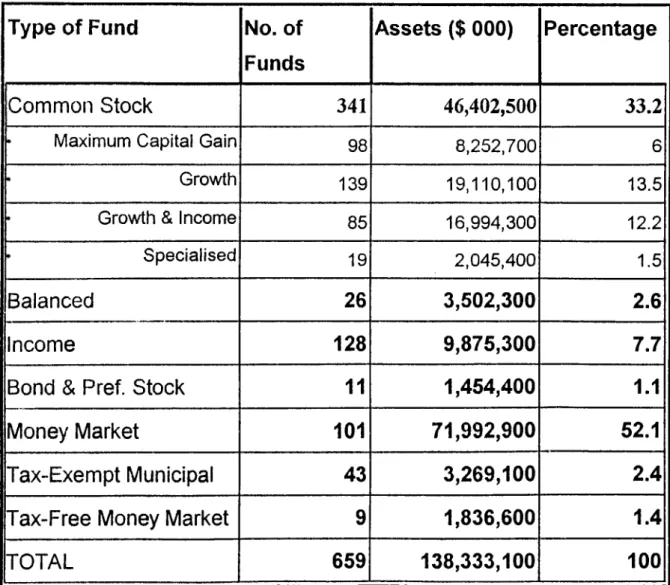
Bond and Preferred Stock Funds: These funds invest only in bonds and preferred stocks. Their proportion dropped from 7% in 1977 to 1% in 1980. Money Market Funds: These funds invest heavily on short term government securities ( e.g.. treasury bills ), commercial paper, certificates of deposit, etc. Their purpose is stability of price and high income. Their assets increased from $4 billion to $ 72 billion in 1980.
Sizes and proportions of funds according to their policies are shown in Table
2
,2
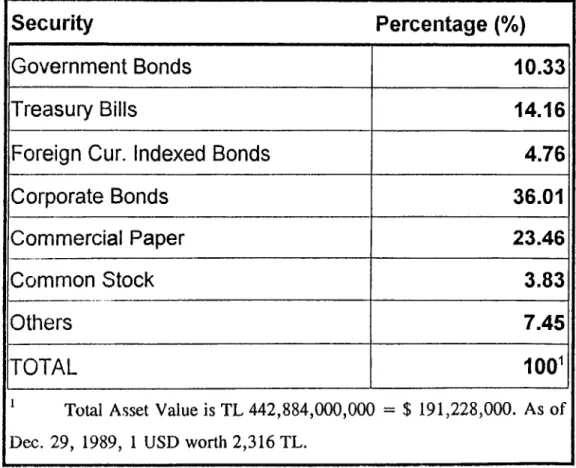
.As a remark, the distribution of the average weights of the securities and total asset values of 36 existing Turkish fund in 12/89 are given in Table 2,3. As seen from the table almost all funds behave like money market funds and bond funds except a few. One can easily show the enormous difference between asset values of Table 2.2 and Table 2.3.
Table 2.2 SIZES & PROPORTIONS OF FUNDS BY TYPE^
(Dec. 31,1980 USA)
Type of Fund
No. of
Funds
Assets ($ 000) Percentage
Common Stock
341
46,402,500
33.2
•
Maximum Capital Gain
98
8,252,700
6
•
Growth
139
19,110,100
13.5
•
Growth & Income
85
16,994,300
12.2
•
Specialised
19
2,045,400
1.5
Balanced
26
3,502,300
2.6
Income
128
9,875,300
7.7
Bond & Pref. Stock
11
1,454,400
1.1
Money Market
101
71,992,900
52.1
Tax-Exempt Municipal
43
3,269,100
2.4
Tax-Free Money Market
9
1,836,600
1.4
Table 2.3 AVERAGE PORTFOLIO STRUCTURES OF 36 MUTUAL
FUNDS IN TURKEY (Dec. 29,1989f
Security
Percentage (%)
Government Bonds
10.33
Treasury Bills
14.16
Foreign Cur. Indexed Bonds
4.76
Corporate Bonds
36.01
Commercial Paper
23.46
Common Stock
3.83
Others
7.45
TOTAL
100'
‘ T otal A sse t V a lu e is T L 4 4 2 ,8 8 4 ,0 0 0 ,0 0 0 = $ 1 9 1 ,2 2 8 ,0 0 0 . A s o f D e c . 2 9 , 1 9 8 9 , 1 U S D w orth 2 ,3 1 6 T L .2.2 A REVIEW OF LITERATURE
The rapid growth of mutual funds both in size and number caused investigation of the investment performances of these managed portfolios. Mutual fund
performance evaluation received a great deal of interest and attention in academic areas and finance literature.
Treynor (1965), brought a new way of evaluating the performances of mutual funds while discussions and hypothesis about mutual fund performance evaluation were lack of significant importance. Treynor suggested that there had to be two dimensions for determining the investment performance of a portfolio: Portfolio's return and its risk. He argued that risk and return have both to be considered for complete evaluation and comparison of managed portfolios. He also mentioned that investment risk had to be diversified in portfolio hence consisted only of systematic component. He based his assumption to the validity of CAPM and
Security Market Line (SML).
SML isthe following equilibrium relationship:
E i
— R f
P /(E m
R f )
(
1)
where
E i
: Expected return on portfolio iE ,n
: Expected return on Market PortfolioR f
: Risk free rateP
i
:
Systematic risk or Beta of portfolio i Eq. 1 can be rewritten asEq. 2 provides that the risk adjusted excess rate of return must be the same for all portfolios. By using empirical data it may;
( « , - / ? / ) / P , . ^
R „ , - R f
(3)where
R i
:
Estimate of return on portfolio iR Щ
: Estimate of return on market portfolio(3
^:
Estimate of systematic risk of portfolio i Treynor showed that:( й , - Л / ) / р ; >
R „ - R f
is superior performance and vice versa.
Treynor's
reward to volatility
ratio( R i — R j ) /
has some shortcomings: It assumes that not only CAPM is valid, SML exists and portfolios lie on this line (all but systematic components of portfolios are diversified away). Also it is a relative measure, it needs a market to compare performance.Sharpe (1966), extended the study of Treynor and proposed to use
reward to
variability
instead of Treynor'sreward to volatility
ratio. Sharpe argued thatalthough Treynor ratio or index was a good measure for performance evaluation, if some relatively undiversified funds existed, Treynor index could
not capture the portion of variability due to lack of diversification. Instead, he suggested to use total risk or variability, that is standard deviation instead of beta. He based his assumption on Capital Market Line CML instead of SML. CML is expressed by the following equation:
Ep = R f
+ [ ( £ ■ ,„- R f ) !
cj„, ]rsp
(3)where
E p
: Expected return onefficient
portfolio Cp
: Standard deviation ofefficient
portfolio<5ni
: Standard deviation ofmarket
portfolioThis line is the combination of risk free asset and efficient portfolio. Another line can be formed by combination of any risky asset with risk free asset:
E :, = R f + [ { E i - R f ) l
a , ]a·.
(4)where
E z
: Portfolio z composed of risky asset i and risk free assetE i
:
Risky asset iGz
: Standard deviation of portfolio zGi
: Standard deviation of risky asset iThen it is possible to draw a line with slope equal
to ( R i ~ R / ) / S
/ whereR i
andS i
are the estimates ofE
/ and G/ respectively. Although portfolioz can be anywhere on the line, the slope is determined by portfolio i 's excess return over unit risk. This enables us to compare the portfolios risk adjusted
returns or reward to variability ratios. One can compare these slopes of different portfolios and choose the one with highest slope as the most superior portfolio, because for same level of risk it gives the highest risk premium. That is:
{ R a - R / ) l Sa > { R h - R i ) l Sh
means portfolio A is superior than portfolio B.
Sharpe Index (SE), like Treynor Index (TE), is a relative performance measure but safer than TE because it is also valid for undiversified portfolios.
Jobson and Korkie (1981), argued that SE has weakness of dealing with estimates of
R i
and CT/ since these estimates are random variables so that SE may not perform well for relative comparisons. They developed a measure ealled JK Test.J K
= G,«\Xi —
G/\i,n
where )d/ is population mean excess return on portfolio i,\Xm
is population mean excess return on market, G / is population standard deviation of portfolio i, and G / is population standard deviation of market. JK is computed by putting estimates of these parameters. Jobson and Korkie argued that this proeedure overcame SE's weakness by having the difference of risk weighted mean excess returns.Sharpe (1966) , tested his measure on 34 mutual funds between 1954-63 and found that only 11 of them beat Dow-Jones portfolio showing a poor average performance (He found reward to variability ratio as 0.667 and average R/V of
34 funds as 0,633). However, he declared that average fund performance would approach to market performance when gross returns had been used.
Jensen (1966), developed an
absolute
performance measure that enabled to have definite standards of measuring. By this way one could easily comment on a portfolio's performance by only looking at its performance value instead of comparing with market value. Jensen defined his performance measure as portfolio manager's predictive ability: his ability to earn returns from successful prediction of security prices that are higher than those which are expected, given the risking of his portfolio. Jensen run a time-series regression of a portfolio's excess return on market's excess return:R if — R f —
cx/ + (3/(R nif
/ ? / ) (5)where
R it
: Return on portfolio i at period tR fiu
: Return on market portfolio at period tOC/ : Y-intercept P
i
:
Systematic risk Eq. 5 can be rewritten as:R i ~~ R f ~
Pi
i.R m ~ R f)
(
6
)
where
САРМ assumes that, on average, ОС/ — 0 . Sharpe and Trey nor accepted the intercept as origin. However, Jensen claimed that alpha can be anywhere including origin indicating that an alpha above and below origin represents an evidence o f superior and inferior performances respectively. Alpha represents a performance equal to large randomly selected unmanaged portfolio performance or market portfolio performance. A positive alpha value indicates that a portfolio is outperforming the market because of either superior ability in selecting undervalued securities (security selection skills), or superior ability in understanding the trends of market (market timing skills), or both of them, vice versa.
Jensen tested his absolute performance measure on 115 mutual funds between 1945-64 and his results were consistent with Sharpe's.
Jensen measure is commonly used in performance evaluation procedures because o f its absoluteness and easiness to interpret. While numerical values of Sharpe and Treynor indexes can only be used for comparison and do not carry any importance without market value, Jensen measure is absolute and its value shows abnormal gain or loss in per cent return henee significant on its own. Fama (1972), suggested that the return on a portfolio could be subdivided into two parts: the return from security selection (selectivity) and the return from reducing risk by diversification (market timing). He pointed out that when perfect diversification was not made, the measure had to take investor's behaviour to unsystematic risk as well as systematic risk.
In absence of unsystematic risk,
=
^S^Si + s
2ei (7 )
where
S i
, (S' /7j : Estimates of standard deviations of asset i and marketS
: Error termThe first term of right hand side is systematic component and the last is unsystematic risk. Fama claimed that it was important to find out if a fund's return compensated for this additional risk. He defined a hypothetical beta P/? in case unsystematic risk is zero.
Р/, =
Si
/
S
m(
8)
By using CAPM,
E l = R f + % { E , n - R f )
(9)Then it is possible to decompose selectivity and market timing by the following equation:
R i - E i
=[
e4 - E ^ + [ R i - E l ]
(
10
)
RHS of Eq. 10 shows the return components. The first one comes from diversification or market timing and the other from selectivity.
Treynor and Mazur (1966), developed Jensen's original model to determine both selectivity and market timing skill. They added a quadratic term to the regression equation to provide the assumption that managers who forecast market returns held greater proportions of the market portfolio when market return was high and smaller proportion when return was low hence excess portfolio return was a non-linear function of excess market return:
R It
—
a / + P i / i ?nit
+^2 i R mt
(11
)where
R it , R mt
are excess returns,CLi
, P2/ are measures of selectivity and market timing ability, respectively.Jensen (1968), demonstrated that, in presence of market timing ability, estimated alpha and beta in Eq. 7 would be biased upward and downward respectively. Grant (1977), showed that market timing will cause alpha to be downward biased which is not the case in Jensen's demonstration. Bhattacharya and Pfleiderer (1983), by correcting Jensen (1972)'s error, 1972, developed the model to measure market timing and selectivity similar to Treynor and Mazur:
p, = a p
+ E ( R „ ) { l - D ) R „ „ + D T { R
+ T D E , R m ,
(12)where
^ pt
^ nit
Excess return on portfolio in period t
т
D
E t
CLp
E ( R
,„): Fund manager's response to information
: Coefficient of determination between manager's forecast and excess return on market
: Management forecast error
: Indicator of security selection skill : Expected value of market return
This quadratic regression gives the value of alpha meaning selectivity skill of portfolio manager. They defined
D —
,
where r is their measure for market timing ability.Lee and Rahman (1990), used Jensen index to measure the performances of 93 mutual funds between 1977 and 1984 by considering market timing analysis. They found out that when market timing is ignored, that is, by using Jensen's original formula, average of alphas of funds were significantly negative; however when timing is considered, it was significantly positive. There was little evidence o f market timing. They also pointed out there was heterosedasticity error occurring when timing is considered.
Henrikson (1984), found empirically that there is no evidence or support for portfolio managers following a successful market timing strategy. He also stated there was a negative correlation between selectivity (alpha) and market timing (r). Henrikson argued that this brought questions on the validity of using CAPM when market timing was considered.
Коп (1983), tested market timing on 37 mutual funds in 1960-1976 period and stated that there was not significant market timing ability of managers although 14 of them had positive timing estimates. However, his findings were consistent with Henrikson's about negative correlation between market timing and selectivity.
Jagannathan and Korajczyk (1986), argued on the possibility of having negative correlation between timing and selectivity because of no true timing and selectivity process.
Lehmann and Modest (1987), used a performance evaluation method based on APT (Arbitrage Pricing Theory) instead of CAPM and found significant positive timing and selectivity performance. Unlike Kon, Henrikson, and Jagannathan and Korajczyk, they found no evidence on negative correlation between timing and selectivity. They also stressed on different results with CAPM and APT models and sensitivity of results to the chosen benchmark, which is the market portfolio to be used in measuring analysis (Benchmark can be one of value or equally weighted stock market indices, industrial indices, or some other indices according to purpose of study. By choosing different benchmarks they reached different conclusions.
Grinblatt and Titman (1989), tested mutual fund performance by using Jensen index for both actual and gross returns of 157 funds between 1975-84. They empirically found out that although mean of alphas for actual returns was negative, the alpha mean increased to be significantly positive when
hypothetical or gross returns (returns having management fees, transaction costs and other expenses not deducted from them) were considered. They claimed this result with the idea of some funds had a superior management talent, but their expenses and costs (e.g. management fees, research expenses) were higher to hold this superior talent in that fund resulting these funds not offering investors an opportunity to achieve abnormal returns by purchasing fund shares. They also focused on benchmark inefficiency. They examined that choosing the right benchmark for performance measuring study was an important problem resulting different findings and conclusions about the same data. They pointed out that benchmarks like equally and value weighted market indexes contained some biases such as size effect for some funds. They suggested to use a benchmark called P8 portfolio for performance measurement developed by themselves. Their claim is a passive diversified portfolio strategy has to have 0 abnormal return by using Jensen index and they tested P8 on these funds with other benchmarks and P8 gave the most efficient results providing most of these funds' performance equal to 0.
Kryzanowski and Sim (1989), stated empirically that if non-synchronous trading was considered, the performance measures would be different. They found that by using JK Test on two Canadian indexes, JK test results tend to increase when non-synchronous trading was considered.
Cumby and Glen (1990), examined the performance of 15 US based internationally diversified mutual funds between 1982-88 period. They found no evidence that these funds provide investors an opportunity to outperform the
international markets. They also pointed out that there was not evidence on market timing of these funds.
Hagigi and Kluger (1991), developed a performance measure called safety first which resulted different rankings from Sharpe and Jensen measures.
3. THE DATA & METHODOLOGY:
3.1 The Data and Some Considerations
The data for this study primarily cover 18 mutual funds in Turkey; and
Gold
(Curnhuriyet),
US Dollar, German Mark,
Treasury bills, certificates of
deposit (CD),
commercial paper, corporate bonds and IMKB Value Weighted
Index
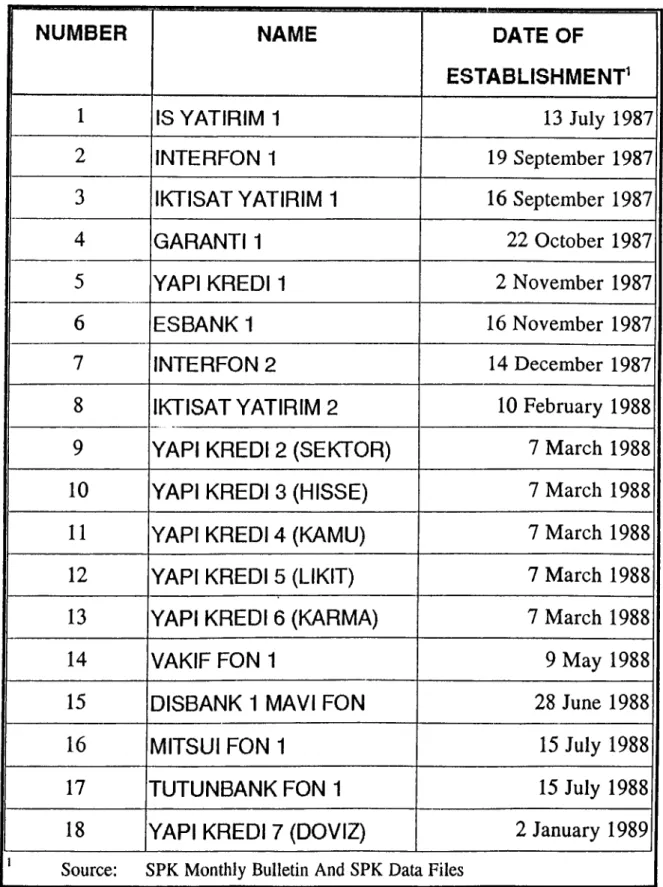
which all of them construct the Turkish market portfolio. Table 3.1shows the mutual funds examined for the study.
Data is determined from
SPK ( Capital Markets Board)
in Ankara. The data primarily consist of end of month prices per share of 18 mutual funds; effective selling prices of Gold (Cumhuriyet), US Dollar, and German Mark; effective annual interest rates of Treasury Bills, Certificates of Deposit, commercial paper. Corporate Bonds and IMKB value weighted index. (market portfolio are composed of these assets ) between January 1989 and April 1992. The period is approximately three and a half years and there are 40 data points for each fund and assets listed above. SPK holds data for certificates of deposit, treasury bills, corporate bonds and commercial paper in form of annual effective interest rate.TABLE 3.1
MUTUAL FUNDS EXAMINED IN THE STUDY
NUMBER
NAME
DATE OF
ESTABLISHMENT'
1 IS Y A T IR IM 1 13 July 1987 2 IN T E R P O N 1 19 September 1987 3 İK T İS A T Y A T IR IM 1 16 September 1987 4 G A R A N T 1 1 22 October 1987 5 Y A P I K R E D İ 1 2 November 1987 6 E S B A N K 1 16 November 1987 7 IN T E R P O N 2 14 December 1987 8 İK T İS A T Y A T IR IM 2 10 February 1988 9 Y A P I K R E D İ 2 (S E K T Ö R ) 7 March 1988 10 Y A P I K R E D İ 3 (H İS S E ) 7 March 1988 11 Y A P I K R E D İ 4 (K A M U ) 7 March 1988 12 Y A P I K R E D İ 5 (L İK İT ) 7 March 1988 13 Y A P I K R E D İ 6 (K A R M A ) 7 March 1988 14 V A K IP P O N 1 9 May 1988 15 D IS B A N K 1 M A V İ P O N 28 June 1988 16 M IT S U I P O N 1 15 July 1988 17 T U T U N B A N K P O N 1 15 July 1988 18 Y A P I K R E D İ 7 (D Ö V İZ ) 2 January 1989Risk-free rate is taken one month rate of 3 month Treasury bills. However, sinee the bid priées of these bills sometimes vary a lot, one may eonsider that risk-free asset contains some amount of price-yield volatility (risk), because its variance is significantly greater than zero.
A remark for the data of this study is that studies of mutual fund performances mostly cover a longer time and more funds in sample. Although it is more convenient to increase the time and the funds examined for more significance, most of mutual funds in Turkey were established after 1990. The beginning of time is selected such that at least 3 years will be covered for statistical significance and number of funds has to be maximised given this constraint. Cumby and Glen (1990), used the same procedure because of similar conditions existed for their study of performances of US based international mutual funds.
Another remark for monthly price data is that for some dates, the period between two prices may not be exactly one month because of weekends and holidays; there may be 1-2 day dispersions. This may bring some differences to monthly returns to be calculated from prices. This situation may reflect to the standard deviations of the mutual funds and securities, hence market portfolio and there may exist artificial deviations from actual ones.
3.2.1 Formation of Data:
Before measuring performances of mutual funds, monthly returns for each fund and security is computed to provide data for return and risk. For price data a monthly return is computed by:
R , = { P , - P , - i ) l P , - ,
(13)where
R
t
: Return on period tP
(-1
: Price at beginning of period t or end of period t-1P t
’’
Price at end of period tAs indicated in data part, data consisting of effectively annual interest rate for securities like treasury bills are converted to monthly returns. Effective annual rate is computed by:
reff =
(1
+ r
)'2
- 1
(14)where
r eff
: Annual effective interest rater : Average monthly interest rate So, r is found by:
г = {reff
+ 1) 1/12 (15) Then data of monthly returns are determined.3.2.2 Formation of The Market Portfolio
Treynor (1965), and Sharpe (1966), used Dow-Jones industrial average as market portfolio in their studies. The mutual funds they examined were mostly common stock or stock market based funds. Jensen (1966), used S&P 500 as the market portfolio. Examined 115 funds were growth, income and balanced funds. Lee and Rahman (1990), used a value weighted index for security prices (CRSP) and the examined 93 mutual funds were growth, income and balanced like in Jensen's analysis. Grinblatt and Titman (1989), used CRSP for market portfolio like Lee and Rahman, and again did not include money market, bond, or preferred stock funds to their sample of 157 mutual funds. Kon (1983), used CRSP for market portfolio and his sample of 37 mutual funds were consisting of growth, income and balanced funds. Cumby and Glen (1990), used Morgan Stanley World index and examined 15 US based international diversified funds. One can easily infer that almost all recent studies about mutual fund performance evaluation do not pay enough attention to mutual funds rather than income, growth and diversified ones. One major reason for this situation can be the simplicity of study because if money market and bond funds are inserted to their sample funds, then, the indices they used
will not be valid since the used indices were all correlated with common stock returns and are not appropriate for measuring different types of portfolios. However, the conditions do not hold in Turkey since there exists few number of mutual funds and almost all of them are money market and bond funds (Refer to Table 2.3). Under these conditions IMKB value weighted stock price index' can not be a good representation of the market portfolio for the aim of this study that investigates performances of these money market and bond funds. Since there is not any possibility of choosing the funds as common stock based ones, a more useful and effective market portfolio has to be constructed. A similar situation exists in the study of Cumby and Glen (1990) who state the difficulty of having not enough US international funds for a significant period and scarcity of fund type.
In this study the market portfolio is formed by constructing a large investment basket that contains gold (Cumhuriyet), US Dollar, German Mark, certificates of deposit, financial bonds, corporate bonds, treasury bills and IMKB index in equal weights:
R p ,
= (16)where
R i(
for i is from 1 to 8 is returns on gold, US $, DM, CD, commercial paper, corporate bonds, treasury bills and IMKB index in period t respectively,This index is more suitable to measure performances of Turkish funds than IMKB index or any other stock based indexes. One may ask if this market index could be value weighted instead of equally weighted or not. These 8 assets are taken equally and these weights are not changed during test period to represent also an unmanaged, diversified portfolio with a naive investment strategy that an average investor can have by buying these asets in equal amounts and hold during the period. This will enable us to compare the performances of managed portfolios with this unmanaged one and comment on how successful the portfolio managers are in their investment strategies or if they have strategy or not. Performances can be computed according to both equal and value weighted market indices to investigate benchmark efficiency issue but this is beyond the scope of this study and may be another thesis subject like investigating the best suitable index for performance measurement in Turkey.
3.2.3 Models Used in the Study
In this study there are two parts for performance measuring based on two different models. The first model is simple CAPM model and assumes there is a linear relationship between a portfolio's excess return and market's excess return when unsystematic risk is absent:
where returns are net of risk free rate.
In first part of performanee evaluation, Sharpe, Treynor and Jensen measures are used. Although there are some differences in logic of Sharpe, Treynor and Jensen measures, they are based on the validity of CAPM and market timing is not presented.
The second model assumes that although CAPM is valid, there is not a linear relationship between portfolio and market excess returns because managers who forecast market returns hold greater proportions of the market portfolio when market return is high and smaller proportion when return is low:
R p
— a +
m (11a)where
R
p
^ R
m
are portfolio excess return and market portfolio excess return respectively.3.2.4 Evaluation of the Performances
Performance of the mutual funds are investigated in two parts, we can separate these by performance without and with market timing analysis:
In first part the performances are measured according to I'reynor, Sharpe and Jensen measures. Before evaluating them, average returns, standard deviations and betas has to be computed. Average return and standard deviations are computed by the following equations:
f
avg —|[ ( 2
f /) / /jJ
a /
[ { Sill
{ r i - r a v g f ] l { n - \ )
(17) (18) where T/ is return at time i and n is 40 for this study.
Systematic risk components or betas are computed by regressing excess returns of mutual funds on excess market returns (See Appendix-A9 for values o f average returns, st. deviations and betas, also Appendix-Bl for regression results for betas):
R i i - Rf =
a , +- Rf )
(5a)Jensen measures are determined from regression results. Negative values are referred as inferior performance vice versa (See Appendix-Bl for regression results and Appendix-A1 for alpha value rankings)
Treynor measure is computed by:
where
TE
/ denotes Treynor index or value for fund i. Sharpe measure is computed by:S E I — (^ravg
^f) I
(2 0 )where SE denotes Sharpe index for fund i.
For both TE and SE a fund is said to have an inferior performance when it is compared to market performance and it is above market's value vice versa (See Appendix-A2 and Appendix-A3 for Sharpe and Treynor measure rankings). Also correlation between risk and risk-adjusted return; and between return and risk-adjusted return (RAR) are examined through a regression analysis of RAR on risk; and RAR on return for Jensen measure. Betas and average returns of 18 funds are taken as X values and alpha values of the corresponding funds are taken as Y values. R-square and r values are found by these regressions which show the correlation between risk and RAR, and also return and RAR.
a t = a + b P/
where i is from 1 to 18 and a / , P / represents alpha and beta values of each fund and
a
,b
are constants found by regression.ay c
+ d r avg
where
ravg
, represents average return of fund i, i is from 1 to 18 andc , d
are constants of regression equation.3.2.4.2 Market Timing and Seiectivity Modei
In second part, market-timing and security selectivity analysis is considered. Two performance measures are used. Trey nor and Mazur (1966), suggested that alpha and beta are measures of security selectivity and market timing skills (Eq. 11a is rewritten).
R p —
a + P iiR ;;, + P2/?m
2
(11a)This quadratic regression for each security will determine these values (See Appendix-B2 for quadratic regression results and Appendices A4-A5 for alpha (selectivity) and B (market-timing) rankings respectively). Another measure is Bhattacharya and Pfleiderer's model (Error term is added to Eq.
12
):R
—
E ( R
m )(l- D ) R mt + D T ( R ,nt)^
+T D E tR mt
+Upt
where
R p,
^mt
T
D
E t
(XpE{Rm)
Wpt
: Excess return on portfolio in period t
: Excess return on market portfolio in period t : Fund manager's response to information
: Coefficient of determination between manager's forecast and excess return on market
: Management forecast error
: indicator of security selection skill ; Expected value of market return u : error term
Although this regression equation will give the same results for Y intercepts and X coefficients, it is more complicated and not satisfied with the value of
R ^
coefficient ( P 2 in Treynor and Mazur's equation, (11)) and a deeper analysis is made with assumption that P2 is not an independent variable but instead it is composed by two variables. This analysis is interested in
D
value (P2= D T )
Error term of eq. 12 provides information about timing skill:
W f = T D E t R m t
+ wpt
(12b)Regressing square of
R nit
onW (
enables us to find an estimate ofD ^ S \
where »S'^ is varianceof
E
Then dividingD ^ S \
by2 2
{ T D )
which computed in Eq. (12a), giveSiS* £■.o 2 . * 0
where o /r is variance of excess market return,
r ^
is correlation between manager's forecast and excess return on market andV
gives the measure of market timing.S p
is computed by Merton's (1980) assumption that excess market return follows a stationary Wiener process:s i
= { s ; i , [ i n ( i + i ? „ , ) ] } / « (12d)Then r is found numerically and shows the ability of market timing.'* (See
2 9
Appendix-B3 for regression results of
W i
on
R
and Appendix-A6 for 2E ’ ^ F
T 2 2
values of
*S\· ,
S
p
andF,
and ranking with respect to r values).4. FINDINGS
Findings are examined in two parts as indicated in the methodology: The first part contains results of Sharpe, Treynor and Jensen measures in absence of market timing. The next part has market timing and selectivity analysis and a comparison of results in these parts. Since Jensen measure is preferred to Sharpe and Treynor measures for its interpretation and significance, a considerable attention is paid on it and comparison of performances with and without market timing and selectivity is made by using Jensen measure (It is not rational to compare modified Jensen regression used in market timing and selectivity with Sharpe and Treynor values; but both Jensen and market-timing and selectivity measures use Y-intercept of regression for measuring performance).
4.1 Part I: Findings on Linear Model
Performances of 18 mutual funds are measured according to Sharpe, Treynor and Jensen measures and
Table 4.2
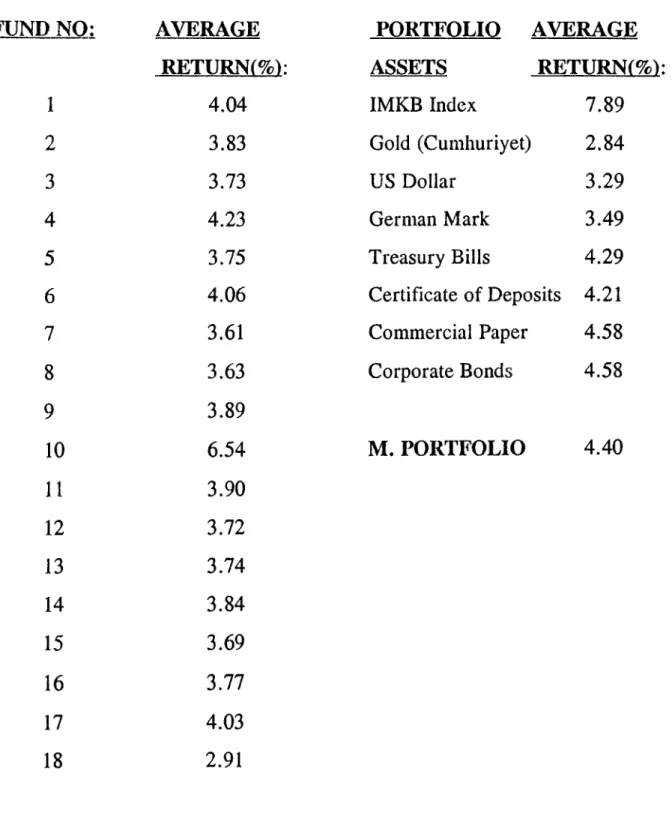
shows a summary of them (Refer to Appendix-A2 and Appendix-A3 for individual SE and TE measures and rankings). Also average returns for funds and assets of market portfolio is shown inTable 4,1.
TABLE 4.1 AVERAGE RETURNS FOR FUNDS AND MARKET
PORTFOLIO ASSETS
FUND NO: AVERAGE PORTFOLIO AVERAGE
RETURNi%): ASSETS RETURNi%):
1 4.04 IMKB Index 7.89 2 3.83 Gold (Cumhuriyet) 2.84 3 3.73 US Dollar 3.29 4 4.23 German Mark 3.49 5 3.75 Treasury Bills 4.29 6 4.06 Certifieate of Deposits 4.21 7 3.61 Commercial Paper 4.58 8 3.63 Corporate Bonds 4.58 9 3.89 10 6.54 M. PORTFOLIO 4.40 11 3.90 12 3.72 13 3.74 14 3.84 15 3.69 16 3.77 17 4.03 18 2.91
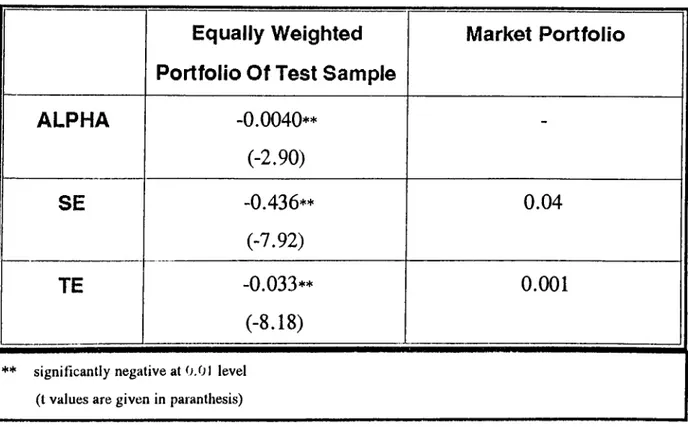
TABLE 4.2 COMPARISON OF EQUALLY WEIGHTED PORTFOLIO WITH
MARKET PORTFOLIO
Equally Weighted
Portfolio Of Test Sample
Market Portfolio
ALPHA
-0.0040** (-2.90)-SE
-0.436** (-7.92) 0.04TE
-0.033** (-8.18) 0.001** significantly negative at 0.01 level (t values are given in paranthesis)
For alphas, t statistics show that 13 out of 18 funds have significantly negative alpha values, 3 of them are significantly negative at the 0.05 level and 9 funds have significantly negative alphas at 0.01 level (See Appendix~Al). Average of alphas is also significantly lower than zero at the 0.01 level. This is a strong evidence that mutual funds examined do not have superior performances but inferior as individual and whole level during the test period. Sharpe and Treynor measures give additional support to Jensen results since sample averages are significantly negative and smaller than market portfolio for SE and TE measures.
Correlation among risk-RAR, return-RAR and total risk-systematic risk are found as 0.87, 0,99, and 0.9979 respectively. Returns explain the RAR better than risk, and it is interesting to see that there is almost a 100% determination of RAR by return. It seems that almost all funds have the same exposure to unsystematic risk so that beta almost explains total risk behaviour.
4.2 PART 2: FINDINGS ON MARKET-TIMING MODEL &
COMPARISON OF THE MODELS
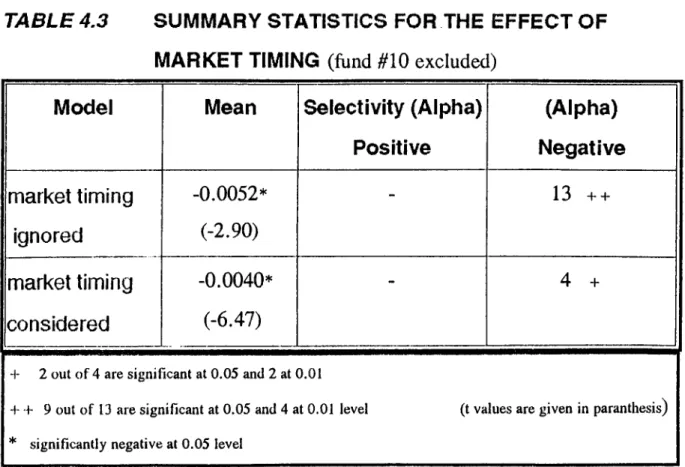
Quadratic regression results are given in Appendix-B2 (see Appendix-A4 and Appendix-A5 for alpha (selectivity) and
^ 2
(market timing) rankings). Four funds have significantly negative selectivity measures and two of them are significant at the 0.05 and the other half at the 0.01 level. Average selectivity of all funds is significantly negative at 0.01 level. No significant positive measure is detected as in case of linear regression. Only 1 out of 18 funds has significantly positive beta at the 0.01 level, and average market timing of sample is not significantly different from 0 like 17 out of 18 funds do not have significantly different timing. Results, on average, are consistent with Treynor and Mazur (1966), and Cumby and Glen (1990).Findings of market timing and selectivity with respect to Bhattacharya and Pfleiderer model are consistent with the ones above (Refer to Appendix-B3 for regression results of W ^ on i? ^ and Appendix-A6 for