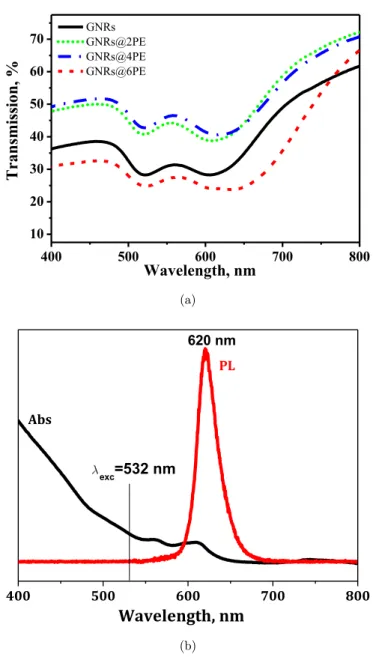
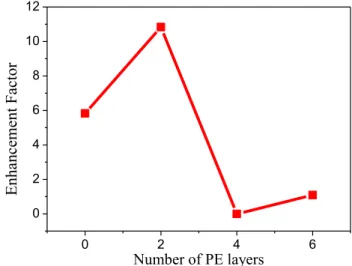
Luminescence of Gold Nanorod-Quantum Dots Complexes
Tam metin
Şekil
Benzer Belgeler
Sonuç olarak, açımlayıcı ve doğrulayıcı faktör analizi sonucunda elde edilen değerler, BÖAÖ’nün lise öğrencilerinin biyoloji öğrenme anlayışlarını
Finally, genetic abla- tion of Hmgcs2 in all intestinal epithelial cells using adult iKO mice diminished bOHB levels over time in crypts ( Figure 4 D and S4 G), with no effect
More specifically, if all motion vectors are forward motion vectors, then the current B frame is a scene cut because the previous frame is significantly irrelevant to the
Proof-of-concept, first metal-semiconductor-metal ultraviolet photodetectors based on nanocrystalline gallium nitride (GaN) layers grown by low-temperature
and phase. 31 Figure 3-11Temperature and Deflection vs. Voltage of bilayer cantilever. 32 Figure 3-12 Amplitude and Phase of the thermomechanical oscillation at ω vs. temperature
The experimental data on isomer yield ratios in the thermal neutron induced fission of 235U are compared with those calculated from the simple statistical model by
Çalışmamızda latent tüberküloz saptanması için Quantiferon Tb gold ELİSA testi kullanılmış ve kantitatif sonuç veren bu testin tüberkülozlu hastalarla
In the present study, we investigated the effects of high temperature on GABA metabolism in two different lichen species Evernia prunastri and Usnea sp... Evernia and Usnea
