RELEVANCE FEEDBACK AND SPARSITY
HANDLING METHODS FOR TEMPORAL
DATA
a dissertation submitted to
the graduate school of engineering and science
of bilkent university
in partial fulfillment of the requirements for
the degree of
doctor of philosophy
in
computer engineering
By
Bahaeddin ERAVCI
July 2018
RELEVANCE FEEDBACK AND SPARSITY HANDLING METHODS FOR TEMPORAL DATA
By Bahaeddin ERAVCI July 2018
We certify that we have read this dissertation and that in our opinion it is fully adequate, in scope and in quality, as a dissertation for the degree of Doctor of Philosophy.
¨
Ozg¨ur Ulusoy(Advisor)
Hakan Ferhatosmano˘glu(Co-Adviser)
A. Enis C¸ etin
U˘gur G¨ud¨ukbay
Fatih Vehbi C¸ elebi
Yakup Sabri ¨Ozkazan¸c Approved for the Graduate School of Engineering and Science:
Ezhan Kara¸san
ABSTRACT
RELEVANCE FEEDBACK AND SPARSITY
HANDLING METHODS FOR TEMPORAL DATA
Bahaeddin ERAVCI Ph.D. in Computer Engineering
Advisor: ¨Ozg¨ur Ulusoy
Co-Advisor: Hakan Ferhatosmano˘glu July 2018
Data with temporal ordering arises in many natural and digital processes with an increasing importance and immense number of applications. This study provides solutions to data mining problems in analyzing time series both in standalone and sparse networked cases. We initially develop a methodology for browsing time series repositories by forming new time series queries based on user annotations. The result set for each query is formed using diverse selection methods to increase the effectiveness of the relevance feedback (RF) mechanism. In addition to RF, a unique aspect of time series data is considered and representation feedback methods are proposed to converge to the outperforming representation type among various transformations based on user annotations as opposed to manual selection. These methods are based on partitioning of the result set according to representation performance and a weighting approach which amplifies different features from multiple representations. We subsequently propose the utilization of autoencoders to summarize the time series into a data-aware sparse representation to both decrease computation load and increase the accuracy. Experiments on a large variety of real data sets prove that the proposed methods improve the accuracy significantly and data-aware representations have recorded similar performances while reducing the data and computational load. As a more demanding case, the time series dataset may be incomplete needing interpolation approaches to apply data mining techniques. In this regard, we analyze a sparse time series data with an underlying time varying network. We develop a methodology to generate a road network time series dataset using noisy and sparse vehicle trajectories and evaluate the result using time varying shortest path solutions.
Keywords: Time Series, Relevance Feedback, Diversity, Autoencoder, Sparsity, Time-Varying Graphs.
¨
OZET
ZAMANSAL VER˙ILER ˙IC
¸ ˙IN ˙ILG˙IL˙IL˙IK GER˙I
B˙ILD˙IR˙IM˙I VE SEYREKL˙IK ELE ALMA METOTLARI
Bahaeddin ERAVCI Bilgisayar M¨uhendisli˘gi, Doktora
Tez Danı¸smanı: ¨Ozg¨ur Ulusoy
˙Ikinci Tez Danı¸smanı: Hakan Ferhatosmano˘glu Temmuz 2018
Zamansal ili¸skiye sahip veriler, artan ¨onemi ve ¸cok sayıda uygulaması ile bir¸cok do˘gal ve dijital s¨ure¸cte ortaya ¸cıkar. Bu ¸calı¸sma hem tek ba¸sına hem de seyrek ve a˘g ili¸skili durumlarda zaman serilerinin analizinde veri madencili˘gi problemlerine ¸c¨oz¨umler sunmaktadır. ˙Ilk olarak kullanıcı derecelendirmesine dayanan, yeni zaman serisi sorguları olu¸sturarak zaman serisi veri depolarını taramak i¸cin bir y¨ontem geli¸stirdik. Sonu¸c k¨umesi, ilgililik geri bildirim mekanizmasının etkinli˘gini arttırmak i¸cin ¸ce¸sitlilik i¸ceren se¸cim y¨ontemleri kullanılarak olu¸sturulmu¸stur. Geri bildirime ek olarak, zaman dizisi verilerinin benzersiz bir y¨on¨u g¨oz ¨on¨unde bulundurularak, el ile yapılabilecek bir se¸cimin aksine, kullanıcı a¸cıklamalarına dayanan ¸ce¸sitli d¨on¨u¸s¨umler arasında ¨ust¨un performans g¨osteren temsil t¨ur¨une yakınsamak i¸cin temsil geri bildirim y¨ontemleri ¨onerilmektedir. Bu y¨ontemler, her bir temsil ba¸sarımına g¨ore sonu¸c k¨umesinin b¨ol¨umlendirilmesine ve birden ¸cok temsilin farklı ¨ozelliklerini kuvvetlendiren bir a˘gırlık yakla¸sımına dayanmaktadır. Daha sonra, hem i¸slem y¨uk¨un¨u azaltmak hem de do˘grulu˘gunu arttırmak i¸cin, za-man serilerini veri ba˘gımlı seyrek temsillere indirgemek i¸cin oto-kodlayıcıların kul-lanımını ¨onermekteyiz. C¸ ok ¸ce¸sitli ger¸cek veri k¨umeleri ¨uzerinde yapılan deneyler, ¨
onerilen y¨ontemlerin do˘grulu˘gu ¨onemli ¨ol¸c¨ude geli¸stirdi˘gini kanıtlamakta olup veriye duyarlı temsiller, verileri ve hesaplama y¨uk¨un¨u azaltırken, benzer ba¸sarım kaydetmi¸stir. Daha zorlu bir durum olarak, zaman serisi veri k¨umesi noksan olup, veri madencilik tekniklerini uygulayabilmek i¸cin interpolasyon yakla¸sımlarına ihtiya¸c duyulabilir. Bu ba˘glamda, zamana ba˘glı de˘gi¸sen bir a˘g ile ili¸skili seyrek bir zaman dizisi verisini analiz ediyoruz. G¨ur¨ult¨ul¨u ve seyrek ara¸c izlerini kullanarak bir yol a˘gı zaman serisi veri k¨umesi olu¸sturmak i¸cin bir metodoloji geli¸stirdik ve en kısa yol ¸c¨oz¨umlerini kullanarak de˘gerlendirdik.
Anahtar s¨ozc¨ukler : Zaman Serileri, ˙Ilgililik Geri Bildirimi, C¸ e¸sitlilik, Otokod-layıcı, Seyreklik, Zamanla De˘gi¸sen C¸ izgeler.
Acknowledgement
First and foremost, I gratefully thank my supervisors ¨Ozg¨ur Ulusoy and Hakan Ferhatosmano˘glu for their suggestions, supervision, and guidance throughout the development of this thesis and my research career. I feel very fortunate for the opportunity to have them as my research advisors. I am indebted to my thesis monitoring committee members Enis C¸ etin and U˘gur G¨ud¨ukbay for their valuable comments and discussions enriching my studies. I also thank the jury members for their time and helpful remarks.
I also thank ASELSAN for the assistance throughout my studies as my employer and for giving permission to pursue my goals.
Last, but by no means the least, I would like to thank my family, especially my beloved wife, Sema, for her exhaustless encouragement and support throughout the ups and downs of the life journey. I also dedicate this Ph.D. thesis to her and my lovely boy, Mustafa Bilge who is the joy of our life. I appreciate all their patience during my studies.
Contents
1 Introduction 1
1.1 Main Contributions . . . 5
1.2 Outline . . . 7
2 Related Work and Background 8 3 Diverse Relevance Feedback for Time Series 13 3.1 Problem Definition . . . 14
3.2 Relevance Feedback Framework . . . 14
3.3 Time Series Representation . . . 15
3.4 RF with Diverse Top-k Retrieval . . . 18
3.4.1 Algorithmic Complexity . . . 24
3.5 Illustrative Analysis of Diverse Retrieval . . . 25
3.6 Evaluation . . . 27
3.6.1 Experimental Setting . . . 27
3.6.2 Experimental Results . . . 31
3.7 Conclusion . . . 35
4 Variations of Time Series Relevance Feedback 38 4.1 Representation Feedback . . . 39
4.1.1 Representation Feedback via Top-k List Partitioning . . . 40
4.1.2 Representation Feedback via Weighting . . . 41
4.1.3 Evaluation . . . 44
4.2 Time Series RF using Autoencoders . . . 47
4.2.1 Algorithmic Complexity . . . 50
CONTENTS vii
4.3 Conclusion . . . 59
5 Temporal Graphs with Sparse Time Series 61 5.1 Data Model . . . 63
5.1.1 Trajectory Dataset . . . 63
5.1.2 Time Varying Graph Structure . . . 64
5.2 Sparse Time Series Interpolation Process . . . 65
5.2.1 Data Preparation . . . 66
5.2.2 Sparsity Analysis of Time Series . . . 67
5.2.3 Interpolation and Filtering . . . 70
5.3 Evaluation . . . 72
5.3.1 Experimental Setup . . . 73
5.3.2 Experimental Results . . . 75
5.4 Conclusion . . . 78
6 Conclusion and Future Work 80
List of Figures
3.1 Relevance feedback system . . . 15 3.2 An example SAX bitmap representation . . . 16 3.3 Three level Dual-Tree Complex Wavelet Transform [1] . . . 17 3.4 An example case of data and query movement with Rocchio based
algorithm . . . 22 3.5 Data distributions used in analysis . . . 25 3.6 Performance for three rounds of RF for all the datasets (precision
scaled to 100 in y-axis versus dataset number in x-axis) . . . 30 3.7 Histogram of increase in precision with different RF settings feedback 32 3.8 Normalized performances of different methods and representations 33 3.9 Normalized performances of different datasets versus purity of
dataset . . . 34
4.1 Representation feedback with top-k list partitioning . . . 41 4.2 Representation feedback via weighting approach . . . 42 4.3 Normalized performances of top-k partitioning representation
feed-back methods . . . 44 4.4 Accuracy comparison of top-k partitioning representation feedback
with item-only diversity . . . 45 4.5 Performance of representation feedback with weighting (precision
in y-axis vs RF round in x-axis) . . . 46 4.6 Autoencoder network structure . . . 49 4.7 2-D histograms (number of queries) of query precision under
different methods and transformations in the third iteration of RF for Worms dataset . . . 54
LIST OF FIGURES ix
4.8 Performance of RF with various configurations for datasets with
low precision . . . 56
5.1 Sample network . . . 62
5.2 Road Map of Milan . . . 64
5.3 Trajectory Density over Time . . . 65
5.4 System Structure . . . 66
5.5 Autocorrelation of An Edge Data . . . 68
5.6 Sparsity of time series related with edges . . . 69
5.7 Average Frequency Spectrum of The Most Populous 4000 Edges . 70 5.8 Sample Trajectory Distribution over All Time Slots . . . 73
5.9 Path Size based Analysis . . . 76
5.10 Comparisons on Time-Varying Paths for the Same Query with Different Start Times . . . 77
List of Tables
3.1 Average Increase (absolute) in Precision . . . 31
4.1 Normalized precision improvements with varying autoencoders for third round of RF . . . 52 4.2 Average precision levels for diverse RF with varying configurations 53 4.3 Total transformation runtime for all the datasets (minutes) . . . . 57 4.4 Total training time for autoencoders (minutes) . . . 57 4.5 Total runtime of experiments (minutes) . . . 58
List of Publications
This dissertation is based on the following publications:
P.1 Bahaeddin Eravci and Hakan Ferhatosmanoglu, ”Diversity based relevance feedback for time series search”, Proceedings of the VLDB Endowment (PVLDB), v. 7(2), p.109-120, 2013 (also presented in VLDB 2014, 40th International Conference on Very Large Data Bases, Hangzhou) https: //doi.org/10.14778/2732228.2732230
P.2 Bahaeddin Eravci and Hakan Ferhatosmanoglu, ”Diverse Relevance Feed-back for Time Series with Autoencoder Based Summarizations”, IEEE Transactions on Knowledge and Data Engineering (TKDE), 2018, https: //doi.org/10.1109/TKDE.2018.2820119
P.3 Elif Eser, Furkan Kocayusufolu, Bahaeddin Eravci, Hakan Ferhatosmanolu, Josep L Larriba-Pey, ”Generating Time-Varying Road Network Data Using Sparse Trajectories”, 2016 IEEE 16th International Conference on Data Mining Workshops (ICDMW), p.1118-1124, 2016, https://doi.org/10. 1109/ICDMW.2016.0161
Chapter 1
Introduction
Temporal data is common in many applications ranging from finance to healthcare and practically in any process that records data with respect to time. A time series can be defined as an array of numbers with temporal association within its elements. Generation and storage of time series data, in parallel with other data types, has reached a speed that was not possible to this day. Accumulation of such data is also gaining momentum with new technologies, such as the decline in the price and the miniaturization of different sensors (pressure, temperature, inertial, etc.) and is expected to further increase with Internet of Things (IoT) applications. In addition to one dimensional time series data, there is also a recent rise in temporal data with an underlying network structure. We can present examples of time varying graphs with time series data coupled with the related spatial information of the sensor or time varying properties of different social network users. This vast amount of data is expected to be translated into insight and knowledge by browsing, exploring and extracting application oriented information while taking temporal and network based relations into account.
Mining time series fall into several categories such as pattern recognition, classification, clustering, and forecasting, and generally starts with identifying a representation that harmonizes the end purpose of the application and the property of time series data. One of the important tasks in time series mining
is browsing, where users seek “similar” time series from a database via query by example, such as seeking online advertisements with similar view patterns for a period of time, stocks that are related in terms of price or return, cities with similar earthquake timing patterns. The volume of the time series data impedes users ability to observe and analyze the whole database and find the similar series manually.
Even though time series search and retrieval methods have been studied widely, there is limited work in utilizing relevance feedback (RF), which has enjoyed a great deal of attention in areas of text and information retrieval. In RF, a set of data items is retrieved as a result of an initial query by example, and presented to the user for evaluation. The informal goal is to present the right set of initial results that maximize the information gain from the user feedback.
To the best of our knowledge, no prior work considered improving time-series retrieval and relevance feedback (RF) by introducing diversity in the search results before our work [2]. This study enriches machine learning and information retrieval ideas of related nature by adapting it to time series using representations that capture the temporal relations within the data in conjunction with diverse retrieval. We study RF for retrieval in time series databases and adopt a query by example approach where the user submits a time series query reflecting the user intentions. Based on the initial query, a set of time series items according to a criterion is retrieved from the database and presented to the user for evaluation. The problem is to present a set of items to collect feedback in such a way that maximizes the information from the evaluation process, as opposed to the top matching set, correctly modeling and identifying the user intent for the subsequent retrieval iterations. The user evaluates and annotates the presented items to improve the results in the next round for finding the time series item of interest. We utilize different representations of time series, and use diversity between time series data in different rounds of retrieval process to further enhance the user satisfaction by increasing the number of relevant items in the resultant sets.
Given the large amount of research for identifying representation methods in time series literature, finding the right representation for one’s intent is an important task. The already available user feedback in RF iterations can be used identify the appropriate representation for a query or an application in this context. We develop a representation feedback method in which the initial result set is populated with items from differing representations, and the system identifies the appropriate one by analyzing the annotated items. The user feedback is utilized to converge to the representation which satisfies the user most by increasing the total number of items from the best performing representation for the next rounds of retrieval. This can be useful in dynamic databases where the properties of the data are changing or with systems serving multiple user groups with different objectives each satisfied using a different representation. Experimental results show that besides the intended use as representation feedback, the method implicitly embodies item diversity as well [2].
We expand the framework by using autoencoder neural networks to extract sparse representations of the time series that both reduce the data size and extract more appropriate representations. Autoencoders can also be effective in combining multiple representations and selecting relevant features from best performing representations by analyzing the dataset. Our study with experiments spanning a diverse set of data aims to assess the potential of autoencoders use for the general time series data even with relatively simple network structures. The use of similar deep network techniques to learn data-aware representations which can suit time series data generally by analyzing huge diverse time series datasets can be an important tool in time series data mining. These general networks can also be trained to specific tasks, e.g. stock analysis where stock movement patterns are identified with years of human expertise [3].
Considerable amount of time series data mining methods accept complete and standalone time series data. As a different aspect of temporal data, there are different applications where graphs with time varying properties arise naturally. These types of time series datasets can also be incomplete due to deficiency of sensors/recorders in various nodes of the network. Management and analysis of
road networks is an example which is an important task for traffic management and location based services (LBSs).
Road networks are spatial graphs with vertices representing the geo-locational points and edges representing the roads between theses vertices. Most traditional graph algorithms assume that the edges have static attributes, such as the length of the road and the speed limit. A more enhanced and correct representation is a time-varying road network that models the changing traffic information via graph with each edge having a time-series attributed, rather than a single aggregate static value.
In this perspective, we analyze the trajectories found in the Floating Car Dataset of Telecom Italia [4] and generate a realistic time-varying graph dataset with different travel times for each time slot for its edges [5]. This real data set consists of sparse and noisy GPS trajectories collected from different vehicles. After mapping the trajectories to the road network, we use time series analysis and inference methods to estimate the missing values to generate a complete time-varying graph. The initial data from the mapping process consists of a very sparse time series data for each edge in the road network and to interpolate missing data points, the frequency content of nearly-complete edges is identified using spectrum analysis methods. We notice that the time series of interest are band-limited and most of the signal power is in the low-pass region, i.e., the time series are slow varying signals. This information is used as a model to complete the missing data using minimum travel time for the respective edge and random sample drawn from a normal distribution with parameters devise from the signal itself. These two parameters are selected according to Nyquist-Shannon sampling theorem to counter aliasing. After padding the signal, we use the fact that the signals are expected to be band-limited to smooth the padded time series such that the resultant signal is of the same model as the expected signals. The resultant complete time series dataset with the underlying road network is stored on Sparksee [6] graph database and a Java API is developed for easy manipulation of the graph.
1.1
Main Contributions
The contributions of this dissertation include the following:
• We analyze and utilize different time series representations useful for RF to capture a variety of global and local information. Spectrum based transforms (Fast Fourier Transform and Dual-tree complex wavelet transform) are considered due to its power to identify patterns localized both in time and frequency domain and SAX-based transform is used to identify time based patterns which can be essential for diversity based RF. We construct a RF technique for time series by tuning such systems without the need of explicitly defining features like amplitude shift, periodicity, etc. • The performance of RF is enhanced by using diversity in the result set improving the effectiveness and utilization of the user annotation for additional improvements in precision.
• Two different on-the-fly representation selection mechanisms that choose best performing representation types by further exploiting the valuable feedback from the user are proposed.
• We study the use of autoencoders to decrease the complexity of the overall features and extract useful data aware features. A representation map is learned from the data and can be used in other time series tasks. The presented approach exploits the advantages of RF and diversification, and illustrates a potential use of autoencoder type networks in time series retrieval.
• A rich set of experiments on 85 real data sets provide insights on the feasibility of the general RF framework, performance of autoencoders and how diversity can improve time series retrieval. We discuss the performance of the developed methods under different data properties instead of specific applications and analyze advantages of the methods with respect to different cases.
• We apply time series analysis and interpolation methods to generate a time-varying graph for road networks using sparse and noisy time series. This process begins with analyzing the nearly-complete time series to create a model of the series. Using this model, we generate the incomplete data points to form a realistic full time series dataset for the network.
• To develop and validate algorithms/systems and for analysis of traffic for dynamic road networks, the research community needs publicly available time-varying graph datasets with edge weights varying over time based on realistic patterns. Our generated time varying graph dataset and an associated graph management tool is shared to support research on related topics.
Experimental results show 0.23 point increase in precision averaged over all four representations, with 0.48 point increase in specific cases in the third round of RF. Introducing diversity into RF increases average precision by 6.3% relative to RF with no transformations and 2.5% relative to the RF using the proposed representation. Results also show that the representation feedback method implicitly incorporates item diversity and converges to the better performing representation, confirming it to be an effective way to handle changing data properties and different user preferences.
Experiments with the autoencoders present runtime performance increases of around 6-9x due to reduced total data volume with a mild degradation in the average precision. We have also observed that in some challenging data cases, where the precision is low, the accuracy improves when using autoencoders, which is encouraging to further pursue this approach.
We performed experiments using the generated time varying graph dataset by employing the system in a use case, evaluating the time-varying shortest path solution. It is observed that the difference between the shortest paths using time-varying versus static weights increases as the number of vertices increases. The travel durations of these two types of shortest paths give differing results favoring the use of the time-varying road network.
1.2
Outline
The rest of the dissertation is organized as following: A literature review presenting the background information for the different components of the dissertation is given in Chapter 2. The general time series RF framework with its specific application and results is defined and presented in Chapter 3. We also provide intuitional and statistical justification for use of diversity in RF frameworks in this chapter. Chapter 4 details the extension of the proposed RF framework with representation feedback and autoencoders. We detail the method to generate a complete time varying graph from a sparse time series data with an application on road networks in Chapter 5. Finally, we conclude the dissertation in Chapter 6 with outlining possible future work.
Chapter 2
Related Work and Background
We present the current literature and its relations with the different aspects of the proposed methods in this chapter. We first give the general literature review of time series representations and different similarity measures used for various purposes which is related with the proposed time series RF setting. We follow on by noting the important research on relevance feedback presenting the different perspectives from information retrieval to machine learning. Subsequently, diversity related studies and its use in different contexts are presented which contributes as an important aspect of our proposed methods. Since we develop a retrieval framework ranking different time series items, we also discuss ranking algorithms each tackling the problem in a different aspect. We include a concise discussion of autoencoders focusing on its use in time series literature. Finally, we present the background for time-varying graphs with a brief introduction to route planning literature and discussion of different datasets already available in the literature.
Time series data mining research has immense literature on the representation of the time series, similarity measures, indexing methods, and pattern discovery ([7]). Generally, time series data mining tasks begin with identifying a representation that links the end purpose of the application and the properties of the time series. Various representations have been proposed to transform the
time series, each with a different perspective to meet the requirements of different applications, user intents, and data properties. A class of representations, such as piecewise aggregate approximation (PAA) and symbolic aggregate approximation (SAX) [8], are used to identify features in the time domain, while others, including discrete Fourier transform (DFT) and discrete wavelet transform (DWT), involve frequency domain properties dealing with the periodic components in the series.
After the time series is transformed, measures of similarity are used for comparing data items. A multitude of similarity measures (from Lp norms to
dynamic time warping (DTW), etc.) has been proposed [9, 10, 11]. Indexing methods for similarity queries have also generated extensive interest in the community given the computational load of the algorithms [12]. Besides using geometric distance on coefficients [13], dynamic time warping (DTW) and other elastic measures are used to identify similarities between time series due to non-aligned data [9, 14, 11]. We also see approximate subsequence matching methods proposed for large time series datasets with DTW distance in [15]. We report recent work that proposes a relational database for time series by bi-clustering the tables to allow quick retrieval under heavy loads [16]. Additionally, methods to identify recorded sound excerpts by comparing various features of the signal stored in a music database has been described in [17].
There has been significant work in information retrieval community for relevance feedback (RF) since it was proposed in the 1970s ([18, 19, 20]) and to this day there still is research on variants of this method or mix of this method with different techniques ([21]). The first methods have concentrated on RF query movement in which the query point was moved toward the relevant items. Dimension weighting methods have been proposed for the same objective in [22]. There has also been use of RF in the image and multimedia retrieval applications [23, 24, 25]. Lately, researchers pose the RF problem as a classification problem and propose solutions in the context of machine learning [26, 27].
Combining relevance and diversity for ranking documents has been studied by [28] in the context of text retrieval and summarization. They define a Maximal Marginal Relevance (MMR) objective function to reduce redundancy while still
maintaining relevance to the query in re-ranking retrieved documents. There are recent studies which analyze MMR type diversification and provide efficient algorithms for finding the novel subset [29]. The problem of ambiguity in queries and redundancy in retrieved documents has been studied in [30]. They propose an evaluation framework and emphasize the importance of objective evaluation functions. Researchers study diverse results in web search application by posing the problem as an expectation maximization in [31]. A retrieval method for maximizing diversity, which also assigns negative feedback to the documents that are included in the result list is proposed by [32]. Given the considerable success of applying diversity in retrieval in different domains, [33] proposes scalable diversification methods for large datasets using MapReduce. Studies on using relevance, diversity and density measures to rank documents in information retrieval within an active learning setting have also found interest in the literature [34]. Diverse results have been reported to increase user satisfaction for answering ambiguous web queries [35] and for improving personalized web search accuracy [36]. Graph based diversity measures for multi-dimensional data have also been proposed in [37]. Methods to find the best representative of a data set based on clustering has been investigated in [38].
Top-k retrieval has been studied also as a machine learning problem to rank documents according to user behavior from analyzing implicit feedbacks like click logs. A Bayesian based method is proposed as an active exploration strategy (instead of naive selection methods) so that user interactions are more useful for training the ranking system [39]. A diverse ranking for documents is suggested to maximize the probability that new users will find at least one relevant document in [40]. There is recent interest to address the biases (e.g., presentation bias where initial ranking strongly influences the number of clicks the result receives) in implicit feedbacks using a weighted SVM approach [41]. We also note some studies concentrating on ways to balance diversity and relevance while learning ranking of documents [42] [43]. One can approach the result set selection problem using active learning where the main aim is to label parts of the dataset as efficiently as possible for classification of any data item in the dataset. There is a variety of techniques each with a different perspective such as minimization of
uncertainty concerning output values, model parameters and decision boundaries of the machine learning method [44].
Contrary to its popularity in the information retrieval, RF and diversity have not attracted much attention in time series community. Representation of time series with line segments along with weight associated to the related segments and explicit definition of global distortions have been used in time series relevance feedback [45, 46]. We are not aware of any studies using representation feedback for time series retrieval and diversification in such systems before our initial paper on the issue.
Autoencoder neural networks formulate an unsupervised learning that uses the input data as the output variable to be learned [47]. The network structure and the training objectives force the outcome to be a sparse representation of the input data. It has attracted a renewed interest lately with deep network approaches generally utilizing restricted Boltzmann machines [48]. We also note some recent work on time series visualization utilizing autoencoder structures [49]. Time series forecasting with neural networks is reported to be advantageous even with relatively small data cases in [50].
Incomplete time series is generated and has been studied under different contexts. Tormene et.al. proposed a variant of DTW to match truncated time series in [51] within a medical application. There is also interest in accurate calculation of spectral content with time series of missing content with applications in seismology [52]. Researchers have also focused on analyzing sparse time series data due to an increase in number of sensors/apps recording temporal data bursts. One study [53] focuses on prediction of power consumption at electric vehicle charging stations using nearest neighbor methods while another paper aggregates the sparse data in different time windows and uses weighing methods to estimate free parking spaces in an urban setting [54].
Road networks and route planning has generated a great deal of interest due to increasing mobility with increasing use of navigation systems and online route planning services [55]. Computation of shortest paths over time-dependent road
networks is shown to be polynomially solvable with Dijkstra based solutions adapted for these types of graphs [56, 57]. Route planning over time-dependent graphs has also appeared in the literature aiming at reducing traffic jams [58]. As an increasing trend, personalized route planning emerges by considering driver’s preferences [59].
Major service providers such as Google, Yandex, and TomTom have the ability to observe real time traffic in certain regions and can update their underlying road network’s edge weights accordingly. However, most users and researchers do not have access to such dynamic updates. The datasets used in the literature are usually combinations of real maps with synthetically generated travel time-series [56] or real data collected over a limited amount of time [58] [59]. This makes the comparison of algorithms difficult because they usually have data dependencies or these datasets are not publicly available via an API or web service.
Employing GPS traces to build or exploit road networks has also been studied in the literature [60], [61]. In [60], GPS data are utilized to generate a road network without any prior information about the network topology. In [61], GPS data are employed with a road network for traffic and travel time estimation of the paths by using probabilistic model based approaches.
Chapter 3
Diverse Relevance Feedback for
Time Series
This chapter presents the proposed framework for relevance feedback (RF) using diversity amongst its result sets increasing the accuracy of retrieving similar items from a time series database given a user specified query. Application of this framework from different perspectives include the following:
• finding products with similar sale patterns in online commerce with respect to a selected product
• identifying electrocardiography signals from past patients correlated with a specific patient
• finding network nodes with similar communication loads extracted from network logs
In each of these applications, the user queries the database and seeks relevant time series items according to the specific application and intent.
3.1
Problem Definition
We consider a database, T SDB, of N time series: T SDB = {T S1, T S2, ..., T SN}.
Each item of T SDB: T Si, is a vector of real numbers which can be of different
size, i.e. T Si = [T Si(1), T Si(2), ..., T Si(Li)] where Li is the length of a particular
T Si. Given a query, T Sq (not necessarily in T SDB), the problem is to find a
result set (a subset of T SDB) of k time series that will satisfy the expectation of the user. Since we formulate the solution in an RF setting, the user is directed for a binary feedback by annotating the items in the result set as relevant or irrelevant.
3.2
Relevance Feedback Framework
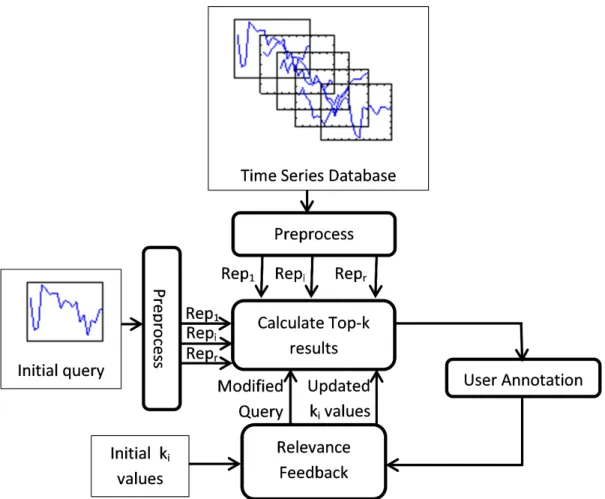
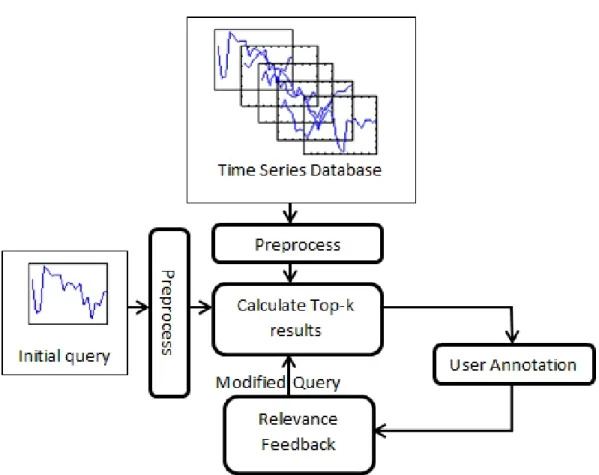
RF is an important tool in information retrieval to increase user satisfaction where the user is given a set of relevant items in each iteration and is expect to evaluate and annotate the relevance of each item presented by the system. A feedback mechanism is established where items that are more relevant are presented in the successive rounds. The basic model is given in Figure 3.1. Each component of the system shall be explained in the successive sections.
The framework proposed dictates the transformation of the time series, as a preprocessing step, into the preferred representation (CWT, FFT, SAX, PAA etc. according to properties of the time series in the database and the application requirements) such that the relevant features are captured. The preprocessing may also involve a normalization procedure (unit-norm, zero-mean, etc.) as necessary. Given a user provided initial time series query (T Sq), the relevant
transformation is applied and a transformed query vector, q, is calculated which will be used in the similarity calculations and top-k retrieval process. Ti denotes
the transformed T Si according to the transformations explained in the previous
Figure 3.1: Relevance feedback system
3.3
Time Series Representation
The effectiveness of representation to decode the user intention is essential for the performance of time series similarity match. The appropriate representation depends on the application, time series properties and user intent. For example, if the user intention is to figure out all the time series with specific periods like weekly patterns, frequency domain approaches like DFT (Discrete Fourier Transform) can serve the purpose. An important general property to consider is the shift-invariance of the transform. This will allow correct retrieval even if time series pairs have offset in time. Accurate and easy handling of time series with varying length is another important criteria for the representation choice. Transforms that help compare local and global properties of time series items would be expected to be functional for diversity based browsing. Based on these
observations, we focus on different representation methods and approaches: based on Wavelet Transform and based on SAX (Symbolic Aggregate approXimation in [62]), in addition to Fast Fourier Transform (FFT), and the raw time series as a baseline in our experiments. FFT is a computationally optimized version of DFT with the same numerical outputs. Experiments with four different representations provide insights on how different types of representation work with RF and how they affect the precision for different datasets.
On one side, we will illustrate our approaches using these methods; and on another we will evaluate the appropriateness of these successful representations and provide insights on their use in our RF and diversity context.
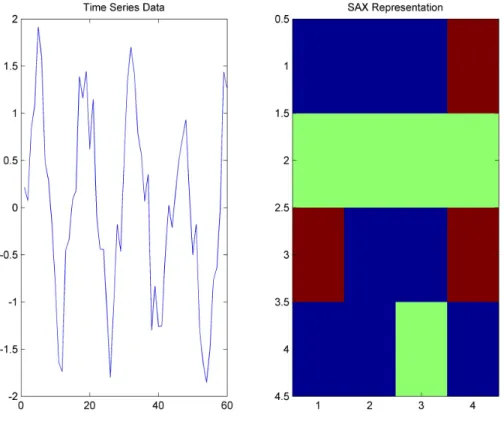
Figure 3.2: An example SAX bitmap representation
SAX has gained a prominent place in the time series research community due to its success in representation. SAX transforms the time series into a string of elements from a fixed alphabet which gives the ability to exploit different techniques already found and used in string manipulation. After the SAX
Figure 3.3: Three level Dual-Tree Complex Wavelet Transform [1]
transformation of the time series into a string, a post-processing method called SAX-bitmap is utilized which turns the string into a matrix (SAX-bitmap image in the visualization context) by counting the different substrings included in the whole string. SAX-bitmap is reported to be intuitive, useful in extracting important sub-patterns in the time series and is a perceptually appropriate representation for humans in visualizing and interpreting time series ([62]). In our context, we use it as a transformation of the time series to a vector which is then used with different distance measures for similarity retrieval. The method effectively counts the number of different local signatures after transforming the original time series to SAX representation. The level of the representation (L) corresponds to the length of the local patterns in the SAX representation. The length of the output of the SAX-Bitmap transform is ML where M is the number
of symbols used in the SAX transformation, which is independent of the time series length (Li).
SAX inherently divides the time series into blocks and normalizes the block within itself which extracts local features of the time series useful for diverse retrieval methods. The total number of occurrences in the whole time series gives information about the global features as well.
Wavelet Transform (and its variants Discrete WT, Continuous WT, Complex WT etc.) is a time-frequency representation used extensively in time-series domain. The transformed data (scaleogram) provides a frequency and time localization. The level of the representation (L) in CWT corresponds to the height of low pass components of CWT which in turn corresponds to different details of the low pass and high pass components. The upper part of the tree is the real part of the transform and the lower part of the tree is the complex part given in Figure 3.3. Dual-tree complex wavelet transform (named due to two parallel filter banks in the process) is relatively shift-invariant with respect to other flavors of the algorithm which is a reason behind its selection for this study [63]. The magnitude of the complex and real part is used in this paper. The length of the transformed data is independent of the number of levels and is given by 2dlog2Lie.
CWT has a similar approach with SAX but with a different perspective. CWT extracts some low-pass features, i.e., components which are in the lower frequency band and are relatively slowly varying giving an averaged version of the overall series and high pass features, i.e., components which are in the higher frequency band and are relatively fast varying, related to detail and differential information of the series. Down-sampling of the series along the branches allows the transform to extract information from different zooms of the data. As a summary, CWT decomposes the time series into local patterns in both time and frequency with different scales and can help for diversity as different subsets of the information given by the transformation provide different perspectives of the data.
3.4
RF with Diverse Top-k Retrieval
RF techniques inherently model the distribution around the query point with a limited number of user annotated data items to increase the accuracy subse-quently. After each iteration of RF, the user is given the opportunity to evaluate the resultant items presented by the system. A variety of different techniques can be utilized for the feedback mechanism, such as Rocchio’s algorithm ([18]) which
moves the query point in space closer to the relevant items. We have selected this algorithm since it is one of the foremost algorithms used in information retrieval for RF and is still considered with different variants as an important method in recent studies [21, 64, 65]. We have adapted a modified version of Rocchio’s algorithm. Rocchio method forms an additional query using the relevant and irrelevant items for successive rounds of RF. Equation 3.1 details the procedure where Rel is the set of items classified relevant, Irrel is the set of items classified as irrelevant by the user.
qnew = 1 |Rel| |Rel| X i=1 Reli− 1 |Irrel| |Irrel| X i=1 Irreli (3.1)
Newly formed query vector is not dependent on the original query but the original query affects the results via Equation 3.2 since the system uses the original query with the newly formed query vectors in the previous RF stages to calculate the distances. We also experimented with a Rocchio algorithm which directly replaces original query at each iteration and found that the modified version explained above performs better. For the successive iterations, a distance is calculated with respect to all the query points of the previous iterations which is outlined in Equation 3.2. The high level algorithm for RF system is shown in Algorithm 1. Dist(q1, q2, ..., qN, Ttest) = 1 N N X i=1 Dist(qi, Ttest)
where N is the RF iteration number
(3.2)
The RF method at its essence forms new queries (or modifies the initial query depending on the various implementations of the idea) and uses this new query in the next iterations for retrieving the similar time series items in the database. The main objective is to move the query vector closer to where more relevant objects are expected.
Top-k retrieval part of the RF system identifies k time series to be presented to the user who is seeking information relevant to the query, q. The general
Algorithm 1 High-level algorithm for diverse relevance feedback
1: Initialize k : number of items in result set
2: Initialize RF Rounds : number of RF iterations
3: Initialize λ = [λ1, λ2, . . . , λRF Rounds]: M M R parameters 4: Initialize α = [α1, α2, . . . , αRF Rounds]: CBD parameters 5: Input q1 : initial query (transformed if needed)
6: Input T SDB : time series database (transformed if needed)
7: for i = 1 → RF Rounds do
8: // Find Top-k results
9: if Nearest Neighbor then
10: R = Top-K(q1,. . . ,qi,k,T SDB) 11: else if M M R then 12: R = Top-K MMR(q1,. . . ,qi,k,λi,T SDB) 13: else if CBD then 14: R = Top-K CBD(q1,. . . ,qi,k,αi,T SDB) 15: end if
16: // User annotation of the result set
17: (Rel,Irrel) = User Grade(R)
18: // Expand query points via relevance feedback
19: qi+1 = Relevance Feedback(Rel,Irrel) 20: end for
method often used is to find the k-nearest neighbors which is a list of time series ranked according to a defined distance function with respect to q. The traditional assumption in this similarity model is that the data points closest to the query, irrespective of direction and non-circular user intent, is related to the user preference. However, there can be data points close to the query in theoretical sense yet not related to the interest of the user. Moreover, the intent of user can be already ambiguous itself or the query point may also be on the boundary of the user intent.
In the above explained case, as the name nearest neighbor (N N ) implies, only the data points in the vicinity of the query point are retrieved with rankings proportional to closeness of the data to the query. But the database may include numerous time series items very similar to each other which can degenerate the top-k list to an item list with very little variation. This degenerate top-k list will give very limited novel information about the user intentions since q is already known making RF less useful and wasting the time and annotation effort of the
user.
As a solution to the above issue, the user needs to be presented a top-k list with diversity among items which are still close to the query point. With a balanced diverse set of choices provided, the successive iterations of RF is expected to better meet the user intentions.
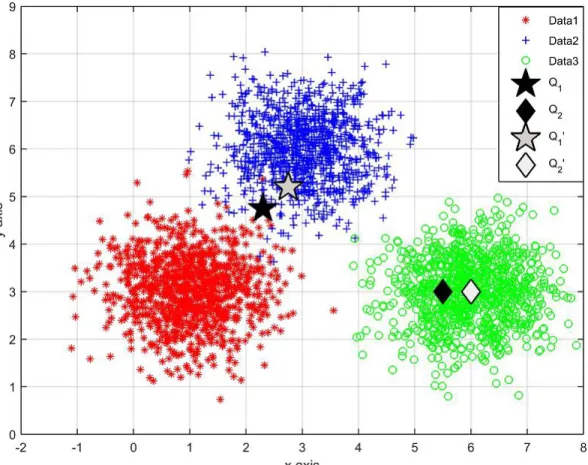
We present an example to illustrate the mechanics of the query relocation in Figure 3.4 and to discuss the potential advantages of utilizing diverse results. We have plotted three different classes of data (using three normal distributions with different means, each representing a user’s or a group of users’ interest) and queries of two extreme cases: Q1 query on the boundary in terms of user
interests and a Q2 query near to the main relevant set. These queries are moved
to revised points (or the effect of using new queries translates to this effect via Equation 3.2) Q01 and Q02 given that Data2 and Data3 are considered relevant by the user respectively. If nearest neighbor (N N ) retrieval is used, the result can be a degenerate list with too little variation and limited information about the user intentions since Q1 and Q2 are already known. If one provides a larger radius
around the query, which samples the region around the query, the displacement of the vectors from their original location will be higher. On the other hand, over-diversification of the results, causing very few relevant items finding a spot in the result set, will hinder and lower the accuracy of the next phase of user annotation. A probabilistic explanation to this intuition is also provided in Section 3.5.
We consider two different methods to diversify the top-k results in this study: maximum marginal relevance (MMR) and cluster based diversity. MMR (Algorithm 1 Line 12) merges the distance of the tested data item to both the query and to the other items already in the relevant set. The diversity achieving distance used is given in Equation 3.3 and a greedy algorithm is used until a specific number of items is selected from the whole dataset. Dist function is general and can be any distance function of choice. When λ is chosen as 1, the DivDist collapses to an N N distance and the result turns to a mere top-k nearest neighbor result. When λ decreases, the importance of the distance to the initial query decreases which gives an end result of diverse set of items within itself but
Figure 3.4: An example case of data and query movement with Rocchio based algorithm
are also related to the query.
DivDist(Tq, Ti, R) = λDist(Tq, Ti) − 1 |R|(1 − λ) |R| X j=1 Dist(Ti, Tj) (3.3)
The second term of the DivDist involves pairwise comparisons of data points in the database which is independent of the query and is performed repetitively for each query. To decrease the running time of the algorithm, we use a look-up table that stores all the possible pairwise distances calculated offline once at the beginning for the particular database.
Cluster Based Diversity (CBD) method uses a different approach than the optimization criteria as given in Equation 3.3. The method is inspired by [38]
which proposes method for finding best representatives of a data set. This method (Algorithm 1 Line 14) retrieves Top-αk elements (α ≥ 1) with a NN approach and then clusters the αk elements into k clusters. The parameter α controls the diversity desired, increasing α increases the diversity of the result set. If α is chosen as 1 then the results are the same as the N N case. We implement a k-means algorithm for the clustering phase in this study. The data points nearest to the cluster centers are chosen as the representative retrieved points which are presented to the user. An advantage of CBD is that the tuning parameter α is intuitive and the results are predictable.
We also notice that precision increase due to use of diversity depends significantly on the data distribution. Since the diversification algorithms are based on a distance directly or indirectly, the particular meaning of the features is important for the overall performance. This is especially important in the case of time series, as we have an autocorrelation within the elements. This observation stresses that the representation of the time series which is chosen according to its power in decoding general user intentions and its suitability for varying properties of time series with respect to different applications, should also have the power of decomposing time series into meaningful parts which have novel information. These properties have been considered in choosing the suitable representation.
The method for diversification can be tailored with respect to the methods used for searching and learning the user feedback. As an example, one can also utilize a support vector machine (SVM) based binary classifier to learn the relevant/irrelevant sets instead of the distance based ranking method used in this study. In this case providing the cluster centers as in the proposed CBD method will perform poorly since SVM classifier tries to learn the boundaries of the classes and requires the instances around the border regions for optimal performance. Hence, It will be better to sample the boundaries and form those type of queries in the SVM case. Whereas, NN-like distance based models, similar to the one considered in this paper, functions better if we learn the centroids of the relevant data with low uncertainty. We can expect to have better results from the CBD method which fits nicely with the distance based retrieval methods. This relation needs to be taken into account when diversity achieving methods are used and
the ranking system should be compatible with the diversification technique for satisfactory results.
3.4.1
Algorithmic Complexity
We present the algorithmic complexity of the retrieval methods in terms of N (the number of time series in database), L (the length of time series or representation), and k (the number of requested items). The N N based retrieval first calculates distances to all items in dataset (O(N L)) and finds k nearest items (O(kN )) which corresponds to a total complexity of O(N (L + k)) = O(N ).
For the MMR case we have two possibilities with respect to Equation 3.3:
• Without memoization: Distance calculations to all items in the dataset (O(N L)), distance calculations for relevant set items (O(N · L · (k − 1) · (k − 2)/2) = O(N Lk2), finding the minimum distance element k times (O(kN ))
with an overall complexity of O(N L(1 + k2)) = O(N ).
• With memoization: Distance calculations to all items in the dataset (O(N L)), distance calculations from lookup table for relevant set items (O((k − 1) · (k − 2)/2) = O(k2), finding the minimum distance element k
times (O(kN )) with an overall complexity of O(N · (L + k)) = O(N ) (where N L k2).
For the CBD case, we first find αk nearest neighbors (O(N (L + αk)) and cluster the results. K-means clustering (based on Lloyd’s which has a limit i for the number of iterations) is considered O(N kLi) = O(N kL) algorithm. The total complexity for CBD case is O(N (L + αk + Lki)) = O(N ).
3.5
Illustrative Analysis of Diverse Retrieval
We now present an illustration of the intuition behind using diversity in the RF context. Given a query, q, we retrieve a top-k list using N N with the last element d distance away from the query. Figure 3.5 illustrates the relevant set, R ∼ N (0, σ2) and the irrelevant set, IR ∼ N (µ, σ2) assuming Gaussian distributions
for both.
Figure 3.5: Data distributions used in analysis
relevant (k1) and irrelevant items (k2) in the top-k list with approximations as: k1 = N · Z q+d q−d R(x) dx ≈ N · R(q) · 2d if k1 N k2 = M · Z q+d q−d IR(x) dx ≈ M · IR(q) · 2d if k2 M k = k1+ k2 (3.4)
We can then define and calculate the precision for the query as:
P rec(q) = k1 k1+ k2
= N · R(q)
N · R(q) + M · IR(q) (3.5) This formula follows the general fact that if R and IR are separable (µ is very large) or if the query point is near the mean of R precision will be high. We also observe that the performance is dependent on the accuracy of the known model (i.e. the R and IR distributions) itself. We learn the model of the relevant set in the RF setting by modifying the query according to the feedback from the user. Consider a simplified RF model that forms the query for the next iteration (q2)
as the average of all the relevant items, i.e.:
q2 = k1 X i=1 Ri = Z q+d q−d x · R(x) dx = r σ2 2 · π[e q−d− eq+d] (3.6)
A diverse set of points around q would span a larger distance (δd) around the query, which is also shown in Figure 3.5. In this case we get a modified q20 from the relevance feedback as:
q02 = k1 X i=1 Ri = Z q+δd q−δd x · R(x)dx = r σ2 2 · π[e q−δd− eq+δd ] δ > 1 (3.7)
Diversity ensures q02 < q2 which increases our understanding of the relevant
data distribution and consequently the query precision via Equation 3.5. If the precision is already high (i.e., if R and IR are well separated or the query is not near the R and IR boundary), then the precision increase due to diversity will not be significant.
3.6
Evaluation
We evaluate the performance of the methods with experiments on all the data (85 real data sets) currently available in the UCR time series repository [66]. The data sets used with their respective properties are provided in Table A.1.
Since we have an unsupervised application, the training and test datasets are combined to increase the size of the data sets. The numbering of the datasets in this paper is according to the numbering given in the table. Some aggregate properties of the datasets are as follows:
• Number of classes within separate data sets vary from 2 to 60
• Lengths of the time series (L) in the data sets vary from 24 to 2709
• Sizes (number of time series N ) of the data sets vary from 40 to 16,637
3.6.1
Experimental Setting
We first transform all the time series data to CWT, SAX and FFT. SAX parameters are N = Li, n = dN5e (meaning blocks of length 5), an alphabet of four
with SAX-Bitmap level of 4. The values for L and n can be optimized for different data sets to further increase accuracy. We have experimented with several different values around the vicinity of the given values (n = dN6e, L ∈ [3, 4]) for randomly selected datasets and have seen that the improvement in precision is still evident on similar scales. For the Complex Wavelet Transformation we utilized the Dual-Tree CWT implementation given in [67] with detail level L = 5. We used both the complex and real parts by taking the absolute value of the CWT coefficients. We performed the same experiments also on the raw time series without any modification (TS) to compare the effectiveness of the representations.
Since the objective of this study is not to find solutions for specific cases and we aim to enhance RF via diverse results for general cases, we did not fine
tune parameters, we used the same set of parameters for all the data sets for an impartial treatment.
In the experiments, we explored 5 different methods of top-k retrieval:
1. nearest neighbor (N N )
2. MMR with λ = [0.5, 1, 1] (M M R1)
3. MMR with λ = [0.5, 0.75, 1] (M M R2)
4. CBD with α = [3, 1, 1] (CBD1)
5. CBD with α = [3, 2, 1] (CBD2)
In the stated configuration, we explore the effects of diversification on the accuracy by varying the level of diversification in different iterations. We note that M M R2 and CBD2 cases decrease the diversity in a more graceful way whereas
M M R1 and CBD1 go directly to N N case after the initial iteration. We did
not try to optimize the parameters (λ and α) of the diversification schemes and the values present themselves as mere intuitive estimates. We implemented a unit normalization method for each dataset and used cosine distance for all the experiments.
We also implemented the method given in [46] to compare the performance of our algorithms. This method uses a piecewise linear approximation (PLA-RF) for time series and associates a weight for each part of the series when calculating the distances to query. These weights are modified in each iteration of feedback according to the user feedback.
In the experiments, we model the user as a person seeking similar time series from the same class in the dataset. Under this model, the class of the series is used to generate relevant/irrelevant user feedback after each RF iteration. Items in the result set which are of the same class as the query are considered relevant and vice versa. The experiments were performed on a leave-one-out basis such that we use each and every time series in the database as a query and RF is
executed with the related parameters using the database excluding the query itself. Accuracy is defined by precision value based on the classes of the retrieved top-k set. Precision for the query is calculated using the resultant top-k list and the averaged precision over all the time series in the database is considered as the final performance criteria which are defined below:
Query Precision(Tq) = 101 P10 i=1δ(i) Average Precision = N1 P ∀Tq∈T SDB Query Precision(Tq) where δ(i) = (
1 if class of Tq is equal to class of Ri
20 40 60 80 50 100 NN TS 20 40 60 80 50 100 CWT 20 40 60 80 50 100 SAX 20 40 60 80 50 100 FFT 20 40 60 80 50 100 MMR 1 20 40 60 80 50 100 20 40 60 80 50 100 20 40 60 80 50 100 20 40 60 80 50 100 MMR 2 20 40 60 80 50 100 20 40 60 80 50 100 20 40 60 80 50 100 20 40 60 80 50 100 CBD 1 20 40 60 80 50 100 20 40 60 80 50 100 20 40 60 80 50 100 20 40 60 80 50 100 CBD 2 20 40 60 80 50 100 20 40 60 80 50 100 20 40 60 80 50 100 Round 1 Round 2 Round 3 Figure 3.6: P erformance for three rounds of RF for all the datasets (precision scaled to 100 in y-axis v ersus dataset n um b er in x-axis)
3.6.2
Experimental Results
The experimental results for diversity in the result set are given in Figure 3.6 for all the data sets. Each row in the figure corresponds to one of five retrieval methods and each column corresponds to the representation (TS, CWT, SAX, and FFT) used. In each individual graph, the average precision in different RF iterations is plotted with the data set number given in x-axis. We present an aggregate result here to summarize the results.
Table 3.1: Average Increase (absolute) in Precision RF Round 2 3 N N 9.08 12.73 M M R(λ1) 14.19 19.98 M M R(λ2) 15.75 20.01 CBD(α1) 18.88 22.98 CBD(α2) 12.60 23.44 PLA-RF 3.7 4.4
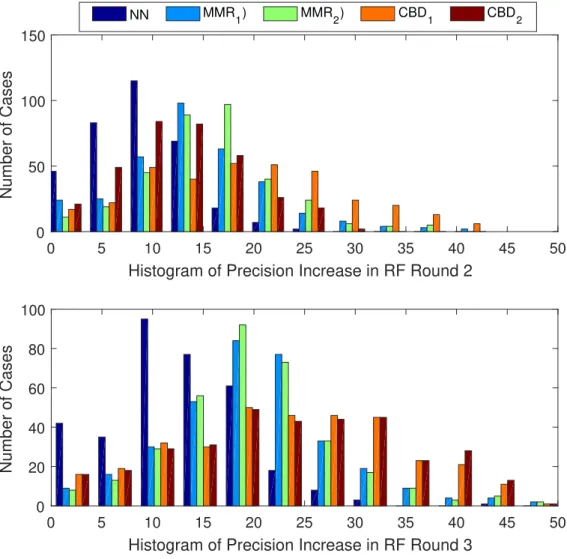
We calculated the precision (scaled to 100) difference between different rounds and the first round of RF for a particular representation, method and data set (4 representations x 5 methods x 85 data sets = total 5100 cases). Histogram of the resulting improvements is provided in Figure 3.7. Differences in precision (averaged over all cases) are provided in Table 3.1 to quantify the performance increase with the use of diverse RF. We also performed a t-test between the average values given in the table and a zero mean distribution to verify the statistical significance of the improvement. The p-values, in the range of 10−110, are notably smaller than 0.05 which is considered as a threshold for significance. RF with the configurations given in this study improves accuracy in all cases without any dependence of data type or data representation and it provides significant benefits with 0.50 point precision increases in some cases. We also note that the proposed methods outperform the state of the art.
Since the experiments produced large amount of results (given the number of time series data types, representations, top-k retrieval methods), for illustrative purposes, we consider a reference case where the time series without any
0 5 10 15 20 25 30 35 40 45 50
Histogram of Precision Increase in RF Round 2
0 50 100 150 Number of Cases 0 5 10 15 20 25 30 35 40 45 50
Histogram of Precision Increase in RF Round 3
0 20 40 60 80 100 Number of Cases NN MMR 1) MMR2) CBD1 CBD2
Figure 3.7: Histogram of increase in precision with different RF settings feedback
transformation and N N only method is used. Accordingly, for each RF round and each data set, the accuracy results are normalized to a total 100 with respect to the base case for that particular data set and RF round. Figure 3.8 shows the normalized results averaged over all the experimental cases. CWT based representation outperformed FFT, SAX and the time series without any transformation (TS) in nearly all cases. We note that representation parameters are not optimized and different results may be achieved by further optimizing transformation parameters. We did not perform such rigorous testing since it would divert us from the main focus of the study. However, CWT performed better consistently with no need of parameter optimization.
NN MMR 1 MMR2 CBD1 CBD2 70 80 90 100 110 RF Round 1 TS CWT SAX FFT NN MMR 1 MMR2 CBD1 CBD2 80 90 100 110 RF Round 2 NN MMR 1 MMR2 CBD1 CBD2 90 100 110 RF Round 3
Figure 3.8: Normalized performances of different methods and representations
Although N N achieves the best performance in the first iterations of RF as expected, introducing diversity in the first iteration leads to a jump in RF performance exceeding N N in nearly all the cases. In RF round 3, CBD2,
the best performing method, adds 6.3% (p-value < 0.05) improvement over the reference case and 2.5% (p-value < 0.05) over the case which uses N N method with CWT. Diversity increases its effect further in the third rounds where N N is outperformed even in more cases with similar performance advancements. We also note that CBD1 and CBD2 perform best in second and third iterations
increased diversity if the number of iterations increases. 0 0.1 0.2 0.3 0.4 0.5 0.6 0.7 0.8 0.9 1 Purity 99 100 101 102 103 104 105 106 107 108 109 110
Normalized Precision Increase
Datasets Linear Fit
Figure 3.9: Normalized performances of different datasets versus purity of dataset
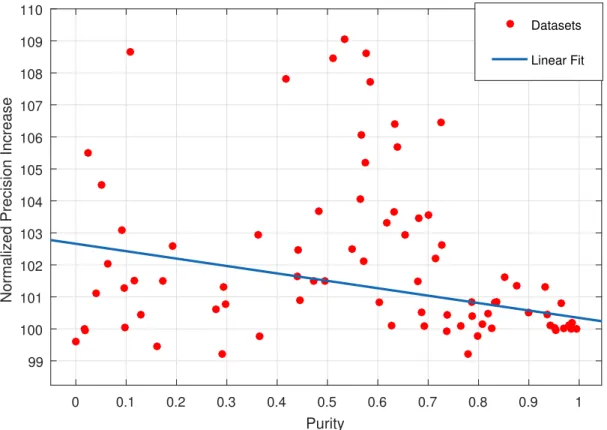
We also investigated the relation between cluster separability within the dataset and the improvements due to diversity. For this purpose, we calculated a separability score for each data set by using a k-means classifier and the average accuracy of the classifier is considered as the separability of the data set. This score, which is in the range 0 − 1, essentially quantifies the separability of the classes where a score closer to 1 means easily classifiable datasets. We plot the normalized precision described in the previous paragraphs against the purity of the related dataset with the corresponding linear fit in Figure 3.9. Effect of diversity is not significant where classes are already separable (datasets with purity in the range [0.75, 1]) which is inline with our expectations. Positive effect of diverse retrieval increases when the classes are more interleaved which is the harder case in terms of system performance.
3.7
Conclusion
Even though combinations of diversity and RF have been explored in the fields of information retrieval and text mining, this successful concept did not attract much attention for time series analytics. This chapter explores the use of diversity enhanced RF for improving system accuracy and increasing user satisfaction in time series retrieval applications. We also illustrated the statistical background of the potential of diversity for increasing RF precision.
Experimental results on a wide variety of real data demonstrates that regard-less of the selected representation, even with a relatively simple RF model, user feedback increases the retrieval accuracy. Results show precision improvements even in just one iteration of user feedback confirming the suitability and potential of RF in the similarity based time series search scenarios. Additionally results endorse our intuition and shows even higher accuracy improvements when diversity within the result set is used in the first iteration of RF in many of the cases.
The intuitive cluster based diversity method, without any rigorous parameter optimization, performed higher in terms of overall precision. Fine tuning of the diversity balance according to the dataset properties and user objectives can extend the improvements. We also note that methods with higher level of diversity (M M R2 and CBD2) perform superior with respect to their counterparts
in the third iteration of RF. This also underlines the enhancement in performance due to increased diversity as the number of iterations increases.
The analysis of the results in terms of cluster separability withing the dataset provides evidence in favor of result diversification performing better in non-pure and non-separable data cases which are the challenging cases in the performance of machine learning and retrieval systems.
The presented results and analysis can serve as a basis for new approaches for diversification of time series data. During our exploration of the topic, we experimented different potential approaches for diversification of time series. We adapted matching based similarity (e.g., k-n match [68]) and STFT (short time fourier transform [69]) for time series diversification. However, we did not include their discussions in this study as the proposed approaches produced better results than these possible alternatives.
Algorithm 2 High-level algorithm for representation feedback system
1: r is given as the number of representations
2: Initialize parameter N umberOf Iterations 3: q1 is given as the initial query in time domain
4: T SDBr is given as the time series database with representation r 5: if Representation Feedback via Weighting then
6: T SDB = Concatenation the representations (T SDBr) 7: Initialize β weights
8: Initialize parameter k // number of items to retrieve 9: else if Representation Feedback via Partitioning then
10: Initialize parameter ki for i : 1 . . . r 11: end if
12: for i = 1 → N umberOf Iterations do
13: // Find Top-k results using any alternative method
14: if Representation Feedback via Weighting then 15: R = Top-K(q1,. . . ,qi,T SDB,β)
16: else if Representation Feedback via Partitioning then
17: R = ∅
18: for j = 1 → r do
19: R =R ∪ Top-K(q1j,. . . ,qji,T SDBj,kj) 20: end for
21: end if
22: // Let user grade the retrieval results
23: (Rel,Irrel) = UserGrade(R)
24: // Expand query points via relevance feedback
25: if Representation Feedback via Weighting then
26: qi+1 = Relevance Feedback(Rel,Irrel)
27: else if Representation Feedback via Partitioning then
28: R = ∅
29: for j = 1 → r do
30: qi+1j = Relevance Feedback(Rel,Irrel)
31: end for
32: end if
33: // Update representation feedback parameters
34: if Representation Feedback via Weighting then
35: β = UpdateWeights(β,Rel,Irrel)
36: else if Representation Feedback via Partitioning then
37: ki = UpdateK(ki,Rel,Irrel) 38: end if
Chapter 4
Variations of Time Series
Relevance Feedback
This chapter further examines the different variations of the RF system defined in Chapter 3. We present two modifications to the proposed algorithms to satisfy different application requirements and data properties.
Firstly, we propose representation feedback which is a distinctive aspect for time series data. The proposed two methods tackle the problem of selecting the satisfactory representation automatically without a human intervention using the already available user annotations. This can be useful in cases where different representations are relevant for different users (groups) or in dynamic cases where optimal representation can vary because of the incoming data properties.
Secondly, we propose the use of autoencoders for learning data-aware repre-sentations from the time series data to be used in our RF framework. Successful application of this concept leads to decrease in both computational and memory requirements of the retrieval engine. We also report that learning data-aware representation leads to increase in accuracy in some cases which indicates the potential of this method for other time series analytics tasks.
![Figure 3.3: Three level Dual-Tree Complex Wavelet Transform [1]](https://thumb-eu.123doks.com/thumbv2/9libnet/5992577.125898/28.918.184.770.189.502/figure-level-dual-tree-complex-wavelet-transform.webp)