CRITICAL REVIEW
Cite this:Lab Chip, 2016, 16, 2572
Received 19th April 2016, Accepted 31st May 2016 DOI: 10.1039/c6lc00521g www.rsc.org/loc
Oligonucleotide-based label-free detection with
optical microresonators: strategies and challenges
Pelin Toren,
abErol Ozgur
aband Mehmet Bayindir*
abcThis review targets diversified oligonucleotide-based biodetection techniques, focusing on the use of microresonators of whispering gallery mode (WGM) type as optical biosensors mostly integrated with lab-on-a-chip systems. On-chip and microfluidics combined devices along with optical microresonators pro-vide rapid, robust, reproducible and multiplexed biodetection abilities in considerably small volumes. We present a detailed overview of the studies conducted so far, including biodetection of various oligonucleo-tide biomarkers as well as deoxyribonucleic acids (DNAs), ribonucleic acids (RNAs) and proteins. We partic-ularly advert to chemical surface modifications for specific and selective biosensing.
1. Introduction
Biosensing covers all the analytical methods used to detect the presence of biological entities within a medium and the interactions among them, using various equipment and methodologies. Besides its indispensable everyday applica-tions, biosensing is also a prominent research field since there is a huge demand for label-free, ultra-sensitive, scaled down and robust biosensors in basic research as well as in the food, environmental, biomedical, and pharmaceutical technologies. For this purpose, during the past decade, a significant number of methods with novel alternative strategies1–3have been suggested.
Biosensors are analytical devices specialised for detection of a certain biological species. Similar to signal transduction pathways in cellular biology, biosensors consist of two basic parts, which are receptor and transducer. The receptor recog-nises the target, while the transducer converts the receptor– target interaction into a measurable signal. In biosensors, several transduction mechanisms exist, which can be categorised under main titles including mechanical,4 acous-tic,5electrical6and optical.7
Optical sensors, among the most investigated biosensing tools, particularly provide opportunities for label-free, highly sensitive sensing capabilities with small working volumes, easy on-chip integrations, and fast and multiple read-outs. They are also quite suitable platforms for investigating light–
matter interactions. Since such interactions can be mathe-matically described using two parameters, refractive index (n) and extinction coefficient (k), these parameters also define the characteristics of materials in terms of optical properties. Therefore, a considerable amount of research has been de-voted to deciphering and engineering the optical characteris-tics of materials. One of the important branches, which sprouted out of optical engineering, is detecting the presence of various interactions between materials by exploiting the changes in the measured optical characteristics.8 Among dif-ferent applications of optical detectors, one of the most prac-tical applications is biological sensing, where optics provides invaluable opportunities.9
Most biological entities and biological interactions occur within the nanometer scale. This makes their direct visualisa-tion impossible without causing them serious harm. Labelling biological samples with fluorophores is a limited solution with several issues to consider such as adverse interaction of the label with the sample and difficulty in real-time observa-tion.10Therefore, label-free biosensors enabling detection of biological materials and their interactions are essential for a better comprehension of all biological phenomena. There are various methods for label-free biodetection,11,12all employing indirect methods for realising their purpose. Electrochemical sensors,13for instance, can measure a change in electrical im-pedance, conductivity or electric potential caused by the inter-action of an analyte with the biosensor. Optical biosensors, on the other hand, provide this information by taking into ac-count the changes in n and k using various strategies. Differ-ent types of biosensors possess distinct comparative advan-tages and deficiencies. These criteria directly influence their applicability over various biosensing issues. The most impor-tant characteristics determining the applicability of a biosen-sor are sensitivity, selectivity, dynamic range, robustness, and
aInstitute of Materials Science and Nanotechnology, Bilkent University, 06800
Ankara, Turkey. E-mail: [email protected]; Tel: +90 312 290 3500
bUNAM-National Nanotechnology Research Center, Bilkent University, 06800
Ankara, Turkey
cDepartment of Physics, Bilkent University, 06800 Ankara, Turkey
Published on 31 May 2016. Downloaded by Bilkent University on 7/19/2018 6:35:13 PM.
View Article Online
cost. These parameters are all intertwined, imposing strict compromises among each other.
Optical biosensors, compared to their mainstream bio-chemical or electrobio-chemical counterparts such as Enzyme-Linked Immunosorbent Assay (ELISA)14 or blood glucose sensors,15have a limited use in biosensing, particularly due to their generally complex operation and relatively higher perfor-mance and maintenance cost. On the other hand, there are certain potentials yet to be realised, motivating researchers to devote considerable effort in order to devise novel optical bio-sensors. The main reasons for pursuing optical sensors for the detection of biomolecular species and interactions are the pos-sibility of ultimate, i.e. single entity, detection,16the potential of fabrication from well-defined materials,17 and the maturity in methods for appropriate functionalisation of particularly silicon-based optical biodetection.18
Among various methods of optical biosensing, resonators of whispering gallery mode (WGM) type solely have the po-tential for ultimate sensitivity.16 The WGMs were first ob-served in the inner walls of a cathedral with a circular struc-ture, which allows sound waves to travel at certain frequencies through the inner circumference. Later on, a sim-ilar phenomenon was discovered in micro-optical structures, in which the light waves travel through a circular path due to total internal reflection.16 In such structures, the resonant modes exist only at discrete multiples of wavelengths which are determined by the length of the resonators (mλ = Ln).19 When an analyte is adsorbed on the microresonator surface, the path length of the light inside the microresonator is al-tered, causing a shift in the resonant wavelength, which is tracked for sensing and quantifying biological species.20
The figure of merit of these WGM microresonators is the quality (Q) factor, which is the ratio of the total optical power accumulated within the microresonator to the power dissi-pated with various mechanisms such as absorption, scatter-ing or couplscatter-ing.21 The higher the Q factor of a micro-resonator, the sharper the resonant mode becomes due to the fact that the time each photon travels within the micro-resonator also increases while the circumference remains constant; thus, more strict measures apply for a photon to satisfy the resonance condition in terms of wavelength.21 This positively affects the WGM biosensors in terms of sensi-tivity in two aspects, sharper resonances, which provide eas-ier WGM shift tracking, and longer photon–analyte interac-tion times, thus increasing the efficiency. The latter one leads to one of the critical advantages of WGM biosensing, paving the way for single biological entity detection.21 The only alternative to this strategy is reducing the mode volume, i.e. the volume in which light is confined drastically, such as in the case of plasmonic nanoparticles, where even alter-ations caused by single molecules become detectable.22Yet, compared to WGM biosensors, this is a relatively recent tech-nology requiring a specialised set-up for dark-field imaging with high sensitivity. WGM microresonators have been re-cently demonstrated to be even capable of single molecule detection by exploiting the plasmonic enhancement.23
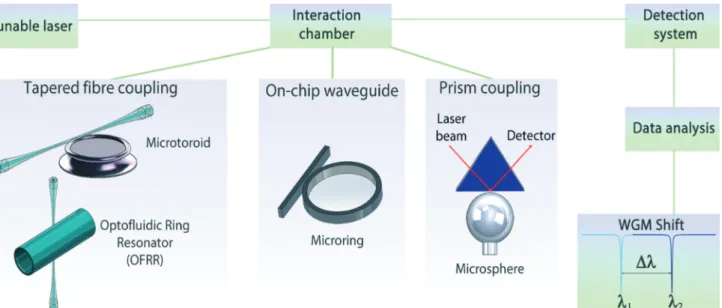
WGM biosensors form a suitable platform for bio-detection in which light interacts with the analyte in the vi-cinity of the microresonator. In order to perform bio-sensing, light must be coupled to the microcavity during its travel. The most efficient method for coupling light by satis-fying resonance conditions and observing a shift in the tracked resonance mode simultaneously is using a tuneable laser with a narrow linewidth. External cavity lasers24or dis-tributed feedback lasers25 are generally used for this pur-pose. Current laser systems provide tuneability with sub-picometer resolution. A significant part of biodetection using WGM microresonators is the detection of the optical signal. On this side, blind photodetectors connected to a power meter or directly to an oscilloscope could be effec-tively used.26 The rest of the measurement is basically sig-nal acquisition and processing, where an oscilloscope and a computer are required. A schematic description of WGM biosensing is given in Fig. 1.
WGM biosensors are mostly fabricated using standard micro-processing materials, i.e. silicon and silicon dioxide, via various microfabrication techniques. For producing some of the types including microtoroids, a post-fabrication pro-cess is required, in which surface roughness is significantly decreased by thermal treatment, resulting in ultrahigh Q microresonators, where energy dissipation primarily occurs due to optical absorption of the material from which the res-onator is produced. These microcavities are referred to as surface tension induced microcavities (STIMs).27 They have quite low surface roughness values, reducing scattering losses virtually down to zero. On the other hand, it is extremely cumbersome, if not impossible, to provide a robust on-chip waveguide integration with the STIM microresonators, except for some rare examples.28The light is commonly coupled to the STIMs either via tapered fibres or via prism couplers. However, these light coupling approaches require precise alignment and are inconvenient to integrate with micro-fluidic systems, particularly for the tapered fibre coupling. Non-STIM microcavities, on the other hand, can be fabricated with on-chip waveguides. However, they have at least 2 orders of magnitude lower Q values, preventing their use in single molecule biodetection.21 Nevertheless, the non-STIM micro-resonators, particularly microrings, are significantly advanta-geous especially in multiplexed detection because tens of microrings can be fabricated and utilised in a parallel man-ner, and this is unique to the microring resonators.
Biosensing heavily depends on the sensitive and selective target detection capability of the biosensor. For this issue, the approach used in surface modification for conjugating probe molecules is crucial. In order to perform feasible bio-sensing, the surface of the biosensor should be engineered elaborately. Entities for molecular recognition, which are gen-erally referred to as probe molecules, are a must for bio-detection. The first prerequisite of the surface modification is covalent or non-covalent attachment of the probe molecules onto the biosensor surface. However, many parameters should be individually considered besides probe conjugation
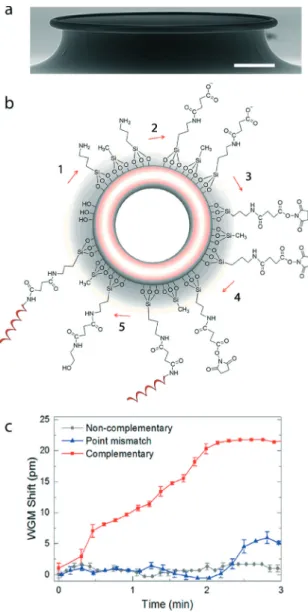
for an enhanced sensitive and selective biodetection. The ap-proach used in probe conjugation can be considered ade-quate for a reliable biosensing to some extent; however, for most cases, additional surface chemistry is required, espe-cially for biosensing in a complex medium.26A myriad of dif-ferent strategies exist for biosensor surface modification, where different problems demand different solutions.18Yet, some of these solutions are inevitably more effective than those of their counterparts in terms of efficiency and reliabil-ity. Here, it is important to mention that silane-based surface modification is dominant in optical biosensors, since silane molecules enable covalent attachment on silicon/silica-based surfaces, which constitute the vast majority of the WGM bio-sensors. On the surface of a WGM biosensor, various func-tional groups can be obtained using silane chemistry. Each functional group provides a distinct characteristic to the bio-sensing system, while the strategy follows a common pattern based on silane chemistry, as illustrated in Fig. 2.18Adverting to surface modification strategies used in WGM biosensing is among the goals of this review.
Biomolecular interactions (such as antibody–antigen) oc-cur within an aqueous medium. This fact compromises the use of the WGM type of microcavities regarding several as-pects. The first issue that needs to be considered is the wave-length to be used. Although the optimum wavewave-lengths in sil-ica structures are 1310 and 1550 nm, which are also referred to as telecom wavelengths for the minimum loss of silica, at these wavelengths there is considerable water absorption.29 Therefore, visible and near-infrared wavelengths, such as 670 nm, are shown to be more effective in optical biosensing.29 Also, another important concern is optical coupling in aque-ous media. Especially, tapered fibre coupling suffers heavily
Fig. 1 Schematic diagram summarising the oligonucleotide-based biosensing approaches using various optical resonators (microtoroids, optofluidic ring resonators (OFRRs), microrings and microspheres). Light incoming from a continuously sweeping laser source is coupled to an op-tical resonator via a tapered fibre, an on-chip waveguide or a prism coupler. The intensity of the transmitted light is traced using a detection sys-tem. The resonance wavelength shift (fromλ1toλ2) of the traced WGM is analysed. The biosensing module, in which coupling and analyte infusion
through the surface modified resonator occur, can be either a microfluidic or a flow system.
Fig. 2 Surface modification of an optical resonator for specific target detection. The schematic drawing shows a general approach to the chemical modification of a silicon/silica-based optical resonator for specific oligonucleotide-based detection. (1) Cleaning of biosensor via UV/ozone or chemical treatment to induce the formation of reactive silanol groups. (2) Pre-functionalisation of the biosensor surface with a silane molecule via silane condensation reaction, where OR′ can be a methoxy, ethoxy or acetoxy group and X can be an alkyl, aryl or organofunctional group. (3) Surface functionalisation by covalently conjugating an oligonucleotide probe (either modified or non-modi-fied) to the silane-coated biosensor. Additionally, in between a silane molecule and a probe, a linker molecule can be used. (4) Specific tar-get detection using probe–target interactions.
from mechanical perturbations occurring within the environ-ment,30particularly by the presence of a fluid flow.
Microfluidic integration with the WGM biosensor in-creases the biosensing efficiency substantially. Yet, not all the optical biosensors, especially the high-Q ones, are com-patible with microfluidic systems, mainly due to limitations in optical coupling. Microfluidic integration, on the other hand, provides invaluable efficiency and flexibility, especially in multiplexed detection. It would be fair to indicate that there is a trade-off between the sensitivity and the micro-fluidic compatibility of WGM biosensors, despite many seri-ous efforts to overcome this challenge. For microresonators having a high-Q factor, an idealised multiplexed optical bio-sensing system with microfluidic integration is shown in Fig. 3.
The goal of this review is to discuss biodetection of/with oligonucleotides in detail. Oligonucleotide-based detection is a critical issue, since oligonucleotides possess the informa-tion regarding the origin and nature of life. Therefore, detec-tion of oligonucleotides with high sensitivity and selectivity is an important issue accordingly. Among many different methods for oligonucleotide detection, quantification and analysis, optical biosensors are promising tools; yet, from our point of view, it is still far from realising their full potential.
Our aim for writing this review is therefore first critically analysing the current status of optical biosensing using par-ticularly the WGM microresonators and then describing the pros and cons of each different approach within this broad set objectively. Finally, we would like to comment on the fu-ture direction of oligonucleotide-based optical biosensing. Also, significant attention to the surface chemistry used in WGM biosensors is required to understand specific molecu-lar interactions.
This review is divided into three main sections according to target types (DNA, RNA and protein). Also, a comprehen-sive summary of different oligonucleotide detection strategies with their experimental results is given in Table 1. As can be seen from Table 1, there are already quite successful results in terms of sensitive and selective optical biodetection using oligonucleotides. Surface modification strategies using the WGM type of biosensors are considerably mature and serious progress has been made through optical coupling and micro-fluidic integration of these optical microstructures. Our pri-mary aim is to explain the critical steps towards these accom-plishments while writing this review.
2. Detection of deoxyribonucleic acid
(DNA)
2.1 DNA hybridisation and distinguishing single mismatches Since the identification of the structure of DNA55in 1953, at an increasing pace we are learning more about it. DNA mole-cules perform two important tasks: they replicate themselves by making copies of themselves from the beginning of life and they indirectly supervise the protein expression.56Thus, unsur-prisingly, there is a tight relationship between various disease states and DNA alterations.35 Understanding and detecting disease-related variations in DNA molecules are essential in early detection, which increases our chance of living.
There has been a tremendous effort to develop sensitive and sequence-specific DNA sensing platforms until now. Throughout the years, several DNA biosensing approaches have been developed, such as Polymerase Chain Reaction (PCR),57 DNA arrays,58,59 nanomechanical DNA sensors,60 electrochemical DNA sensors,61,62and DNA biosensors based on graphene,63 surface plasmon resonance,64 nano-fibre65 and nanowire.66Here, we introduce, DNA sensing approaches using optical microresonators.
It would be beneficial to begin with a former work of Vollmer F. and co-workers31in which multiplexed quantifica-tion of DNA was done using two silica microspheres. In order to hybridise with their fully complementary targets, individu-ally, 27-mer oligonucleotides of interest were conjugated to dual microspheres via streptavidin–biotin interactions. By evanescently coupling light from a tuneable laser source to dual microspheres in a liquid sample cell, the resonances from each microsphere were identified separately in the transmission spectra as individual Lorentzian dips. In order to demonstrate the ability of the suggested biosensing plat-form in terms of distinguishing single mismatch alterations,
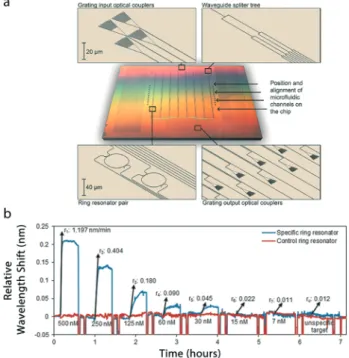
Fig. 3 Multiplexed oligonucleotide-based detection using micro-toroids as optical resonators having high-Q factors. Illustration of a lab-on-a-chip biosensing system consisting of microfluidic channels each having one microtoroid (yellow circles), which can be used for multiplexed oligonucleotide-based detection. The proposed system has four inlets (from I1to I4) and one outlet for controlled target flow
in small volumes. Data are gathered separately from optical outputs, which are all branched from a common optical input (red lines). The inset shows an on-chip, curved waveguide and a microtoroid located at a critical distance as a schematic drawing regarding a previous work.28
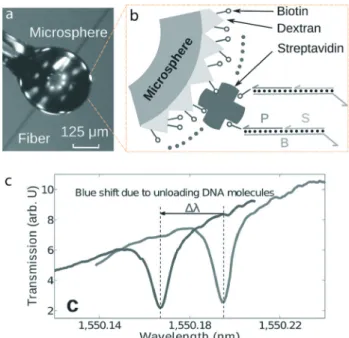
hybridisation between match and mismatch of an 11-mer oli-gonucleotide was shown. Also, the mismatch detection ability of the biosensor platform was demonstrated at an optimised specific temperature (∼23 °C) and optimized salt concentra-tion (20 mM tris, 30 mM sodium chloride at pH 7.8). The sensitivity of the suggested technique was reported as 6 pg mm−2mass loading. The authors of the article provided in-formation about the sensitivity of their biosensor only in terms of the mass loading, while the minimum detection ca-pability according to the analyte concentration was not given. A work of Wu Y. and co-workers32can be given as an ex-ample of the high specificity and sensitivity of DNA detection as an alternative approach besides its reusability and versatil-ity. DNA loading and unloading from a microsphere (Fig. 4a) was provided via a DNA catalytic network scheme with a LOD of 22-mer DNA oligonucleotide of ∼80 pM (32 fmol). Since the suggested idea was based on analyte unloading from the microresonator, a reusable DNA biosensor was obtained using this technology.
Probe DNA molecules, which could be used to detect mul-tiple analytes, were attached to the microsphere surface via biotin–streptavidin interactions (Fig. 4b, P molecule) as in the previous study.31The DNA unloading from the surface
oc-curred via a catalytic reaction (Fig. 4b, S and B leaves the sur-face). Fig. 4c shows the optical transmission spectra of the DNA unloading from the microsphere causing a blue shift. Single base alterations were reported, which were detected via the DNA loading/unloading rates by a factor of 40 to 100.
On the other hand, microrings as another branch of opti-cal resonators are also opportune tools for DNA bio-sensing33,67 and identifying the point mismatches33,37,39 by providing high-throughput and real-time analyses with on-chip integrations as in arrays. In a work of A. J. Qavi and co-workers,33an isothermal approach to discriminate single nu-cleotide polymorphisms (SNPs) was demonstrated. 32 silicon microrings (30 μm in diameter) consisting of reference microrings for thermal drifts on a sensor array were assem-bled into a flow channel. N-Succinimidyl-4-formylbenzamide (S-4FB) modified ssDNA strands were covalently conjugated to HyNic silane functionalised microrings. Multiplexed DNA detection was provided by hand-spotting four different ssDNA probes having solutions complementary to 4 different target ssDNAs on a sensor array. Detection of the single base alter-ations was done by monitoring the desorption rates of the target ssDNAs leaving the formed DNA duplexes on the bio-sensor surface, similar to an approach demonstrated in the
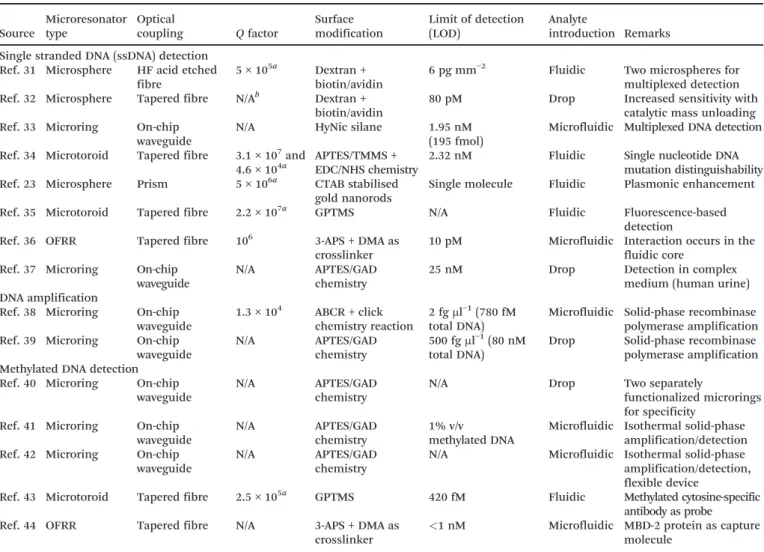
Table 1 Comparison of oligonucleotide-based optical biodetection using the WGM type biosensors
Source Microresonator type Optical coupling Q factor Surface modification Limit of detection (LOD) Analyte introduction Remarks Single stranded DNA (ssDNA) detection
Ref. 31 Microsphere HF acid etched fibre
5× 10⁵a Dextran +
biotin/avidin
6 pg mm−2 Fluidic Two microspheres for
multiplexed detection
Ref. 32 Microsphere Tapered fibre N/Ab Dextran +
biotin/avidin
80 pM Drop Increased sensitivity with
catalytic mass unloading Ref. 33 Microring On-chip
waveguide
N/A HyNic silane 1.95 nM
(195 fmol)
Microfluidic Multiplexed DNA detection Ref. 34 Microtoroid Tapered fibre 3.1× 10⁷and
4.6× 10⁴a
APTES/TMMS + EDC/NHS chemistry
2.32 nM Fluidic Single nucleotide DNA
mutation distinguishability
Ref. 23 Microsphere Prism 5× 10⁶a CTAB stabilised
gold nanorods
Single molecule Fluidic Plasmonic enhancement
Ref. 35 Microtoroid Tapered fibre 2.2× 10⁷a GPTMS N/A Fluidic Fluorescence-based
detection
Ref. 36 OFRR Tapered fibre 106 3-APS + DMA as
crosslinker
10 pM Microfluidic Interaction occurs in the fluidic core
Ref. 37 Microring On-chip waveguide
N/A APTES/GAD
chemistry
25 nM Drop Detection in complex
medium (human urine) DNA amplification
Ref. 38 Microring On-chip waveguide
1.3× 10⁴ ABCR + click chemistry reaction
2 fgμl−1(780 fM total DNA)
Microfluidic Solid-phase recombinase polymerase amplification Ref. 39 Microring On-chip
waveguide
N/A APTES/GAD
chemistry
500 fgμl−1(80 nM total DNA)
Drop Solid-phase recombinase polymerase amplification Methylated DNA detection
Ref. 40 Microring On-chip waveguide
N/A APTES/GAD
chemistry
N/A Drop Two separately
functionalized microrings for specificity
Ref. 41 Microring On-chip waveguide
N/A APTES/GAD
chemistry
1% v/v
methylated DNA
Microfluidic Isothermal solid-phase amplification/detection Ref. 42 Microring On-chip
waveguide
N/A APTES/GAD
chemistry
N/A Microfluidic Isothermal solid-phase
amplification/detection, flexible device
Ref. 43 Microtoroid Tapered fibre 2.5× 10⁵a GPTMS 420 fM Fluidic Methylated cytosine-specific
antibody as probe
Ref. 44 OFRR Tapered fibre N/A 3-APS + DMA as
crosslinker
<1 nM Microfluidic MBD-2 protein as capture molecule
aforementioned study32 (Fig. 5a and b). The target binding kinetics due to either hybridising with fully complementary counterparts or targets having SNPs at different positions af-fected the desorption rates, resulting in different blue WGM shifts (Fig. 5c). The LOD for this study was reported as 195 fmol (1.95 nM) target DNA.
Nevertheless, single base pair alterations can also be ob-served using different approaches such as engineering the surface of the optical microresonators. Recently, we have demonstrated34 how an optical microresonator with an engineered surface could be able to detect single base pair variations in a DNA molecule. Since detecting even point mis-matches in the DNA molecule plays a vital role in DNA bio-sensors31in terms of enhancing the biosensor performance for distinguishing alterations, the suggested approach pro-vided a considerably high selectivity for DNA biosensing.
Fig. 6a shows the SEM image of the fabricated microtoroid (∼110 μm in diameter). The scheme for the surface engineer-ing is shown step by step in Fig. 6b. For a selective sengineer-ingle base pair DNA detection, the APTES and TMMS functionalised silica microtoroid surface was modified to ob-tain NHS esters via amine groups of the APTES molecules. While the amine groups were sequentially converted to
car-boxylates and NHS esters, the TMMS molecules remained the same on the surface and served as spacers to avoid steric ef-fects which decrease the efficiency of the DNA hybridisation.68,69 Covalent conjugation of the amino-modified ssDNA probes (Fig. 6b, red coils) was achieved via NHS-esters and the residual NHS esters were capped using ethanolamine, which resulted in a negatively charged micro-toroid surface. Fig. 6c shows resonance wavelength shifts due to fully complementary (red data), point mismatched (blue data) and non-complementary ssDNA strands (grey data) of a 13-mer ssDNA probe in real time. Considerably late and slow responses were obtained from the point mismatch DNA and probe–DNA interactions as compared to the shifts (pm) ob-served in the complementary and probe–DNA interactions. Due to the fact that the surface had a negative overall charge, the repulsive forces occurring on the surface provided a high se-lectivity in terms of discriminating the single point alterations in Pseudomonas aeruginosa related oligonucleotide sequences. The LOD and surface coverage ratio of the captured targets to the attached probes were 2.32 nM and 0.84, respectively.
As one of the prominent examples of the optical microresonator-based DNA detection scheme, a work of M. D. Baaske and co-workers23 can be given, in which they
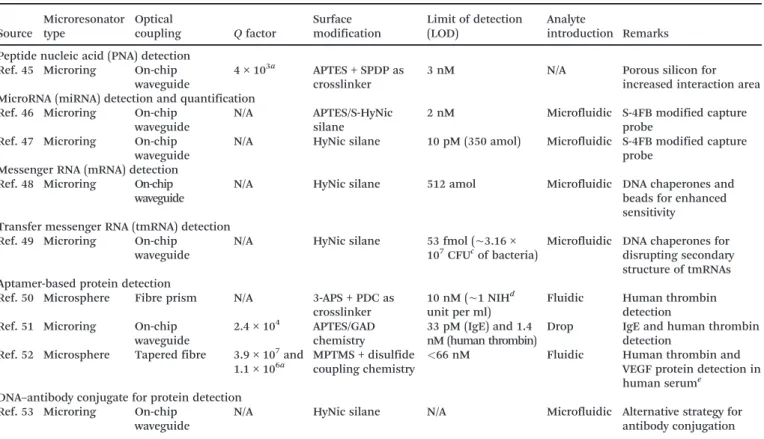
Table 1 (continued) Source Microresonator type Optical coupling Q factor Surface modification Limit of detection (LOD) Analyte introduction Remarks Peptide nucleic acid (PNA) detection
Ref. 45 Microring On-chip waveguide
4× 10³a APTES + SPDP as
crosslinker
3 nM N/A Porous silicon for
increased interaction area MicroRNA (miRNA) detection and quantification
Ref. 46 Microring On-chip waveguide
N/A APTES/S-HyNic
silane
2 nM Microfluidic S-4FB modified capture
probe Ref. 47 Microring On-chip
waveguide
N/A HyNic silane 10 pM (350 amol) Microfluidic S-4FB modified capture probe
Messenger RNA (mRNA) detection Ref. 48 Microring On-chip
waveguide
N/A HyNic silane 512 amol Microfluidic DNA chaperones and
beads for enhanced sensitivity
Transfer messenger RNA (tmRNA) detection Ref. 49 Microring On-chip
waveguide
N/A HyNic silane 53 fmol (∼3.16 ×
107CFUcof bacteria)
Microfluidic DNA chaperones for disrupting secondary structure of tmRNAs Aptamer-based protein detection
Ref. 50 Microsphere Fibre prism N/A 3-APS + PDC as
crosslinker
10 nM (∼1 NIHd
unit per ml)
Fluidic Human thrombin
detection Ref. 51 Microring On-chip
waveguide
2.4× 10⁴ APTES/GAD chemistry
33 pM (IgE) and 1.4 nM (human thrombin)
Drop IgE and human thrombin
detection Ref. 52 Microsphere Tapered fibre 3.9× 10⁷and
1.1× 10⁶a
MPTMS + disulfide coupling chemistry
<66 nM Fluidic Human thrombin and
VEGF protein detection in human serume
DNA–antibody conjugate for protein detection Ref. 53 Microring On-chip
waveguide
N/A HyNic silane N/A Microfluidic Alternative strategy for
antibody conjugation
aQ value measured in aqueous environment.bNot available.cColony forming units.d1 NIH is equivalent to 1.1 to 1.3 international units (IU)
thrombin.54 eDiluted serum. Abbreviations: HF: hydrogen fluoride, HyNic: 3-N-((6-N′-isopropylidene hydrazino) nicotinamide) propyl triethoxy
silane, APTES: 3-aminopropyltriethoxysilane, TMMS: trimethylmethoxysilane, EDC: 1-ethyl-3-(3-dimethylaminopropyl)carbodiimide, NHS: N-hydroxysuccinimide, CTAB: cethyltrimethyl ammonium bromide, GPTMS: 3-glycidoxypropylmethyldiethoxysilane,3-APS: 3-amino-propyltrimethoxysilane, DMA: dimethyl adipimidate, GAD: glutaraldehyde, ABCR: 11-azidoundecyl triethoxysilane, MBD-2: methyl binding protein, SPDP: succinimidyl 3-(2-pyridyldithio) propionate, S-HyNic: succinimidyl 5-hydrazinonicotinate acetone hydrazone, PDC: 1,4-phenylene diissothio-cyanate, IgE: immunoglobulin E, MPTMS: 3-mercaptopropyl trimethoxy silane, VEGF: vascular endothelial growth factor.
presented single nucleic acid detections using plasmonic nanorods adsorbed on silica microspheres (Fig. 7). Micro-spheres as optical resonators (Fig. 7a) are promising and sen-sitive tools for observing DNA–DNA interactions due to their high Q factors. However, lowering their detection limits down to single nucleic acids requires integration of the optical microresonators with plasmonic nanoparticles, which en-hances the optical field strength at the microresonator sur-face.23,70Once the intensity of the surface plasmon resonance absorption increases, enhancement of the electric field is obtained. Gold and silver have a mean free path of∼50 nm, hence when their sizes are smaller than∼50 nm, only inter-actions with the surface are allowed since bulk interinter-actions are not possible. The surface plasmon resonance condition is satisfied when the wavelength of light is much larger than the size of the nanoparticle and it depends on the size, shape and dielectric constants of the metal and surrounding mate-rial.71 It was reported in the above-mentioned study23 that gold nanorod (∼12 nm × 12 nm × 42 nm) was chosen as the plasmonic nanoparticle because it provided strong field enhancements.
Thiol-functionalised oligonucleotides as receptors were co-valently conjugated to CTAB stabilised gold nanorods follow-ing adsorption of the nanoparticles onto the microresonator surface. The optical measurements for observing nucleic acid kinetics were taken in a PDMS cell where target flow and the microsphere took place (Fig. 7b). The light from a continu-ously swept tuneable laser (∼780 nm) was coupled to the
microresonator via a prism coupler (Fig. 7b). It is noteworthy that the prism coupler is thoroughly helpful during the bio-sensing measurements as compared to the tapered optical fi-bres. It is important here to note that it is quite possible dur-ing a biosensdur-ing measurement, which is performed usdur-ing a tapered fibre, to easily lose the transmission obtained from the fibre due to adsorption of the molecules in the tapered region, especially in concentrated measurement buffers. An-other possibility, which is commonly encountered while using the tapered fibres, is that the changing coupling dis-tance between the fibre and the microresonator can easily result in experimental errors. Such errors, for instance, can be avoided using UV-curable epoxy droplets by fixing the fi-bre from two sides.34 However, fixing the fibre without los-ing the fibre transmission and breaklos-ing it is a challenglos-ing task. However, in the case of a prism coupler all these diffi-culties are avoided.
Fig. 5 Distinguishing the SNPs via real-time kinetic desorption using arrays of silicon microrings. (a) Schematic drawing showing hybridisation and dissociation between probe ssDNAs (blue strands) and complementary ssDNAs (red strands). (b) An observed blue WGM shift (Δλ) due to the desorption of the targets from the biosensor sur-face. (c) Hybridisation and desorption responses obtained from the ssDNA probe having microrings exposed to fully complementary coun-terparts and targets having SNPs at 3 different positions. Pure buffer was infused at time = 20 min. Adapted from ref. 33 with permission. Fig. 4 DNA detection using a label-free microsphere integrated with a
DNA catalytic network. (a) A micrograph of a microsphere (∼300 μm in diameter), (b) the surface modification approach providing DNA load-ing/unloading (S and B molecules) with interaction with the DNA probe (P molecule) attached via biotin–streptavidin interactions, and (c) a blue WGM shift (Δλ) in the transmission spectra due to the loading and unloading of the DNA molecules in succession. Adapted from ref. 32 with permission.
Fig. 7c shows the monitored single DNA–DNA interaction kinetics in both the TE and the TM spectra simultaneously. A 22-mer oligonucleotide probe, interacting with its 3 base pair mismatched complementary target on the nanorod surface, caused resonance wavelength shifts (Δλ) in the fm level as spikes (Fig. 7c). Additionally, in this study, the detection of single interactions even down to octamers and small interca-lating molecules was demonstrated. The suggested technique is also promising for biosensing applications integrated with microfluidic systems.
An alternative approach for detecting formed DNA du-plexes with microresonators was demonstrated in the work of R. M. Hawk and co-workers.35 In this study, a microtoroid
(Fig. 8a) was functionalised with GPTMS and then
amino-Fig. 7 Monitoring single molecule DNA interactions using a silica microsphere. (a) Image of a glass microsphere melted from an optical fibre (79 μm in diameter). (b) Schematic drawing showing oligonucleotide interactions on a plasmonic nanorod having a microsphere surface (on the top left corner) and biosensing set-up in which optical measurements were taken. A tuneable laser, centred at ∼780 nm, was coupled to the microsphere in a polydimethlysiloxane (PDMS) cell via a prism coupler and transverse electric (TE) and trans-verse magnetic (TM) spectra were recorded using a polarising beam splitter (PBS) and photodetectors (PDs). (c) Recorded resonance wave-length shifts (Δλ) for TE and TM modes, simultaneously, due to interac-tions of 22-mer oligonucleotide probes with their three base pair mismatched complementary targets. Adapted from ref. 23 with permission.
Fig. 8 Real-time and fluorescence detection of DNA hybridisation using a microtoroid with a functionalised surface. (a) Scanning electron micrograph of the fabricated microtoroid. (b) The biosensing set-up shows a fibre coupled spectrograph and a microtoroid. (c) The biosen-sor response to Cy5-labelled ssDNA targets is shown as a red line while the black line shows a case without the targets present. (d) The data show the response of the biosensor to unsuccessful (higher peak) and successful (lower peak) DNA hybridisations at 670 nm. Adapted from ref. 35 with permission.
Fig. 6 Real-time and selective detection of single base pair alterations in the DNA molecules using surface engineered microtoroids. (a) Scanning Electron Microscopy (SEM) image of a fabricated microtoroid. (b) Step-by-step surface engineering of the microtoroid surface: APTES/TMMS silanization (1), succinic anhydride incubation in dimethylformamide (DMF) (2), EDC/NHS incubation in DMF to form NHS esters (3), ssDNA conjugation (red coils) to the formed NHS-esters (4) and capping of the residual NHS NHS-esters with ethanolamine (5). (c) Real-time WGM shifts (pm) due to fully complementary (red data), point mismatched (blue data) and non-complementary ssDNA strands (grey data) of the 13-mer ssDNA probe. Scale is 20 μm. Adapted from ref. 34 with permission.
modified 20-mer ssDNA probes were covalently conjugated to the microtoroid surface. The hybridisation between the probes and their cyanine (Cy5)-labelled counterparts was detected by a spectrograph (Fig. 8b). Fig. 8c shows the bio-sensor responses with and without 2μM Cy5 labelled ssDNA targets present due to the excitement of the Cy5 fluorophore by the evanescent field. Fig. 8d shows transient and perma-nent peaks at 670 nm arising from unsuccessful and success-ful DNA hybridisations on the surface of the microtoroid, re-spectively. The study proposed a fluorescence-based DNA hybridisation technique in real time with detection of the tar-get ssDNAs down to 1 nM.
Another approach for DNA sensing is through the use of OFRRs or liquid core optical ring resonators (LCORRs), which are suitable platforms for sensitive DNA detection and quan-tification.72The OFRRs offer ring resonator-based biosensing combined with microfluidics technology. The principle of the WGM-based DNA sensing using an OFRR is schematically shown in Fig. 9. A shift in the WGM mode can be observed with a refractive index change at near surface as the target ssDNAs hybridising with their probe counterparts attached on the inner surface of the OFRR during sample flow.
J. D. Suter and co-workers36 used an OFRR or LCORR coupled to a tapered fibre (1550 nm) to show the DNA hybridisation with targets having different target lengths (25– 100 bases) and the biosensor was able to distinguish base pair mismatches (from 1 to 5). The inner surface of the OFRR was modified with the 3-APS molecules and, using a homo-bifunctional linker DNA, amino modified ssDNA probes were covalently conjugated to the modified inner surface. The LOD of 25-mer DNA samples was given as 2.7× 10¹⁰ mole-cules per cm2. The mass loading limit of detection was reported in the order of 4 pg mm−2, which was closer to the value obtained in the above study.31
Before concluding this section, we would like to advert to DNA detection in complex media using optical resonators. Biodetection in complex media is a challenging task since undesired non-specific interactions can easily occur between the biosensor surface and its surrounding medium, which re-sults in false signals and compromises the selective detection
of target molecules.26 Y. Shin and co-workers37developed a biosensing platform consisting of an array of microrings (with a reference microring for the thermal drifts) for detec-tion of DNA biomarkers related with bladder cancer in hu-man urine (mutated fibroblast growth factor receptor 3 and Harvey RAS genes). The DNA probes modified with an amine group were covalently attached to the APTES/GAD chemistry applied microring surfaces. An enhanced signal in the WGM shift was observed as the probe DNA molecules hybridised with their biomarker counterparts; however, the WGM shifts, due to the non-specific interactions between human urine and the microring surface, could not be eliminated and resulted in WGM shifts lower than the WGM shifts observed due to DNA hybridisation. While measuring in complex me-dia, reducing the spectral shifts arising from non-specific in-teractions can only be achieved by using multifunctional sur-face modification, which enables probe conjugation and protein resistance simultaneously. In recent works,26,73 we demonstrated a multifunctional surface coating which pro-vides a selective biodetection of interleukin-2 antigens in complex media.
2.2 DNA amplification and detection of genetic variations PCR74is the most commonly used nucleic acid amplification technique. However, recombinase polymerase amplification (RPA) is an alternative method to the PCR, which enables DNA amplifications at a low and constant temperature (∼37 °C)75,76contrariwise to the PCR. This isothermal method
pro-vides enzyme-oriented synthesis77 of the DNA molecules. Also, undesired side products of the PCR, such as primer di-mers, can be reduced by using the RPA technique.39In a con-secutive manner, the RPA process is performed by three en-zymes: recombinase, ssDNA binding protein and polymerase. The recombinase forms a complex in between a template double stranded DNA (dsDNA) and its opposing primer parts and expedites the strand exchange at cognate sites (Fig. 10, (1) and (2)). Stabilisation of the structures is done by the ssDNA binding proteins which prevent branch migration75 (Fig. 10, (3) and (4)). Lastly, DNA elongation is performed by the strand displacing polymerase to end the RPA process (Fig. 10, (4) and (5)).
Combining the RPA technique in the solid-phase with an optical microresonator having a biosensor array is an emerg-ing field, which enables real-time and specific DNA detection by providing rapid DNA amplification in a small working vol-ume. For this purpose, J. S. del Rio and co-workers38 devel-oped a biosensor platform consisting of arrays of label-free microrings to perform solid-phase RPA (SP-RPA) of the DNA molecules.
As shown in Fig. 11a, the fabricated biosensor chip had 8 columns of 4 pairs of microrings. 4 microfluidic channels having 6 pairs of functionalised and 2 pairs of non-functionalised microrings as blank controls addressed a total of 8 pairs on the biosensor chip. Collected light at input opti-cal couplers was directed through waveguides in order to be
Fig. 9 An OFRR or a liquid core optical ring resonator (LCORR). WGM mode is supported within the circular cross section of the OFFR and evanescent sensing of the target ssDNAs occurs within the probe ssDNAs conjugated onto the hollow core during sample flow.72 Adapted from ref. 36 with permission.
coupled to the microrings, and the resonance wavelength shift data was gathered from output optical couplers. To functionalise the surface, covalent conjugation of hexynyl ter-minated ssDNA probes to ABCR modified microrings was achieved via a click chemistry reaction. Detection of pathogen Francisella tularensis related dsDNA was done with the micro-rings having F. tularensis forward primers.
Fig. 11b shows responses of the microrings to different analyte concentrations due to hybridisation of 25-mer ssDNA targets. Two representative microrings showed significant re-sponses to the target ssDNA infusion. The functionalised microring (blue data) for a specific ssDNA detection revealed significant wavelength shifts while the control microring (red data), functionalised with a poly30T back filler, showed re-sponses only in the order of background noise to varied con-centrations of the ssDNA target solution. Also, the biosensor showed no significant response to unspecific ssDNA targets, proving the ability of the biosensor in terms of selectivity. Withal, the method suggested a rapid DNA amplification time (40 min) with a low LOD (2 fgμl−1) level while the LODs in the standard RPA and the conventional/real-time PCR tech-niques were reported in the order of pgμl−1levels.38,39
Y. Shin and co-workers39 suggested a label-free, multiplexed DNA amplification platform with faster times (20–30 min) as compared to the above study. In order to de-tect single point mutations in the Harvey RAS (HRAS) gene, they fabricated an isothermal solid-phase amplification/de-tection (ISAD) device consisting of APTES/GAD chemistry ap-plied microrings. The LOD was reported as 500 fg μl−1 for this study.
2.3 Detecting methylated DNA and its oxidised derivative DNA methylation is an epigenetic modification which results in a 5-methylcytosine (5mC) molecule via covalent
modifica-tion of the fifth carbon in the DNA base cytosine (Fig. 12a and b).78The DNA methylation can be presented in CG, CHG and CHH sequences where H can be A, T or C.79 Without any sequence change, via a chemical modification, DNA methylation can alter the function of the DNA molecule. For instance, it has been revealed that DNA methylation plays essential roles in various cellular processes80such as develop-ment and regulation in gene expression (i.e., gene silencing in eukaryotic cells).79,81–84 Expectedly, abnormal methylation processes occurring in the chemical structure of the DNA molecule have a relationship with numerous diseases.80,85 Recent studies have also shown that oxidation of the 5mCs by enzymes like human ten-eleven translocation 1 (TET1)86 leads to 5mC derivatives such as 5-hydroxymethylcytosine (5hmC) which was first found in mammalian genomic DNA87 in 1972.88Like the 5mCs, the 5hmCs are also known to be in-volved in embryonic development as well as many diseases.84 Additionally, methylated DNA molecules are also known as biomarkers for cancer.89
Bisulfite sequencing is the most widely used method for analysing DNA methylation by converting non-methylated cy-tosines to uracils selectively while keeping methylated cyto-sines unchanged.42,90,91Among techniques based on bisulfite conversion for methylated DNA detection, methylation-specific (MS) PCR92 is the most commonly used method.41 Despite the fact that MS PCR is widely used, alternative
Fig. 11 The SP-RPA of DNA using label-free microring arrays. (a) Schematic drawing of the biosensor chip having arrays of microrings (8 columns of 4 pairs). (b) Real-time, relative wavelength shifts (nm) due to hybridisation of 25-mer ssDNA at different concentrations (blue data) and the sensor response of the reference microrings (red data). The magnitudes of initial transient slopes are given in nm min−1, indi-cated with an arrow. The decay in the wavelength shifts was observed due to regeneration of the probes. Adapted from ref. 38 with permission.
Fig. 10 The RPA process in the solid phase. The recombinase proteins form a complex between forward/reverse primers and the template dsDNA (1), the recombinase proteins scan the dsDNA for cognate sites (2), strand displacement occurs while the structures are stabilised by ssDNA binding proteins (3), and DNA amplification is done by polymerase ((4) and (5)). Adapted from ref. 38 with permission.
detection techniques have also been suggested due to the complexity and long analysis time of the MS PCR.41,42For in-stance, Y. Shin and co-workers40 showed the detection of DNA methylation biomarkers, RARβ (Retinoic acid receptor β),93–95 DAPK (Death-associated protein kinase)96,97 and
E-cadherin (epithelial E-cadherin)93,98genes since their included DNA methylation patterns are well known in human cancer including bladder cancer. Microring arrays, each containing 4 rings (3 measurement rings and 1 reference ring to control thermal drifts), were fabricated for this purpose. Probes hav-ing either methylated cytosine or unmethylated thymine were covalently conjugated to APTES/GAD chemistry applied microrings. Using the surface modified microresonators pro-vided real-time analysis and discrimination of methylated and unmethylated DNA targets following the bisulfite conver-sion of the targets. However, as the authors also indicated, for such an approach, a compact biosensor chip having microfluidic channels and sequential process steps were re-quired to reduce the process time.
Later on, J. Yoon and co-workers41 suggested a practical on-chip platform to analyse the methylation status of DNA in real time based on the former approach.40Fig. 13a shows the fabricated biosensor chip consisting of a pre-processing mod-ule for the bisulfite conversion (red micro-channels) and a detection module for analysis of the DNA methylation (blue micro-channels). The methylation status of DNA, obtained from a cancer-related epithelial cell line (RARβ93–95gene as a common human DNA methylation biomarker), was detected
by methyl-specific or unmethyl-specific primers conjugated to biosensor chips following the bisulfite conversion of the DNA targets (Fig. 13b). The suggested idea provided amplification of the methylated DNA strands and specific detection down to 0% in terms of target concentration (Fig. 13c, blue data varying from light to dark blue) in a mixture containing methylated and unmethylated DNA strands. The response of the biosensor system showed a significant non-specific reso-nant wavelength shift, probably due to relatively poor dis-crimination of the used DNA probes against the targets.
As a similar approach to the former work,41T. Y. Lee and co-workers42 developed a flexible and on-chip biosensing
Fig. 13 On-chip device for real-time DNA methylation analysis. (a) Fabricated biosensor chip having a pre-processing chamber for bisul-fite conversion (red micro-channels) and a detection chamber for the DNA methylation analysis (blue micro-channels) with three inlets (I, II and III) and an outlet (IV). (b) Detection of target DNA strands with methyl-specific or unmethyl-specific primer probe having microrings. (c) Response of the biosensor to the methylated DNA targets in differ-ent percdiffer-entages ranging from 0% to 100% (data from light to dark blue). Also, the response of the biosensor having unmethyl-specific probes is given as a negative control (*100%). Adapted from ref. 41 with permission.
Fig. 12 Chemical modification of a DNA molecule by methylation via cytosines. (a) The illustrative image shows the crystal structure of a methylated DNA double helix (with sequence ACCGCCGGCGCC) at two reciprocal central cytosines (illustrated by Christoph Bock, Max Planck Institute for Computer Science, Computational Biology and Applied Algorithmics). (b) Chemical structures of the cytosine, methylcytosine and hdroxymethylcytosine molecules.
platform for detection of the methylation status of the RARβ93–95 or HAAO (3-hydroxyanthranilate-3,4-dioxygenase)99 genes as other cancer biomarkers within 65 min. In this work, instead of the bisulfite conversion, methylation specific endonuclease digestion100 was used. Additionally, the fabri-cated biosensor chip consisted of two parts: a modification module in which cleavage of the appropriate sequence sites (CCGG) by the enzymes occurred, and a detection module to understand the methylation status of the targets.
In order to detect the oxidised derivative (5hmC) of the 5mC molecule, R. M. Hawk and co-workers43 used micro-toroids (Fig. 14a) for selective detection of 5mC and 5hmC molecules. In this regard, the anti-5hmCs were covalently conjugated to a GPTMS-coated microtoroid. The measure-ments were taken in a sample chamber having a microtoroid and a tapered silica fibre (765 nm) in 100 μl ofphosphate buffered saline as the measurement solution. Fig. 14b shows the biosensor response to 50 μl min−1 injection of different oligonucleotide targets in varying concentrations. As shown in Fig. 14b, a significant WGM shift was observed due to the 5hmC infusion while lower shifts were also observed in un-methylated cytosine (C) and the 5mC infusions due to possi-ble non-specific binding interactions between the biosensor surface and the targets. The LOD for this study was reported
as 4.2 × 10⁻¹³M with a detection of the 5hmC signal, which was twice that of the 5mC signal.
The OFRRs are also functional platforms for DNA methyla-tion analyses because they provide fluidic integramethyla-tions. J. D. Suter and co-workers44used methyl binding protein (MBD-2) and 5-methylcytidine antibody as probe molecules to detect artificially methylated ssDNA and dsDNA molecules by OFRRs coupled to tapered fibres (1550 nm). Either the MBD-2 or the anti-5-methylcytidine probes was covalently conjugated to a 3-APS-coated inner biosensor surface via DNA as a bi-functional linker. The suggested system was able to discrimi-nate methylated and unmethylated DNA strands. They also reported strong binding affinities of dsDNA and ssDNA to the MBD-2 and the 5-methylcytidine antibody, respectively.
2.4 Detecting peptide nucleic acid (PNA)
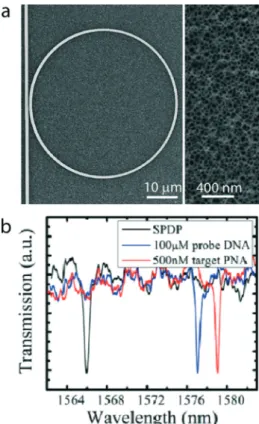
PNAs are artificially synthesized oligomers of peptides which have backbones analogous to the ones that nucleic acids have.101,102The PNAs are more resilient than the DNA probes towards degradation by enzymes, and they can be modified in order to capture DNA strands with high specificity and affinity. In a recent work of G. A. Rodriguez and co-workers,45 interaction between the PNAs and the DNAs was exploited using porous silicon (PSi) ring resonators in the biosensing applications. The fabricated Psi ring resonator coupled to its linear waveguide is shown in Fig. 15a. The PSi ring resona-tors enable a larger area of interaction for the target mole-cules with the sensor surface compared to the surface area limited detection using other types of sensors. The Psi struc-ture was obtained via controlled electrochemical etching of silicon, and a refractive index alteration was created by par-tial thermal oxidation.
The whole surface of the PSi ring resonator was modified with APTES molecules and SPDP was used as a crosslinker to conjugate DNA probes for capturing target PNAs. As shown in Fig. 15b, WGM shifts were observed due to sequential at-tachment of the probe DNAs (100μM) and target PNAs (500 nM) to the SPDP-modified PSi ring resonator surface. The probe DNA attachment to the SPDP-modified ring resonator surface caused a significant WGM shift due to the high probe concentration used. In addition, target PNAs hybridised with the probe DNAs led to an observable WGM shift of 11.10 nm. Moreover, the Q factor of the fabricated PSi ring resona-tors in the buffer was reported to have an order of magnitude of 10,4 while it was one order of magnitude higher in air. This is partially related to the wavelength of the laser (∼1550 nm) used in this work, at which water absorption29in aque-ous media cannot be neglected. Still, the authors reported that the sensitivity for PNA was 3 nM as calculated by 3σ analysis, while directly measured lower concentration was reported as 42 nM. Overall, the authors suggested that the sensitivity of porous silicon microrings could be engineered to be higher than that of the conventional silicon microrings. On the other hand, there are examples of the opposite case, where silicon microrings were shown to have similar
Fig. 14 Detection of the 5mC and 5hmC molecules using 5hmC antibody (anti-5hmCs) conjugated microtoroids. (a) Scanning electron micrograph of a fabricated microtoroid. (b) The response of the biosensor to buffer, unmethylated (C), methylated (5mC) and hydroxymethylated (5hmC) cytosine solutions in varying concentrations (from 1 fM to 1 nM) using a tuneable laser centred at 765 nm. Adapted from ref. 43 with permission.
sensitivities towards oligonucleotides as well, as already men-tioned in this review.33,46
3. Detection of ribonucleic acid (RNA)
3.1 Multiplexed microRNA (miRNA) detection and quantification miRNA, which is a small RNA molecule (containing 19–24 nucleotides46) that does not encode proteins,103 had been first identified as lin-4 (ref. 104) in 1993. However, the func-tion of the miRNAs as regulators was discovered in the early 2000s.105–107These tiny RNA molecules, since then, have been known to possess transcriptional and post-transcriptional roles in gene expression.108The discovery of the regulatory function of the miRNAs has led the way to gathering further knowledge on their roles in biological processes. For instance, miRNAs are known to play profound roles in cellular processes (such as proliferation,109 apoptosis110 and development111). Addi-tionally, they also take part in various diseases such as can-cer,112diabetes,113and cardiovascular,114autoimmune115and neurodegenerative116 diseases. Thus, they are excellent bio-markers for the early detection, diagnosis and prognosis of a disease. Increased or decreased levels of miRNAs in cells can be indicators of many diseases.117 Conventional techniquesfor miRNA detection can be listed as cloning,118Northern blot-ting,119 reverse transcription polymerase chain reaction (RT-PCR)120and microarray120,121analyses. However, many of these techniques require a large amount of samples46and suf-fer from complexities.47,122F. Porichis and co-workers,123 dem-onstrated miRNA detection using fluorescence in situ hybridisation (FISH) technique combined with flow cytometry. Recently, among label-free techniques,124 electrical detection techniques125 based on detecting a change in current due to hybridisation between miRNA and probe, and optical detec-tion techniques125 (label, label-free, spectroscopy and refrac-tive index based) have been suggested to increase the sensitiv-ity of the miRNA detection.
Among optical techniques, the detection of miRNAs using on-chip integrated microring optical resonators provides rapid, robust and multiplexed detections126with considerably high miRNA sensitivities.
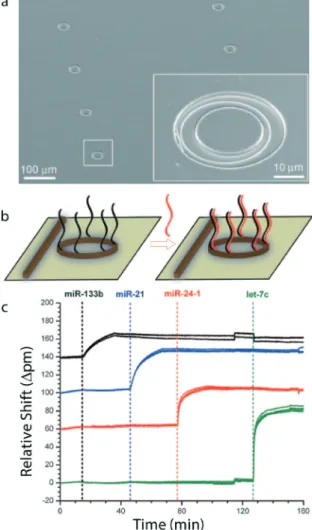
There are two noteworthy examples46,47 of miRNA detec-tion which used microring optical resonators. A. J. Qavi and R. C. Bailey46 reported a multiplexed miRNA detection plat-form using silicon photonic microring resonators. For this purpose, they fabricated sensor chips each containing 32 in-dividual microrings including reference microrings having 30 μm diameter with its adjacent linear waveguide (Fig. 4a). This biosensing platform possessing multiple microrings with sev-eral unmodified microrings, which serve as references, is quite advantageous in terms of data corrections for undesired non-specific interactions and shifts due to thermal and in-strumental fluctuations. For surface modification, the sensor chips were exposed to S-HyNic solution following APTES solu-tion. ssDNA probes (22-mer nucleotides), which reacted with the S-4FB heterobifunctional crosslinker previously, were con-jugated covalently to the modified sensor chip surface. A tuneable laser, centred at 1560 nm, was coupled to the linear, on-chip waveguides and a resonance wavelength was tracked. Target miRNA infusions to the sensor chips were performed in microfluidic flow channels.
Fig. 16b shows a schematic demonstration of hybridisation between target miRNAs (red) and probe ssDNAs (black) which leads to a significant shift (Δpm) in the tracked resonance wavelength. The applicability of the sensor chips to a multiplexed miRNA analysis is demonstrated in Fig. 16c. Four sets of microrings were functionalised with four different fully complementary ssDNA probes, individually. Each modified microring showed a dramatic response to its corresponding target miRNA during the sequential introduction of brain can-cer relevant miRNA targets (miR-133b, miR-21, miR-24-1 and let-7c) through the microfluidic system. Although the miRNA targets had the same length (22-mer nucleotides), variations in the resonance shifts that were observed as they hybridised with their complete counterparts on the biosensor surface (Fig. 16c) remained as an unaddressed issue. In this study, a detection limit of 150 fmol of miRNA was reported and the suggested biosensing mechanism provided a multiplexed quantification of the 4 aforementioned miRNAs. Moreover, an isothermal method was suggested to discriminate single base
Fig. 15 The PSi ring resonator for biosensing applications. (a) An SEM image of the Psi ring resonator (left) with a zoomed image showing the porous structure (right). The porosity was attained by electrochemical methods, while a higher refractive index on the waveguide part was fabricated using thermal oxidation. The oxidised part was then further functionalised. (b) Shifts of the WGMs in the transmission spectra due to sequential attachment of the probe DNAs and the target PNAs to the SPDP functionalised PSi ring resonator. Adapted from ref. 45 with permission.
differences by performing hybridisation in 50% v/v formam-ide solution. Since detecting single base pair variations in an oligonucleotide is a challenging task, the demonstrated miRNA biosensing platform suggests a highly sensitive and selective miRNA detection approach.
Another example of the multiplexed detection of miRNA is the other work of A. J. Qavi and co-workers.47They fabricated sensor substrates each containing 32 addressable microring resonators in the same manner as that in the previous works33,46,126 and S-4FB modified ssDNA probes (22-mer nu-cleotides) were covalently conjugated to Hy-Nic silane-coated sensor substrates. An external cavity laser was used to trace the resonance wavelength. They fabricated laser etched microfluidic channels for analyte infusion.
Fig. 17a shows their miRNA sensing approach in this work. Target miRNAs were infused, using a peristaltic pump, through the microring having fully complementary ssDNAs.
Subsequently, antibody S9.6 (anti-DNA) was harvested from a mouse hybridoma cell line that was able to recognise the formed DNA–RNA heteroduplexes on the surface and was in-troduced to the system following blocking of the microring surface to avoid non-specific interactions. As shown in Fig. 17b, resonance wavelength shifts (Δpm) for 3 separate microrings were observed after anti-DNA infusion following target miRNA infusion. Since anti-DNA binding response was higher than that of the bound miRNAs to the surface, the sys-tem provided an enhanced miRNA detection limit down to 350 amol (10 pM), which is lower than the detection limit reported in the previous study.46
In order to investigate antibody (S9.6) binding kinetics, antibody solutions having the same concentration (2μg ml−1) were infused to the microrings with varied capture probe
Fig. 16 Label-free and multiplexed detection of miRNAs. (a) Scanning electron micrograph of a microring with its linear waveguide (indicated with an arrow), (b) schematic drawing showing target miRNAs (red) captured by ssDNA probes (black) and (c) specific detection using four different miRNAs (miR-133b, miR-21, miR-24-1 and let-7c) on a single chip containing four sets of microrings, each functionalized with dif-ferent ssDNA probes. In between each miRNA infusion, phosphate buffered saline solution was introduced to the system. Adapted from ref. 46 with permission.
Fig. 17 Increasing sensitivity in silicon photonic microring resonators using antibodies. (a) Schematic drawing showing DNA probe modified microring exposed to target miRNA and antibody (S9.6) sequentially. (b) Resonance wavelength shifts (Δpm) from 3 separate microrings due to target miRNA (miR-24-1) and antibody (S9.6) infusion sequentially. (c) Responses of antibody (2 μg ml−1 S9.6) binding to the microrings having varied capture probe concentrations (from 16 nM to 20 μM) while the target miRNA concentrations were kept constant. (d) Data show the applicability of the suggested mechanism to multiplexed miRNA analysis. 2 target DNA functionalised chips were exposed to antibody solution following target infusion (miR-16 and miR-21). Only those having their complementary probe DNA and target miRNA showed a dramatic response due to the antibody infusion. Adapted from ref. 47 with permission.
densities following the miRNA infusions at the same concen-tration (40 nM). As shown in Fig. 17c, the elicited response due to antibody binding increased as the surface probe den-sity increased. On the other hand, as the authors also indi-cated, after a certain surface probe density this increasing be-haviour was not observed since possibly occurring steric effects due to probe crowding on the resonator surface resulted in a decrease in the antibody-binding rate.
Fig. 17d shows a multiplexed platform using this miRNA sensing approach. 2 different sensor arrays (Fig. 17d, each column) were infused by only 1 target miRNA-containing solution and only the microrings having DNA– RNA heteroduplexes elicited a response to the S9.6 infusion. The presented study demonstrates a simple miRNA sensing platform, which enabled real-time and multiple read-out measurements.
3.2 Messenger RNA (mRNA) detection
mRNA is a single-stranded RNA intermediate (between 500 and 10 000 bases), which possesses the complementary se-quence of a DNA strand for representing a protein during the transcription process.127Studies have revealed a relationship between some mRNA expression levels (or mRNA abundance) and diseases,128 e.g. in cancer types like colorectal,129 pros-tate,130breast131and liver diseases.132Hence, as one of the transcriptomic biomarkers, detection of the mRNA molecules is quite critical for the diagnosis, treatment and determina-tion of the stage of different types of diseases.133–136
So far, bulk mRNA detection has commonly been done via microarray137–139 and real-time reverse transcription PCR (RT-PCR)140,141 analyses. Also, a label-free cantilever-array sensor142 was suggested as an mRNA detection platform. However, to detect cell-to-cell mRNA variations,143which can be observed in heterogeneous diseases like cancer, nano-flares144and core–shell nanocomposites135were used rather than the aforementioned bulk mRNA detection techniques, which were reported to be incapable of detecting the alter-ations.135,144 In fixed or living cells, the mRNA levels were obtained using molecular beacons.145,146 Withal, imaging of individual mRNA molecules in fixed cells was achieved using labelled probes.147In another study,123at the single cell level mRNA detection, the FISH technique combined with flow cy-tometry was used. Also, electrochemical-based biodetection techniques148–151can be used for the mRNA detection.
Several optical biodetection152,153 techniques can provide rapid and label-free quantification of the mRNA molecules. As an optical detection technique, J. T. Kindt and co-workers48 suggested silicon photonic microrings as optical microresonators for full-length mRNA quantification in a multiplexed manner with a 512 amol limit of mRNA detec-tion. Likewise in previous works,33,46,47 the S-4FB modified ssDNAs as probe molecules were tethered to the microring surface covalently. Also, the resonance wavelength shift was enhanced by adding short DNA chaperones and submicrometer beads, which improve hybridisation kinetics between the ssDNA probes and the target mRNA molecules.
3.3 Transfer messenger RNA (tmRNA) detection
tmRNA, which is a small molecule encoded by the ssrA gene155 but is different from transfer RNA (tRNA) and ribo-somal RNA (rRNA), was discovered in 1978 (ref. 154) as a new RNA component. This stable RNA piece can be found in many bacteria with a high copy number per cell, Escherichia coli being the most common example.156–158In all eubacteria and some eukaryotic organelles, tmRNAs play critical roles in translational surveillance and ribosome rescue to maintain the protein synthesis capacity of a cell.157,159 The tmRNAs can be used as biomarkers in order to differentiate between bacterial species and genus, since each bacterial strain is known to contain unique regions of sequence.49,158 Addition-ally, viable bacterial populations can be distinguished from non-viable ones using these biomarkers.49,160
Thus far, the tmRNA molecules were used as targets in conventional techniques for several detection purposes such as bacterial identification158or observing tmRNA localisation in bacteria161via fluorescence in situ hybridisation technique, and for pathogen detection using techniques based on nucleic acid sequence-based amplification,162,163 real-time PCR,155 real-time reverse transcription PCR (RT-PCR)164 or surface plasmon resonance.165
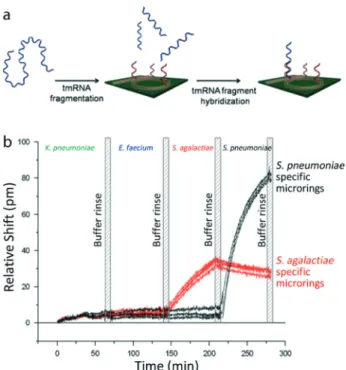
Using photonic microcavities for tmRNA detection, O. Scheler and co-workers49discriminated the tmRNAs for differ-ent bacterial species. For this purpose, they fabricated chips having 32 individually addressed microrings integrated with a microfluidic assembly. An aryl aldehyde moiety having probes related to either S. pneumoniae or S. agalactiae bacteria was co-valently conjugated to a reactive hydrazine group having microrings via hydrazone bonding. The fragmented tmRNA molecules were specifically detected via hybridisation with their probe DNA counterparts (Fig. 18a). However, in this tech-nique, the detection of the tmRNA molecules required a pre-processing of the tmRNA samples via thermal tmRNA denatur-ation with/without a 10-fold excess of chaperones or by chemi-cal tmRNA fragmentation, by which the secondary structures of the tmRNA molecules are disrupted. The obtained WGM shifts (pm) due to the sequential flow of different tmRNAs be-longing to 4 bacteria, K. pneumoniae, E. faecium, S. agalactiae, and S. pneumoniae, are shown (Fig. 18b). The LOD obtained for this study was reported as 53 fmol S. pneumoniae tmRNA, which corresponds to approximately 3.16× 10⁷CFU of bacteria. Although the suggested approach provided rapid and spe-cific detections of different tmRNA species, as the authors also adverted to, the results showed a difference in terms of the WGM shift magnitudes, which was possibly observed due to undesired residual secondary structures of the tmRNA targets following the pre-process.
4. Protein detection using aptamers
and DNA
–antibody conjugates
The use of aptamers instead of antibodies is a recent ap-proach in optical microresonator-based biosensing. The
aptamers specifically recognise molecular patterns with high affinity. The main difference of the aptamers from protein-based antibodies is that they consist of nucleotides rather than amino acid chains, and they are synthesised artificially instead of being produced within living organisms.166 Al-though they have more simple primary structures, i.e. smaller dimensions in terms of length and molecular weight,167the aptamers have successfully been demonstrated to have con-siderable affinity towards their targets, which are mostly pro-teins. Besides, they are more stable than their protein coun-terparts in terms of alterations in their environment and shelf life.168 Their attachment to a silicon/silica surface is practically the same as in the oligonucleotide attachment strategies, which are well known,169and relatively easier than covalent binding of the antibodies. All the aforementioned factors make aptamers convenient for probing biological enti-ties. Yet, their use in optical microresonator-based bio-detection is not abundant. Although being quite promising, there are only a handful of examples regarding their use in this field. In our opinion, the rare use of the aptamers in op-tical microresonator-based biosensing is likely due to the possible difficulties encountered during the optical
measure-ments, rather than the aptamers themselves, which was discussed previously within the text.
The earliest example related to optical aptasensors dates back to 2006, where Zhu and co-workers50 demonstrated human thrombin detection using aptamer-conjugated microspheres.
The experimental set-up used in this work is shown in Fig. 19a. A fibre prism was used to couple light from a 980 nm tuneable laser source to a microsphere, while the laser was controlled via a computer DAQ card. They used 3-APS molecules to coat the microsphere surface via vapour deposi-tion, and PDC as homobifunctional crosslinker to covalently attach amine-modified aptamers. The spectral response of the modified optical microsphere to the increased concentra-tions of thrombin (from 50 nM to 4.34 M) is given in Fig. 19b. Each increased spectral response showed a binding event that occurred between the aptamer and thrombin con-jugates. However, after injection of 3.2 M thrombin, slower responses were obtained, most probably due to almost com-plete probe saturation on the microsphere surface caused by the infused high target concentration. They also reported a sensitivity of 1 NIH unit per ml, which corresponded to a concentration of 10 nM, limited by their spectral resolution of 0.2 pm. The corresponding data are shown in Fig. 19c.
The upper limit for a measurable dynamic range was reported as 5 μM. Yet, specificity seriously limited this dy-namic range, particularly for thrombin, since the thrombin, with concentrations which were higher than 100 nM, was
Fig. 18 Detecting different tmRNA species on a single chip with microrings integrated to a microfluidic assembly. (a) Schematic drawing shows their tmRNA detection approach in this work: the fragmented tmRNAs were hybridised with their probe counterparts attached to the microring surface. (b) Different tmRNAs from 4 bacteria, Klebsiella pneumoniae, Enterococcus faecium, Streptococcus agalactiae, and Streptococcus pneumoniae, were introduced sequentially to the flow chamber. Relative shifts (Δpm) from repeated experiments were obtained due to probe–target tmRNA hybridisation. Black and red data show response of the microrings having S. pneumoniae and S. agalactiae tmRNA specific DNA probes, respectively. In between each target infusion, washing with neat buffer solution was done. Adapted from ref. 49 with permission.
Fig. 19 Thrombin detection using an aptamer conjugated microsphere. (a) Experimental set-up (left). In a fluidic cell, the light from a tuneable diode laser (980 nm) is coupled to the microsphere via a fibre prism coupler (right). The laser was controlled using a com-puter data acquisition (DAQ) card. (b) Increasing concentrations of thrombin were applied and the WGM shifts (pm) were observed. The concentrations were 50 nM, 142 nM, 340 nM, 750 nM, 1.88 M, 2.56 M, 3.2 M, 3.786 M, and 4.34 M, beginning from the second arrow from the left. (c) The WGM shift (pm) regarding the thrombin concentration (NIH per ml) is given. 1 NIH unit corresponds to 10 nM. Adapted from ref. 50 with permission.