IMPROVEMENTS ON PATHWAYMAPPER:
A COLLABORATIVE PATHWAY CURATION
TOOL
a thesis submitted to
the graduate school of engineering and science
of bilkent university
in partial fulfillment of the requirements for
the degree of
master of science
in
computer engineering
By
Leonard Dervishi
July 2018
Improvements on PathwayMapper: A Collaborative Pathway Curation Tool
By Leonard Dervishi July 2018
We certify that we have read this thesis and that in our opinion it is fully adequate, in scope and in quality, as a thesis for the degree of Master of Science.
U˘gur Do˘grus¨oz(Advisor)
Tolga Can
A. Elif Erson Bensan
Approved for the Graduate School of Engineering and Science:
Ezhan Kara¸san
ABSTRACT
IMPROVEMENTS ON PATHWAYMAPPER: A
COLLABORATIVE PATHWAY CURATION TOOL
Leonard Dervishi
M.S. in Computer Engineering Advisor: U˘gur Do˘grus¨oz
July 2018
Information visualization focuses on visually representing abstract data to am-plify human cognition. Graph visualization is one of the most common types in the field of information visualization because of its capabilities to present huge amount of data in a clear and meaningful manner. A graph is a suitable data structure for representing relational information and for this reason graph visu-alization has a wide usage in biological pathway visuvisu-alization as well. In this thesis, we focus on collaborative construction of cancer pathways and visual-ization of cancer genomics data overlaid over such networks. Several biological pathway visualization tools have been developed to help biologists analyze can-cer genomics data, using various formats, including standard formats like SBGN, in the past. Nevertheless, most biologists prefer curated pathway diagrams like the ones featured in The Cancer Genome Atlas (TCGA) manuscripts, using a simpler notation. These pathway diagrams outline the alterations occurring in pathways for different cancer types. To address this need, a web-based tool called PathwayMapper was previously developed. PathwayMapper can be used to view pre-curated cancer pathways or to create new pathways from scratch. It has many features including overlay of genomic alteration data from the cBioPortal. It also includes a collaborative mode so that the users can interactively create and modify the cancer pathways.
With this thesis, we improve PathwayMapper in several ways to make it a more complete and powerful editor with a better user interface. New features include complexity management operations, edge bend support, interactive node resize, and various highlighting capabilities. Furthermore, the user interface has been improved to be more user friendly with the addition of a toolbar.
iv
Keywords: Graph visualization, pathway editor, systems biology, biological path-ways, cancer genomics, pathway curation tool, web-based software.
¨
OZET
ORTAKLAS
¸A YOLAK K ¨
URASYON ARACI
PATHWAYMAPPER’A IYILES
¸TIRMELER
Leonard Dervishi
Bilgisayar M¨uhendisli˘gi, Y¨uksek Lisans Tez Danı¸smanı: U˘gur Do˘grus¨oz
Temmuz 2018
Bilgi g¨orselle¸stirme insan algısını g¨u¸clendirmek i¸cin soyut veriyi g¨orsel olarak sunmaya odaklanır. C¸ izge g¨orselle¸stirme b¨uy¨uk miktarda veriyi anla¸sılır ve an-lamlı bir ¸sekilde sunma becerisinden dolayı bilgi g¨orselle¸stirme alanındaki en yaygın t¨urlerden biridir. C¸ izgeler ili¸skisel bilgiyi sunmak i¸cin uygun bir veri yapısıdır ve bu nedenle ¸cizge g¨orselle¸stirme biyolojik yolak g¨orselle¸stirmede de geni¸s bir kullanıma sahiptir. Bu tez ¸calı¸smasında, kanser yolaklarının ortak ¸calı¸smaya dayalı in¸sasına ve bu t¨ur a˘glar ¨uzerinde bulunan kanser genomik verisinin g¨orselle¸stirmesine odaklanıyoruz. Ge¸cmi¸ste biyologların kanser genomik verisini incelemelerine yardım etmek amacıyla, SBGN gibi standart formatları da kapsayan ¸ce¸sitli formatlar kullanan birka¸c biyolojik yolak g¨orselle¸stirme aracı geli¸stirilmi¸stir. Bununla birlikte, pek ¸cok biyolog daha basit bir g¨osterim kul-lanan The Cancer Genome Atlas (TCGA) taslaklarında yayınkul-lananlara benzer d¨uzenlenmi¸s yolak diyagramlarını tercih ederler. Bu yolak diyagramları farklı kanser t¨urleri i¸cin olan yolaklarda meydana gelen de˘gi¸siklikleri ¨ozetler. Bu gereksinimi kar¸sılamak amacıyla daha ¨onceden PathwayMapper isimli a˘g tabanlı bir ara¸c geli¸stirilmi¸sti. PathwayMapper ¨onceden d¨uzenlenmi¸s kanser yolaklarını g¨ormek ya da yeni yolakları sıfırdan olu¸sturmak i¸cin kullanılabilir. Bu ara¸c cBio-Portal’dan genomik ba¸skala¸sım verisinin y¨uklenmesini de i¸ceren pek ¸cok ¨ozelli˘ge sahiptir. Ayrıca kullanıcıların etkile¸simli ¸sekilde kanser yolakları olu¸sturmalarını ve d¨uzenlemelerini sa˘glamak amacıyla bir ortak ¸calı¸sma modu da i¸cermektedir.
Bu tez ¸calı¸smasında, PathwayMapper’ı daha iyi bir kullanıcı aray¨uz¨u ile bir-likte, daha eksiksiz ve g¨u¸cl¨u bir ara¸c haline getirmek amacıyla bir ka¸c yoldan geli¸stiriyoruz. Yeni ¨ozellikler karma¸sıklık y¨onetimi i¸slemlerini, kenar b¨uk¨um deste˘gini, etkile¸simli k¨o¸se boyutlandırmayı ve ¸ce¸sitli vurgulama imkanlarını i¸cerir. Bunun yanında, ara¸c ¸cubu˘gunun eklenmesiyle aray¨uz daha kullanıcı dostu bir hale
vi
getirilmi¸stir.
Anahtar s¨ozc¨ukler : ¸cizge g¨orselle¸stirme, yolak edit¨or¨u, sistem biyolojisi, biyolojik yolaklar, kanser genomi˘gi, yolak k¨urat¨or aracı, a˘g tabanlı yazılım..
Acknowledgement
Initially I would like to express my sincere gratitude to my supervisor Prof. Dr. U˘gur Do˘grus¨oz for his patient support and guidance during my master studies. His guidance helped me in all the time of research and writing of this thesis. I learned a lot from him and he will be one of the role models in my academic career.
I would like to thank Assoc. Prof. Tolga Can and Assoc. Prof A. Elif Erson Bensan for reviewing and commenting on the manuscript of this thesis.
I would like to thank all of my friends in Bilkent and in Ankara for their great friendship and their continuous support during my graduate studies.
Last but not the least, I must express my very profound gratitude to my parents Afrim and Aishe and my brother Erion for having faith in me and supporting me throughout my life. This accomplishment would not have been possible without them.
Contents
1 Introduction 1
1.1 Motivation . . . 3
1.2 Contribution . . . 3
2 Background Information and Related Work 5 2.1 Graph Visualization . . . 5
2.2 Biological Standards . . . 8
2.3 Related Tools, Libraries, and Resources . . . 10
2.3.1 Cytoscape . . . 10
2.3.2 TCGA . . . 13
2.3.3 BioGene . . . 13
2.3.4 Google Realtime API . . . 14
2.3.5 SBGNViz.js . . . 15
CONTENTS ix
3 PathwayMapper: A Pathway Curation Tool 18
3.1 Visualization of TCGA Pathways . . . 20
3.2 Collaborative Usage . . . 22 3.3 Architecture . . . 24 4 Improvements in PathwayMapper 26 4.1 General Improvements . . . 27 4.2 Complexity Management . . . 34 4.3 User Interface . . . 36 4.4 Collaborative mode . . . 37 5 Conclusion 38 5.1 Future Work . . . 39 5.2 Availability . . . 40
List of Figures
1.1 Textual representation of a biological pathway (Activation of BID and translocation to mitochondria) in Pathway Commons [1] . . . 2
1.2 Visual representation of Activation of BID and translocation to mitochondria in Pathway Commons [2] . . . 2
2.1 A directed (left) and undirected (right) graph with four nodes and four edges connecting nodes to each other. . . 6
2.2 An example compound graph of multiple levels of nesting [3] . . . 6
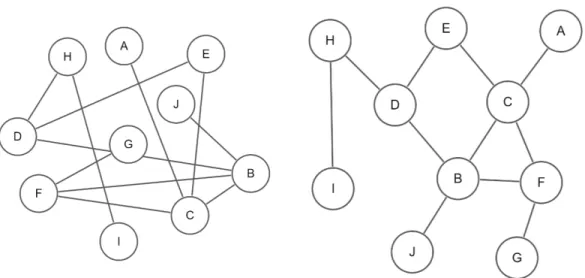
2.3 A sample graph before performing layout (left) and after perform-ing layout (right) . . . 8
2.4 Representation of a simple example of protein phosphorylation cat-alyzed by an enzyme and modulated by an inhibitor in PD (a), ER (b) and AF (c). . . 9
2.5 A metabolic process drawn in SBGN (left) and associated repre-sentation of highlighted part in SBGN-ML (right) . . . 9
2.6 A sample of Cytoscape.js initialization code . . . 12
LIST OF FIGURES xi
2.8 Overview of visualization of gene interaction pathways with
ge-nomic data in cBioPortal [5]. . . 17
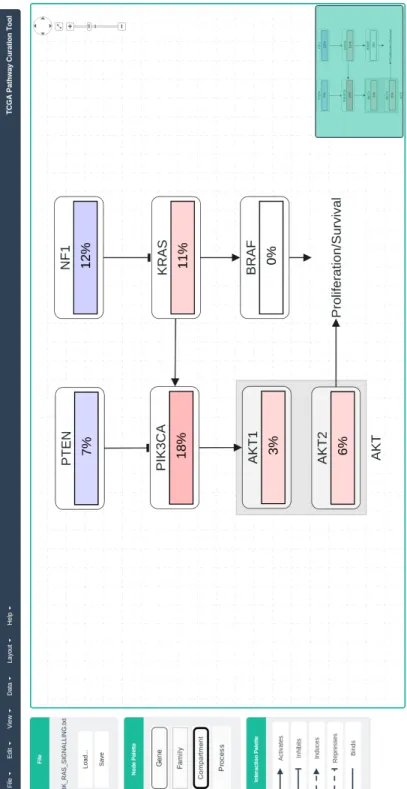
3.1 Visualization of PI3KRAS signalling pathway along with the ge-nomic data by initial version of PathwayMapper. [5] . . . 19
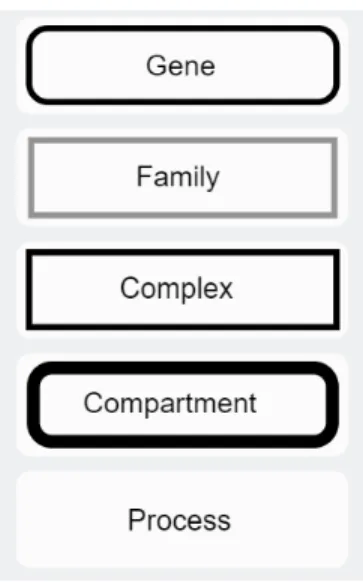
3.2 Node types in PathwayMapper. . . 20
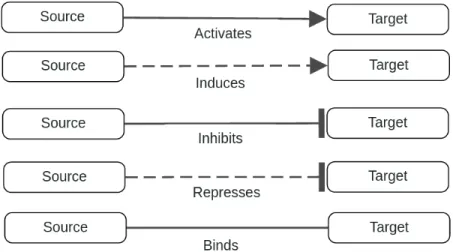
3.3 Edge types in PathwayMapper. . . 21
3.4 Flow of events when new elements are added in collaborative usage mode [5]. . . 23
3.5 High Level Architecture of PathwayMapper [5]. . . 25
4.1 HIPPO pathway visualized in the latest version of PathwayMapper. 26 4.2 Display of node resize and addition of edge bend points features. . 27
4.3 Two sample pathways: (a) without overlaid data and (b) with overlaid genomic data, before and after applying Resize Nodes to Content. . . 28
4.4 When PIK3CA is being dragged, geometric and distribution align-ment guidelines are drawn. . . 29
4.5 Vertical bottom alignment of compound and simple nodes with different dimensions. . . 29
4.6 Gene details dialog. . . 30
4.7 Edge details dialog. . . 30
LIST OF FIGURES xii
4.9 A part of KIRC 2013 RTK RAS PI(3)K pathway visualized in PathwayMapper (up) and associated representation in SIFNX
for-mat (down). . . 32
4.10 Pathway properties dialog. . . 33
4.11 Current file format. . . 33
4.12 A sample pathway (left) and the resulting pathway after applying Hide Selected Nodes (right). . . 34
4.13 Heuristic for calculating location of unhidden neighbors [6]. . . 35
4.14 Main functionalities are placed in toolbar. . . 36
4.15 Shared data model properties. . . 37
5.1 Neuronal muscle signaling pathway before collapsing compartments. 39 5.2 Neuronal muscle signaling pathway with two collapsed compart-ments. . . 40
Chapter 1
Introduction
Information visualization focuses on visually representing abstract data to amplify human cognition. Humans find it much easier to perceive the data when it is expressed in a visual manner. It allows them to have a clearer insight in their head in order to perceive, understand and analyze various information.
A graph is an abstract structure that represents a set of objects which might be connected by links. The nodes represent the set of objects, while the links in-between represent the relations among these objects. That makes graphs suitable for relational information representation.
As an illustration the same biological pathway is textually represented in Fig-ure 1.1 and visually represented in FigFig-ure 1.2. Graph visualization is widely used for biological pathways since it favors better analysis of the information embedded in pathways.
Figure 1.1: Textual representation of a biological pathway (Activation of BID and translocation to mitochondria) in Pathway Commons [1]
Figure 1.2: Visual representation of Activation of BID and translocation to mi-tochondria in Pathway Commons [2]
1.1
Motivation
A biological pathway represents a series of actions among molecules in a cell that may lead to a certain product or a significant change in a cell [7]. It might trigger production of new fat or protein molecules. Pathways can affect activa-tion/deactivation of the genes and transferring of a cell. Some biological pathways are part of the regulation of gene expressions and they have a vital role in stud-ies about genomics. Biological pathways contain important information about biological processes in molecular level. Pathways are considered as abstractions of biological concepts and developing software to work on pathway networks can help the biologists in their research.
Visualization of cancer related biological pathways and collaborative analysis of the overlaid genomics data might assist the biologists in understanding poten-tial sources for certain disease conditions. A good amount of cancer genomics data can be accessed through the TCGA project [8]. With wide availability of cancer pathways and associated overlaid genomic data, the need for an effective visualization and complexity management emerges.
1.2
Contribution
A web-based software called TCGA Pathway Curation Tool [5], which was later named PathwayMapper [9], was previously developed to visualize, interactively edit, import/export biological cancer pathways with facilities to overlay cancer genomics information on the pathways.
Within this thesis, we constructed a new version of this tool improved as follows:
• Complexity management operations hide and show were implemented to reduce complexity of pathways while maintaining user’s mental map.
• Highlighting capabilities which include highlight of invalid genes and high-light of the genes selected by the user were introduced.
• Supports alignment of the nodes in both horizontal and vertical direction, using a grid and alignment guidelines.
• Supports edge bends, including interactive editing of edge bends (from Cy-toscape.js extension cytoscape-edge-bend-editing [10]).
• Supports node resize, including resizing simple nodes and compounds by using handles (from Cytoscape.js extension cytoscape-node-resize [11]). • Supports grid and guidelines, including displaying grid or guidelines during
drag for better manual alignment of nodes (from Cytoscape.js extension cytoscape-grid-guide [12]).
• A crucial feature for this software is undo/redo support for every operation done by the user.
• New TCGA pathway templates from The PanCanAtlas project [13] were added to PathwayMapper.
• For any newly created pathways, we now allow changing the title and giving a description of that pathway.
• Support for exporting an image in SVG format which has the advantage of being scaled to whatever size without losing quality and is easily integrated with other W3C standards.
• Support for exporting the text in SIFNX format which is widely used for biological pathways.
• User interface improvements such as addition of toolbar and tooltips are done in order to make PathwayMapper easier to be used.
• It provides backward compatibility which means that the pathways created with the previous version can be used with the new version as well.
Chapter 2
Background Information and
Related Work
This chapter focuses on background information and related work.
2.1
Graph Visualization
A graph G = (V, E) consists of a finite set of vertices (nodes) V connected by a set of edges E. If the edges of a graph are not oriented, the graph is called an undirected graph. In an undirected graph the edge ab is identical to the edge ba where a, b ∈ V . On the other hand, if the edges are oriented that is called a directed graph and edges ab and ba are considered different (Figure 2.1). Undi-rected edges are typically found in protein-protein interaction networks (PPINs) while directed edges are found in metabolic or gene regulation networks.
Figure 2.1: A directed (left) and undirected (right) graph with four nodes and four edges connecting nodes to each other.
A compound node is the type of node which contains other nodes inside itself. The nodes inside are called children nodes while the node containing them is called parent node. A compound graph is a graph which contain at least one compound node. If children nodes are also parent nodes it creates multiple nesting levels (Figure 2.2).
A graph is suitable for representing relational information. The size of under-lying information in a graph has been constantly increasing and there comes the need for effective graph visualization to represent the data in a clear and mean-ingful manner to stimulate analysis and comprehension. Graph visualization has a wide use in biological and social networks.
To have an effective graph visualization various geometrical properties come into play. All visual attributes such as location of nodes, shape, width and height affect on how the graph is perceived by the analysts. Graph layout is also a crucial part of the visualization process. It is expected that after a layout is performed the graph should be aesthetically pleasing (Figure 2.3). There is not a fixed standard to measure how good a graph layout performs, but there are some general criteria taken in consideration such as:
• Efficient space utilization where the nodes are evenly distributed
• Uniform edge lengths
• Minimal edge crossings
• Avoiding bends in edges
Figure 2.3: A sample graph before performing layout (left) and after performing layout (right)
2.2
Biological Standards
Biological Pathway Exchange (BioPAX) [14] provides a standard language for representing biological pathways at molecular and cellular level. The enormous research done in bioinformatics area by different communities produced a vast amount of data which was stored inconsistently in different databases. The aim of BioPAX to remove format barriers from exchanging pathway data between various databases with different formats was proven to be successful. As a re-sult huge amount of biological pathway data is available across platforms to be visualized and analyzed.
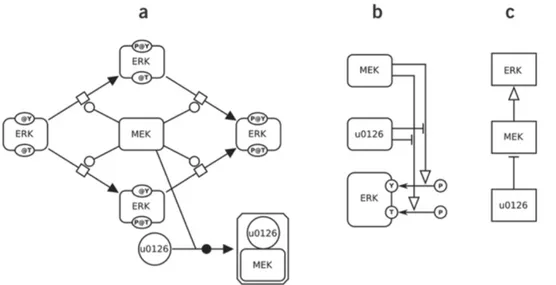
The Systems Biology Graphical Notation (SBGN) [15] is the standardization of graphical representation languages for biochemical processes and interactions. It aims the exchange and reuse of data about signaling pathways and gene regulatory networks. SBGN consists of three languages representing different aspects of biological processes: Process Descriptions (PD), Entity Relationships (ER) and Activity Flows (AF). They allow the biologists to represent biochemical processes and interactions in three alternative projections (Figure 2.4).
Figure 2.4: Representation of a simple example of protein phosphorylation cat-alyzed by an enzyme and modulated by an inhibitor in PD (a), ER (b) and AF (c).
Even though SBGN offers a standard representation of biochemical processes and interactions there is also the need for a unified model to store and exchange the pathways. As a solution to this problem, SBGN-ML, a dedicated XML-based file format, was developed. SBGNML format supports all SBGN entities and auxilary units (Figure 2.5).
Figure 2.5: A metabolic process drawn in SBGN (left) and associated represen-tation of highlighted part in SBGN-ML (right)
2.3
Related Tools, Libraries, and Resources
2.3.1
Cytoscape
Cytoscape [16] is a software platform focused on graph visualization area. Amongst others Cytoscape platform includes graph visualization software such as Cytoscape, CytoscapeW eb, and Cytoscape.js.
Cytoscape [17] is a desktop application which was initially used in biological research but currently it is being used as a general platform for graph visualization and analysis. Its core provides sets of features for data integration, visualization and analysis.
CytoscapeW eb [18] was modelled as a web-based version of Cytoscape to be used network visualization and analysis. It is a reusable component which sup-ports embedding networks within HTML docs by using its JavaScript API. Cy-toscape Web is not being maintained any more and its successor is CyCy-toscape.js.
Cytoscape.js [19] is a plain JavaScript library for graph visualization on web and includes new features for network analysis. What makes Cytoscape.js suitable for both client and server side is that it can run headlessly or as a component in HTML5 canvas.
Cytoscape.js lets you to display and alter interactive graphs. Its interactive features include selecting and unselecting elements, moving nodes, panning and zooming. Cytoscape.js makes possible visualization and editing of graphs in desk-top and touch enabled browsers. It also supports different type of graphs such as directed, undirected, compound, mixed graphs etc.
The two main components in the architecture of Cytoscapje.js are core and collection. The core is the entry point to the Cytoscape.js library where the developer can perform various operations on graph. It also provides functions which aid in accessing elements of the graph. Each of these functions returns a collection which is a set of elements itself. Functions in Cytoscape.js also assist
the developer to perform different operations on collection, filter it or get data about elements part of the collection.
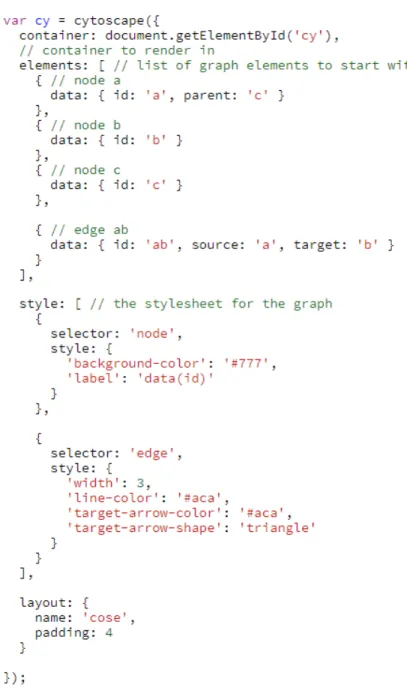
Its simple interface facilitates integration of Cytoscape.js to any web applica-tion. Cytoscape.js is initialized on a Document Object Model (DOM) element and it supports JSON format which makes it suitable to include graph elements, particular style of the graph, layout options and other meta options (Figure 2.6).
2.3.2
TCGA
There are more than 200 types of cancer and each of them is caused by various errors in DNA which causes the cells to act in an unexpected behaviour. Identi-fying the common alterations that are done in certain DNA fragments of cancer cells can be beneficial in terms of early detection and preventing cancer.
The Cancer Genome Atlas (TCGA) [20] is a collaborative effort between Na-tional Cancer Institute (NCI) and the NaNa-tional Human Genome Research Insti-tute (NHGRI). Its dataset provides more than two petabytes of genomic data which aids the community in diagnosing, preventing or treating cancer. The data includes information about genomic alteration of 33 different types of cancer. Its aim is to categorize which genetic mutations are responsible for every type of cancer and its methodology includes usage of genome sequencing and bioin-formatics. Sequencing is done in genome characterization centers (GCCs) while bioinformatic analysis is done in genome data analysis centers (GDACs) [21]. A large number of samples is being analyzed for each type of cancer and overlying of TCGA data over biological pathways aids researchers in analyzing the data in a more efficient way.
2.3.3
BioGene
Biogene [22] is a web service which allows researchers to make queries about certain genes. The information that it returns includes gene summary, its alieses, chromosome location of that gene and gene ID. It uses Entrez Gene database which is maintained by NCBI [23].
2.3.4
Google Realtime API
Google Realtime API [24] provide collaborative service for files stored in Google Drive. The API is a JavaScript library which serves for accessing objects, methods or events and is used in collaborative applications.
The Realtime API allows the developer to create a shared data model similar to the one that can be created locally. It offers data structures such as objects, lists, maps and even custom JavaScript types. When a user makes changes to the shared data model, then that change is reflected globally to all the other users accessing it. The way data model objects work is similar with the one created locally but with the difference that when a change is done in the shared model, the other users should attach listeners to the collaborative document in order to get the changes to their model as well.
Google Realtime API is the collaboration technology used in Google Docs. When a collaborative data model is changed then the local copy of the document is also modified and the API sends the change called ’mutation’ to the shared data model. After the shared data model is synchronized, the data model of other collaborators is changed and consequently their local copy as well.
The Realtime API supports automatic conflict resolution and this is due to the design of ’mutations’. The data models amongst collaborators are eventually consistent which means that when the users stop editing they are expected to see the same outcome. The applications where Realtime API has a wide usage are the ones that need multiple users to edit the same data concurrently. For that reason Google Reatime API is used in PathwayMapper to provide collaborative construction and editing of TCGA pathways.
2.3.5
SBGNViz.js
SBGNViz.js is a web-based visualization tool based on Cytoscape.js written in JavaScript. It is used for Process Description (PD) and Activity Flow (AF) in SBGN and it currently supports SBGN-ML formatted pathway models as well. It supports visualization of compound structures such as molecular complexes using nested drawings. SBGNViz allows loading and exporting of pathways in SBGN-ML format, zooming, scrolling, addition/deletion of pathway entities and highlighting of them. It supports automated graph layout and connection with BioGene service to retrieve properties and external references of macromolecules.
Even though Cytoscape.js provides generic shapes such as rectangle, circle etc. they are not enough to represent different SGBN PD or AF entities. Since SBGNViz.js is based on Cytoscape.js it inherits these shapes and by making modification to them it provides specific representation for the SBGN entities. SBGNViz.js also supports bilateral conversion between SBGN-ML and JSON formats for exchanging pathway data. Since Cytoscape.js utilizes JSON format, SBGNViz.js parses the data from SBGN-ML format and creates JSON objects and vice versa occurs for exporting in SBGN-ML. The architecture of SBGNViz.js is illustrated in (Figure 2.7).
2.3.6
cBioPortal
The cBioPortal for Cancer Genomics [25] serves as a visualization and analysis tool, and it is also used for downloading cancer genomics data sets. It reduces filing data from cancer tissues into recognizable genetic, gene expression and pro-teomic events. Large-scale cancer genomics projects, such as The Cancer Genome Atlas (TCGA) and other cancer genomics projects generate a huge amout of of cancer genomics data making it difficult to perform exploration, integration of data and analytics.
Figure 2.7: Architecture of SBGNViz.js [4].
The portal allows the exploration and analysis of multidimensional cancer ge-nomics data by providing visualization tools across samples, genes and data types. It can visualize patterns of gene alterations across multiple samples for a certain cancer study, provide comparison of gene alteration frequencies across different cancer studies etc. Web interface of cBioPortal facilitates the access to complex genomic profiles for users who are not expert in bioinformatics area. Figure 2.8 vi-sualizes the neighborhood pathway of gene set: TP53, MDM2, MDM4, CDKN2A, which is altered in 30 samples, in the context of Adrenocortical Carcinoma study (TCGA, Provisional).
cBioPortal was initally developed at Memorial Sloan Kettering Cancer Center (MSK) [26] but is currently being maintained by multiple institutions which con-sist of MSK, the Dana Farber Cancer Institute [27], Princess Margaret Cancer Centre in Toronto [28], Children’s Hospital of Philadelphia [29], The Hyve in the Netherlands [30], and our research group iVis at Bilkent University in Turkey [31].
Figure 2.8: Overview of visualization of gene interaction pathways with genomic data in cBioPortal [5].
Chapter 3
PathwayMapper: A Pathway
Curation Tool
PathwayMapper is a collaborative visual web editor for cancer pathways and genomic data. It can be used for interactively creating and modifying pathways and view pre-curated cancer pathways with overlaid genomic alteration data. PathwayMapper was specifically developed for curated pathway diagrams like the ones featured in TCGA manuscripts. The tool supports multiple users to collaborate and simultaneously modify pathways by using Google Realtime API, which supports built-in conflict resolution [32].
PathwayMapper, formerly known as The TCGA Pathway Curation Tool, (Fig-ure 3.1) was initially developed by ˙Istemi Bah¸ceci under the supervision of Prof. Dr. U˘gur Do˘grus¨oz, in collaboration with MSKCC.
Figure 3.1: Visualization of PI3KRAS signalling pathway along with the genomic data by initial version of PathwayMapper. [5]
3.1
Visualization of TCGA Pathways
In order to represent occurring entities in TCGA pathways a special graph nota-tion was proposed. As shown in Figure 3.2 according to the proposed notanota-tion node types are:
• Genes: Represented by a single rounded node with thin border.
• Family: Represents gene families and may contain multiple genes within the node.
• Complex: Represents complex entities in biological pathways and is a com-pound node.
• Compartment: A compound node which generally represents a cellular lo-cation in cell.
• Process: Represents a certain part of a pathway whose details are not shown.
As shown in Figure 3.3 edge types are:
• Activates: Target gene is activated from the source gene, denoted by a line with arrow head at its end.
• Induces: Target gene is induced from source gene, denoted by a dashed line with arrow head at its end.
• Inhibits: Target gene is inhibited from source gene, denoted by a line with T-shaped head at its end.
• Represses: Target gene is repressed from source gene, denoted by a dashed line with T-shaped head at its end.
• Binds: Target gene is binded from source gene, denoted by a straight line.
For easy access addition of nodes and edges can be done from ’Node Palette’ and ’Edge Palette’ respectively, both located on the left part of visualization canvas. Nodes can be added by dragging and dropping a node type in canvas. While to perform addition of edges it is firstly needed to click on an edge type in palette to make it in ’selection’ mode. Secondly dragging the mouse from a source node to a target node, creates a new interaction with the specified edge type in-between. To turn off the ’selection’ mode another clicking is need on the edge type in ’Edge Palette’. A longer way was to add them through Edit in menu bar.
Activation and deactivation of genes PathwayMapper also supports genomic data overlay which shows activation and deactivation of genes for one or multiple cancer studies. Activation of a gene is shown by shades of red color, where dark red means that gene is completely activated and bright red shows means that gene is partially activated. Similarly, deactivation of a gene is shown by shades of blue color Figure 3.1.. Overlay of genomic data is done inside the node boundaries of each gene. The tools allows the user to select/unselect which cancer studies data to be overlaid in the curated pathways.
Additionally, PathwayMapper supports import and export of curated path-ways in a simple tab delimited file format, export of the pathpath-ways in JPEG and PNG format, performing of graph layout on currently opened pathway and topol-ogy related operations shown as context menus when right-clicking on canvas or entities.
3.2
Collaborative Usage
PathwayMapper can be used in ’Local’ mode, where the user creates and edits pathways locally, and in ’Collaborative’ mode, where multiple users can access and modify pathways simultaneously. In ’Local’ mode the tool works as a usual web application where the application data is stored locally. The difference in ’Collaborative’ mode is that except local copy of the data, a shared data model is
created which stores the graph topology and data. When a user makes changes to the shared data model, the changes are reflected to every collaborator and their local data is modified accordingly after synchronization (Figure 3.4). Said in more specific terms, a change in the data model triggers callback functions which notify each collaborator to synchronize their online instance with the shared data model. The next action is that the local data such as graph topology, layout properties, overlaid genomic data and other global options like zoom level of each collaborator is updated.
To create a shared pathway, the user needs to authenticate with their Google account since this tool uses Google Realtime service for collaborative usage. When the user authenticates successfully, a shared document which holds the shared data model is created in Google Drive. When a user creates a new collaborative pathway, a unique ID which represents the shared pathway is generated. Such ID is appended to the tool’s URL and anyone visiting generated URL can access the shared pathway in PathwayMapper. From now on anyone making modifications to the pathway will subsequently modify the shared document in Google Drive.
Figure 3.4: Flow of events when new elements are added in collaborative usage mode [5].
3.3
Architecture
PathwayMapper is a web application consisting of both front-end and back-end components (Figure 3.5). At the back-end side there is the Node.js based server side component which performs basic requests, while other operations such as visualization and curation facilities occur in the front-end component. Most of the functionalities are purely developed in JavaScript.
Front-end component of PathwayMapper consists of two main parts itself: ’View Components’ and ’PM Core’. ’View Components’ includes all visible fea-tures related with UI and they provide handlers which are used accordingly in ’PM Core’. On the other hand, ’PM Core’ performs the main operations and includes:
• Core Manager: Provides an interface to connect with the components out-side of the core.
• Cytoscape.js: Used as the core for graph visualization and as a connection port with several Cytoscape.js extension such as ‘CoSE Layout’ used for graph layout.
• Import & Export Manager: Provides functions to convert a simple tab delimited format to JSON format.
• Genomic Data Overlay Manager: Provides functions for retrieving genomic data and rendering them on the pathways.
• Real Time Manager: Used only in ’Collaborative’ mode and provides func-tions to modify the local copy when modificafunc-tions are done to the shared data model and vice versa.
Chapter 4
Improvements in
PathwayMapper
We made several improvements to PathwayMapper in order to make it a more complete and powerful editor with a better User Interface.
4.1
General Improvements
• Node resize
In order to be able to support interactive resize of nodes, we integrated cytoscape.js-node-resize extension [11] into PathwayMapper. We had make certain changes though to have the same support in Collaborative mode. The user is able to resize simple nodes and compounds nodes by using handles, which are placed at the corners of the node and at the middle of the edges as shown in Figure 4.2. There is also the option under Edit → Resize Nodes to Content which comes in handy when the user wants to resize all nodes at once. It removes extra spaces around the text and it takes in consideration when genomic data is overlaid (Figure 4.3).
Figure 4.2: Display of node resize and addition of edge bend points features.
• Edge bend points
Similarly the implementation for addition of bend points was done by integrating cytoscape.js-edge-bend-editing [10] and making the necessary changes for collaborative mode. This new feature enables the user to in-teractively edit (add new ones, remove or relocate existing ones) edge bend points as shown in Figure 4.2. Use of bends often avoids crossing of edges with nodes and serves to have a more aesthetic pathway visualization.
Figure 4.3: Two sample pathways: (a) without overlaid data and (b) with overlaid genomic data, before and after applying Resize Nodes to Content.
• Integration of grid guidelines
PathwayMapper also supports alignment operations by displaying guide-lines as two nodes are aligned and displaying a grid with custom properties such as grid size and color set by the user. The implementation is done by integrating cytoscape.js-grid-guide [12] to PathwayMapper. If the grid is enabled, snap to grid option is set as default (Figure 4.1). In the case when enable guidelines option is checked, snap to geometric and distribution alignment guidelines is set as default (Figure 4.4). Alignment guidelines ap-pear when two nodes’ center or sides are aligned, while distance guidelines appear when three nodes are equally spaced out vertically or horizontally.
Figure 4.4: When PIK3CA is being dragged, geometric and distribution align-ment guidelines are drawn.
• Simple node & compound alignment
Except aligning while dragging, PathwayMapper also facilitates horizontal and vertical alignment of two or more nodes taking as a reference the first selected node (Figure 4.5).
Figure 4.5: Vertical bottom alignment of compound and simple nodes with dif-ferent dimensions.
• Gene details
In addition to the changing of a node’s name, the user can get extra in-formation about a gene by clicking on ”Entrez Gene” button placed below the gene name. If the gene name is valid a dialog with gene’s properties such as gene summary, aliases, description, chromosome location and gene ID appears (Figure 4.6). The application retrieves this data by using Bio-gene web service of cBioPortal [22]. Gene ID is a hyperlink to the NCBI database where the user can get more information about the gene..
Figure 4.6: Gene details dialog. Figure 4.7: Edge details dialog.
• Interaction labels
Additionally PathwayMapper supports interaction labels and additions of PubMed ID representing what edge perform/produces. The user can enter multiple PubMed IDs which are listed at bottom of the interaction dialog. These are hyperlinks which redirect the user to the publication in NCBI database with the specific PubMed ID (Figure 4.7).
• Highlighting capabilities
There are two type of highlighting available in PathwayMapper: invalid gene highlight and custom highlight both done under Highlight menu which helps the user to mark certain genes in the pathway. Invalid gene highlight is done for all genes in the pathway by clicking on Highlight → Identify Invalid Genes. Regarding the implementation, identifying invalid genes is done by checking each gene individually if it is a part of Biogene database.
Whereas the custom highlight is done by highlighting selected, highlighting neighbors of selected or from gene search. As it can be seen in Figure 4.8 different styles are used for different types of highlights. EGFR gene has the default style for a node in PM, APC is just selected, PTEN has custom highlight, AKT has invalid highlight and GNB2L1 has both invalid and custom highlight.
Figure 4.8: Highlight styles.
• Undo/redo support
Another important feature added to PathwayMapper is the support to undo or redo an action. It applies to all types of operations such as movement of nodes, applying graph layout, changing node dimensions etc.
• PanCanAtlas pathway templates
Previously in PathwayMapper we had some pre-curated pathways under Network → TCGA. In addition multiple curated TCGA pathway templates were added from PanCanAtlas [33]. . These are pathways that were com-piled from the full set of pathway diagrams in the compendium of TCGA manuscripts published between 2008 and 2017, and reviewed by experts. • Export in SIFNX format
PathwayMapper currently provides exporting of pathways in SIFNX for-mat (Figure 4.9) which is similar with the default export but with some changes in noting edges and nodes in the exported file.
Figure 4.9: A part of KIRC 2013 RTK RAS PI(3)K pathway visualized in Path-wayMapper (up) and associated representation in SIFNX format (down).
• Export as SVG
The pathways can currently be exported in SVG format since SVG is pre-ferred by developers. This allows scaling to whatever size without losing quality, and facilitates editing with an SVG editor. SVG is a vector-based graphics represented in XML format and can be easily integrated with other W3C standards.
• Pathway description
Except changing of exported file name, the user is able to add a pathway title and write a short description about it (Figure 4.10). Pathway Proper-ties dialog can be easily accessed from ’Network Palette’ on the left side of canvas.
• Backward Compatibility
Most importantly PathwayMapper is backward compatible. Hence, it al-lows interoperation with the older version, in the sense that it can import pathways created with the older version and the improvements that are
Figure 4.10: Pathway properties dialog.
made in the new version don’t affect them. The current exported file for-mat is shown in Figure 4.11. The modifications made to the file forfor-mat are the addition of:
– Pathway name and description – Width & height for nodes – PubMed IDs list separated by ;
– Bend points in the format (a; b)...(c; d) based on the number of bend points.
When an old version’s file is imported to the current PathwayMapper the mentioned properties are set to null.
4.2
Complexity Management
• Hide/show all
In order to reduce complexity of a pathway diagram, hide-show function-ality was added. When the user is not currently interested in a certain part of the pathway, he can just hide it temporarily to show gradually as needed (Figure 4.12).
Figure 4.12: A sample pathway (left) and the resulting pathway after applying Hide Selected Nodes (right).
It’s extremely important that hide and show operations maintain user’s mental map with minimal changes in the layout. This is due to the fact that when a layout is performed when there are hidden nodes, the position of existing nodes might change drastically. We are planning to add ”Show Hidden Neighbors” to the context menu of the nodes who have hidden neighbors. Hence, for the show functionality we need to place the hidden nodes in the canvas without causing any overlaps. This is achieved through heuristics for finding appropriate initial location for content to be unhidden and subsequently apply an incremental layout [6].
We already implemented this feature in Newt [34], an SBGN based pathway editor, and for the placing of the nodes we used a heuristic approach as sketched in Figure 4.13. Firstly we split the space around the node with neighbors to be shown into 4 quadrants and keep a score how crowded each quadrant is. We assign a score of +3 and +1 to first and second degree neighbors respectively. Based on the calculated scores we determine the most available quadrant and place hidden neighbors randomly in that quadrant. Finally we display the hidden neighbors and apply an incremental layout.
The functionality needed for all this comes from the extension named cytoscape.js-view-utilities [35].
Figure 4.13: Heuristic for calculating location of unhidden neighbors [6].
• Gene search
In a complex visualized network it is generally difficult to locate a certain gene. For that reason a gene search bar is placed on the right side of
Toolbar (Figure 4.14) and when the user searches for a gene name (or a substring of its name) all the nodes containing that name are highlighted.
4.3
User Interface
• Toolbar
The most frequently used features are placed in a toolbar separated in groups based on their functionalities. The toolbar is placed just below the menu bar and allows the user to have an easy access for the main features (Figure 4.14).
Figure 4.14: Main functionalities are placed in toolbar.
• Keyboard facilities
In order to make it easier to modify the changes from the keyboard, we decided to implement multiple keyboard events such as Del & Backspace to delete selected nodes, Ctrl+A to select all the nodes, Ctrl+Z & Ctrl+Y for undo & redo respectively, movement of nodes and bend points with arrows where by simultaneously pressing Shift makes movement faster and Alt makes it slower. The last functionality is added to both cytoscape.js-node-resize [11] and cytoscape.js-edge-bend-editing [10].
• Tooltips
PathwayMapper is a very intuitive tool and there are already instructions for basic functionalities in Quick Help. However to make it simpler for non-specialized users various tooltips were added such as the ones in node palette, edge palette, toolbar and data types shown in Load Data from cBioPortal dialog.
4.4
Collaborative mode
The changes made to PathwayMapper also affect the shared data model (Fig-ure 4.15). In ’Node properties’ w & h were added which represent width and height of simple nodes, minWidth & minHeight representing width and height of compounds, isInvalidGene & isHiglighted which mark if a node has invalid or custom highlight. In ’Edge Properties’ pubmedIDs holds the PubMed IDs and bendPoint which holds edge bend points for each edge. Unlike ’Node properties’ and ’Edge properties’ which are saved for each element of the pathway, ’Layout properties’ and ’General Properties’ are saved globally in the shared data model.
Chapter 5
Conclusion
A web based pathway visualization tool named The TCGA Pathway Curation Tool, which was later renamed as PathwayMapper, was developed by our research group. It was designed specifically for cancer pathways and uses the conventional notation found in TCGA manuscripts. PathwayMapper supports the overlay of cancer genomic data on pathways and it allows remote users to create and modify pathways collaboratively.
This thesis work was conducted to turn PathwayMapper into a full-blown ed-itor with a better user-experience. The new features include interactive node resize, edge bend support, export in SVG & SIFNX format, providing gene and interaction details dialogs, addition of PanCanAtlas pathway templates, sev-eral complexity management operations such as hide/show, highlighting capa-bilities, gene search, grid & guidelines support for node alignment and the crucial undo/redo support. Furthermore, the User Interface has been improved with the addition of a toolbar and tooltips. This new version of PathwayMapper supports backward compatibility which means that pathways created with the previous version are compatible with this one as well.
5.1
Future Work
In the future we are planning to add other features such as:
• Addition of inspector panel on the right side of the canvas which will consist of Node editor, Edge editor and General properties.
• Chat support to allow the collaborators communicate with each other within the application
• Addition of expand-collapse functionality to have a better management of complexity of compound graphs similarly with the one used in Newt web editor [34]. It is useful when the user is interested in a particular part of the graph and wants to collapse the other compounds nearby. An illustration of how expand and collapse works is given in Figure 5.1 and Figure 5.2.
Figure 5.2: Neuronal muscle signaling pathway with two collapsed compartments.
• Filtering of the genes by alteration percentage where only the genes above a threshold may be shown. This feature might be beneficial to understand which genes are mostly activated for a certain cancer type.
5.2
Availability
Since PathwayMapper is an open source tool, its source code can be found in GitHub repository of our research group [36].
Latest PathwayMapper is being periodically deployed to http://pathwaymapper-unstable.herokuapp.com [37] and the online instance can be accessed at
Bibliography
[1] P. V. Garapati, “Activation, myristolyation of bid and translocation to mi-tochondria [homo sapiens],” Accessed in June 2018.
[2] E. G. Cerami, B. E. Gross, E. Demir, I. Rodchenkov, ¨Ozg¨un Babur, N. An-war, N. Schultz, G. D. Bader, and C. Sander, “Pathway Commons, a web resource for biological pathway data,” Nucleic Acids Research, vol. 39, no. Database-Issue, pp. 685–690, 2011.
[3] B. Genc and U. Dogrusoz, “An algorithm for automated layout of process description maps drawn in sbgn,” Bioinformatics, vol. 32, no. 1, pp. 77–84, 2015.
[4] M. C. Siper, “Libraries and tools for viewing and editing biological maps in sbgn,” Master’s thesis, Bilkent University, 2017.
[5] I. Bahceci, “Software tools for visual analysis of cancer genomics data in the context of pathways,” Master’s thesis, Bilkent University, 2016.
[6] U. Dogrusoz, A. Karacelik, I. Safarli, H. Balci, L. Dervishi, and M. C. Siper, “Efficient methods and readily customizable libraries for managing complex-ity of large networks,” PloS one, vol. 13, no. 5, p. e0197238, 2018.
[7] M. P. van Iersel, T. Kelder, A. R. Pico, K. Hanspers, S. Coort, B. R. Conklin, and C. Evelo, “Presenting and exploring biological pathways with pathvisio,” BMC bioinformatics, vol. 9, no. 1, p. 399, 2008.
[8] “TCGA Pathway Curation Tool.” http://tcga.patika.org/. (Accessed in June 2016).
[9] I. Bahceci, U. Dogrusoz, K. C. La, ¨O. Babur, J. Gao, and N. Schultz, “Path-waymapper: a collaborative visual web editor for cancer pathways and ge-nomic data,” Bioinformatics, vol. 33, no. 14, pp. 2238–2240, 2017.
[10] iVis-at Bilkent, “A cytoscape.js extension enabling interactive editing of edge bend points.” https://github.com/iVis-at-Bilkent/cytoscape. js-edge-bend-editing, Jun 2018. Accessed in June 2018.
[11] iVis-at Bilkent, “A cytoscape.js extension to provide grapples to resize nodes.” https://github.com/iVis-at-Bilkent/cytoscape. js-node-resize, Jun 2018. Accessed in June 2018.
[12] iVis-at Bilkent, “A cytsocape.js extension to provide a framework for grid interactions such as grid lines and snapping to grid, and guidelines and snap support for alignment of nodes..” https://github.com/iVis-at-Bilkent/ cytoscape.js-grid-guide, Jun 2018. Accessed in June 2018.
[13] “The pan-cancer atlas.” https://www.cell.com/pb-assets/consortium/ pancanceratlas/pancani3/index.html. Accessed in June 2018.
[14] E. Demir, M. P. Cary, S. Paley, K. Fukuda, C. Lemer, I. Vastrik, G. Wu, P. D’Eustachio, C. Schaefer, J. Luciano, F. Schacherer, I. Martinez-Flores, Z. Hu, V. Jimenez-Jacinto, G. Joshi-Tope, K. Kandasamy, A. C. Lopez-Fuentes, H. Mi, E. Pichler, I. Rodchenkov, A. Splendiani, S. Tkachev, J. Zucker, G. Gopinath, H. Rajasimha, R. Ramakrishnan, I. Shah, M. Syed, N. Anwar, O. Babur, M. Blinov, E. Brauner, D. Corwin, S. Donald-son, F. Gibbons, R. Goldberg, P. Hornbeck, A. Luna, P. Murray-Rust, E. Neumann, O. Reubenacker, M. Samwald, M. van Iersel, S. Wimalaratne, K. Allen, B. Braun, M. Whirl-Carrillo, K.-H. Cheung, K. Dahlquist, A. Finney, M. Gillespie, E. Glass, L. Gong, R. Haw, M. Honig, O. Hubaut, D. Kane, S. Krupa, M. Kutmon, J. Leonard, D. Marks, D. Merberg, V. Petri, A. Pico, D. Ravenscroft, L. Ren, N. Shah, M. Sunshine, R. Tang, R. Wha-ley, S. Letovksy, K. H. Buetow, A. Rzhetsky, V. Schachter, B. S. So-bral, U. Do˘grus¨oz, S. McWeeney, M. Aladjem, E. Birney, J. Collado-Vides, S. Goto, M. Hucka, N. L. Novere, N. Maltsev, A. Pandey, P. Thomas, E. Win-gender, P. D. Karp, C. Sander, and G. D. Bader, “The BioPAX community
standard for pathway data sharing,” Nature Biotechnology, vol. 28, no. 9, pp. 935–942, 2010.
[15] N. Le, M. Hucka, H. Mi, S. Moodie, F. Schreiber, A. Sorokin, E. Demir, K. Wegner, M. I. Aladjem, S. M. Wimalaratne, and et al., “The systems biology graphical notation.,” Aug 2009.
[16] P. Shannon, A. Markiel, O. Ozier, N. S. Baliga, J. T. Wang, D. Ramage, N. Amin, B. Schwikowski, and T. Ideker, “Cytoscape: a software environ-ment for integrated models of biomolecular interaction networks.,” Nov 2003. [17] K. Ono, “Cytoscape.” http://www.cytoscape.org/. Accessed in June 2018.
[18] “Cytoscape web.” http://cytoscapeweb.cytoscape.org/. Accessed in June 2018.
[19] M. Franz, C. T. Lopes, G. Huck, Y. Dong, O. Sumer, and G. D. Bader, “Cytoscape.js: a graph theory library for visualisation and analysis.,” Jan 2016.
[20] N. e. Cancer, “Comprehensive genomic characterization defines human glioblastoma genes and core pathways.,” Oct 2008.
[21] “The cancer genome atlas.” https://en.wikipedia.org/wiki/The_ Cancer_Genome_Atlas, Jul 2018. Accessed in June 2018.
[22] “Biogene is an information tool for biological research..” http://cbio. mskcc.org/biogene/. Accessed in June 2018.
[23] D. Maglott, J. Ostell, K. D. Pruitt, and T. Tatusova, “Entrez gene: gene-centered information at ncbi.,” Jan 2005. Accessed in June 2018.
[24] “Google realtime api.” https://developers.google.com/realtime/ overview. Accessed in June 2018.
[25] J. Gao, B. A. Aksoy, U. Dogrusoz, G. Dresdner, B. Gross, S. O. Sumer, Y. Sun, A. Jacobsen, R. Sinha, E. Larsson, and et al., “Integrative analysis of complex cancer genomics and clinical profiles using the cbioportal,” Apr 2013.
[26] “Memorial Sloan Kettering Cancer Center.” https://www.mskcc.org/. Ac-cessed in June 2018.
[27] “Dana-Farber Cancer Institute - Cancer Treatment and Research in Boston, MA.” http://www.dana-farber.org/. Accessed in June 2018.
[28] “Welcome to the Princess Margaret.” http://www.uhn.ca/ PrincessMargaret. Accessed in June 2018.
[29] “The Children’s Hospital of Philadelphia.” http://www.chop.edu/. Ac-cessed in June 2018.
[30] “The Hyve: Open source solutions for bioinformatics.” http://thehyve. nl/. Accessed in June 2018.
[31] “Bilkent i-Vis Research Group.” http://www.cs.bilkent.edu.tr/~ivis/. Accessed in June 2018.
[32] iVis-at Bilkent, “Pathwaymapper: An interactive and collaborative graphical curation tool for cancer pathways..” https://github.com/ iVis-at-Bilkent/pathway-mapper, May 2018. Accessed in June 2018. [33] F. Sanchez-Vega, M. Mina, J. Armenia, W. K. Chatila, A. Luna, K. C. La,
S. Dimitriadoy, D. L. Liu, H. S. Kantheti, S. Saghafinia, et al., “Oncogenic signaling pathways in the cancer genome atlas,” Cell, vol. 173, no. 2, pp. 321– 337, 2018.
[34] M. Sari, I. Bahceci, U. Dogrusoz, S. O. Sumer, B. A. Aksoy, ¨O. Babur, and E. Demir, “Sbgnviz: a tool for visualization and complexity management of sbgn process description maps,” PloS one, vol. 10, no. 6, p. e0128985, 2015. [35] iVis-at Bilkent, “A cytoscape.js extension to provide miscellenaous view util-ities such as hiding and highlighting nodes/edges.” https://github.com/ iVis-at-Bilkent/cytoscape.js-view-utilities, Jun 2018. Accessed in June 2018.
[36] iVis-at Bilkent, “An interactive and collaborative graphical cura-tion tool for cancer pathways.” https://github.com/iVis-at-Bilkent/ pathway-mapper, Jun 2018. Accessed in June 2018.
[37] “Pathwaymapper: Latest version.” http://pathwaymapper-unstable. herokuapp.com. Accessed in July 2018.
![Figure 1.2: Visual representation of Activation of BID and translocation to mi- mi-tochondria in Pathway Commons [2]](https://thumb-eu.123doks.com/thumbv2/9libnet/5796830.118028/14.918.283.679.588.1043/figure-visual-representation-activation-translocation-tochondria-pathway-commons.webp)
![Figure 2.2: An example compound graph of multiple levels of nesting [3]](https://thumb-eu.123doks.com/thumbv2/9libnet/5796830.118028/18.918.251.716.625.923/figure-example-compound-graph-multiple-levels-nesting.webp)
![Figure 2.7: Architecture of SBGNViz.js [4].](https://thumb-eu.123doks.com/thumbv2/9libnet/5796830.118028/28.918.177.782.172.519/figure-architecture-of-sbgnviz-js.webp)
![Figure 2.8: Overview of visualization of gene interaction pathways with genomic data in cBioPortal [5].](https://thumb-eu.123doks.com/thumbv2/9libnet/5796830.118028/29.918.175.790.353.861/figure-overview-visualization-gene-interaction-pathways-genomic-cbioportal.webp)