ScienceDirect
Available online at www.sciencedirect.com Available online at www.sciencedirect.com
ScienceDirect
Procedia CIRP 00 (2017) 000–000www.elsevier.com/locate/procedia
2212-8271 © 2017 The Authors. Published by Elsevier B.V.
Peer-review under responsibility of the scientific committee of the 28th CIRP Design Conference 2018.
28th CIRP Design Conference, May 2018, Nantes, France
A new methodology to analyze the functional and physical architecture of
existing products for an assembly oriented product family identification
Paul Stief *, Jean-Yves Dantan, Alain Etienne, Ali Siadat
École Nationale Supérieure d’Arts et Métiers, Arts et Métiers ParisTech, LCFC EA 4495, 4 Rue Augustin Fresnel, Metz 57078, France * Corresponding author. Tel.: +33 3 87 37 54 30; E-mail address: [email protected]
Abstract
In today’s business environment, the trend towards more product variety and customization is unbroken. Due to this development, the need of agile and reconfigurable production systems emerged to cope with various products and product families. To design and optimize production systems as well as to choose the optimal product matches, product analysis methods are needed. Indeed, most of the known methods aim to analyze a product or one product family on the physical level. Different product families, however, may differ largely in terms of the number and nature of components. This fact impedes an efficient comparison and choice of appropriate product family combinations for the production system. A new methodology is proposed to analyze existing products in view of their functional and physical architecture. The aim is to cluster these products in new assembly oriented product families for the optimization of existing assembly lines and the creation of future reconfigurable assembly systems. Based on Datum Flow Chain, the physical structure of the products is analyzed. Functional subassemblies are identified, and a functional analysis is performed. Moreover, a hybrid functional and physical architecture graph (HyFPAG) is the output which depicts the similarity between product families by providing design support to both, production system planners and product designers. An illustrative example of a nail-clipper is used to explain the proposed methodology. An industrial case study on two product families of steering columns of thyssenkrupp Presta France is then carried out to give a first industrial evaluation of the proposed approach.
© 2017 The Authors. Published by Elsevier B.V.
Peer-review under responsibility of the scientific committee of the 28th CIRP Design Conference 2018. Keywords: Assembly; Design method; Family identification
1. Introduction
Due to the fast development in the domain of communication and an ongoing trend of digitization and digitalization, manufacturing enterprises are facing important challenges in today’s market environments: a continuing tendency towards reduction of product development times and shortened product lifecycles. In addition, there is an increasing demand of customization, being at the same time in a global competition with competitors all over the world. This trend, which is inducing the development from macro to micro markets, results in diminished lot sizes due to augmenting product varieties (high-volume to low-volume production) [1]. To cope with this augmenting variety as well as to be able to identify possible optimization potentials in the existing production system, it is important to have a precise knowledge
of the product range and characteristics manufactured and/or assembled in this system. In this context, the main challenge in modelling and analysis is now not only to cope with single products, a limited product range or existing product families, but also to be able to analyze and to compare products to define new product families. It can be observed that classical existing product families are regrouped in function of clients or features. However, assembly oriented product families are hardly to find.
On the product family level, products differ mainly in two main characteristics: (i) the number of components and (ii) the type of components (e.g. mechanical, electrical, electronical).
Classical methodologies considering mainly single products or solitary, already existing product families analyze the product structure on a physical level (components level) which causes difficulties regarding an efficient definition and comparison of different product families. Addressing this
Procedia CIRP 82 (2019) 166–171
2212-8271 © 2019 The Authors. Published by Elsevier B.V.
Peer-review under responsibility of the scientific committee of The 17th CIRP Conference on Modelling of Machining Operations 10.1016/j.procir.2019.04.151
© 2019 The Authors. Published by Elsevier B.V.
Peer-review under responsibility of the scientific committee of The 17th CIRP Conference on Modelling of Machining Operations
ScienceDirect
Procedia CIRP 00 (2019) 000–000
www.elsevier.com/locate/procedia
2212-8271 © 2019 The Authors. Published by Elsevier B.V.
Peer-review under responsibility of the scientific committee of The 17th CIRP Conference on Modelling of Machining Operations, in the person of the Conference Chair Dr Erdem Ozturk and Co-chairs Dr Tom Mcleay and Dr Rachid Msaoubi.
17th CIRP Conference on Modelling of Machining Operations
Investigating microstructure effects of heat-treated commercially pure
titanium (cp-Ti) based on mechanistic modeling of micro milling
A.Aksin
a, Y. Karpat
a,b*
aBilkent University, Department of Mechanical Engineering, Ankara 06800, Turkey bBilkent University, Department of Industrial Engineering, Ankara 06800, Turkey * Corresponding author. Tel.: +90-312-2902263; fax: +90-312-2664054. E-mail address: [email protected]
Abstract
Microstructural features such as grain size, grain morphology, and phase fractions have significant influence on process outputs of machining processes. During micro end milling where feed per tooth and depth of cut values are set comparable to grain size, process material interactions become more significant. The goal of this study is to investigate the influence of microstructural effects on process outputs during micro milling of cp-Ti work material. Micro milling experiments are performed to observe the process outputs as a function of grain size and grain morphology and a mechanistic approach has been used to explain their effects during micro milling.
© 2019 The Authors. Published by Elsevier B.V.
Peer-review under responsibility of the scientific committee of The 17th CIRP Conference on Modelling of Machining Operations, in the person of the Conference Chair Dr Erdem Ozturk and Co-chairs Dr Tom Mcleay and Dr Rachid Msaoubi.
Keywords: Micro machining; Micro structure; Grain morphology
1. Introduction
Micro milling is a highly flexible machining process to produce micro scale components made from engineering materials. It offers high material removal rate and the ability to create three-dimensional surfaces with good surface quality. A good understanding of micro milling process is essential to satisfy tight tolerances and surface quality requirements that are common in micro scale components. The ability to model and predict process forces accurately is an important step towards this goal. The interplay among micro end mill tool diameter, cutting edge radius, process parameters, and workpiece material microstructure has been shown to directly influence the process outputs. Additional research is required to understand the complex relationships between process inputs and outputs.
Titanium and its alloys are commonly used in engineering designs of micro scale components due to their high strength, corrosion resistance, and biocompatibility. In micro milling of
titanium, feed per tooth, depth of cut, and grain size of the material are in the same order of magnitude. Therefore, the process outputs are directly influenced by the grain morphology and grain size. Attanasio et al.[1] studied micro milling of titanium alloys with different microstructures and found that fully lamellar microstructure yielded better tool life. A similar finding was also reported by Abbasi et al. [2] on better machinability of the lamellar microstructure of titanium alloy Ti6Al4V. Ahmadi et al. [3] also investigated the machinability of different titanium alloy microstructures and observed the influence of built-up edge, which tends to grow with smaller grain size and leads to increased process forces.
In this study, the anisotropic behaviour of the commercially pure titanium considering its grain morphology will be investigated by using a mechanistic micro milling model. The influence of work material microstructure on the identified cutting force coefficients will be discussed.
Available online at www.sciencedirect.com
ScienceDirect
Procedia CIRP 00 (2019) 000–000
www.elsevier.com/locate/procedia
2212-8271 © 2019 The Authors. Published by Elsevier B.V.
Peer-review under responsibility of the scientific committee of The 17th CIRP Conference on Modelling of Machining Operations, in the person of the Conference Chair Dr Erdem Ozturk and Co-chairs Dr Tom Mcleay and Dr Rachid Msaoubi.
17th CIRP Conference on Modelling of Machining Operations
Investigating microstructure effects of heat-treated commercially pure
titanium (cp-Ti) based on mechanistic modeling of micro milling
A.Aksin
a, Y. Karpat
a,b*
aBilkent University, Department of Mechanical Engineering, Ankara 06800, Turkey bBilkent University, Department of Industrial Engineering, Ankara 06800, Turkey * Corresponding author. Tel.: +90-312-2902263; fax: +90-312-2664054. E-mail address: [email protected]
Abstract
Microstructural features such as grain size, grain morphology, and phase fractions have significant influence on process outputs of machining processes. During micro end milling where feed per tooth and depth of cut values are set comparable to grain size, process material interactions become more significant. The goal of this study is to investigate the influence of microstructural effects on process outputs during micro milling of cp-Ti work material. Micro milling experiments are performed to observe the process outputs as a function of grain size and grain morphology and a mechanistic approach has been used to explain their effects during micro milling.
© 2019 The Authors. Published by Elsevier B.V.
Peer-review under responsibility of the scientific committee of The 17th CIRP Conference on Modelling of Machining Operations, in the person of the Conference Chair Dr Erdem Ozturk and Co-chairs Dr Tom Mcleay and Dr Rachid Msaoubi.
Keywords: Micro machining; Micro structure; Grain morphology
1. Introduction
Micro milling is a highly flexible machining process to produce micro scale components made from engineering materials. It offers high material removal rate and the ability to create three-dimensional surfaces with good surface quality. A good understanding of micro milling process is essential to satisfy tight tolerances and surface quality requirements that are common in micro scale components. The ability to model and predict process forces accurately is an important step towards this goal. The interplay among micro end mill tool diameter, cutting edge radius, process parameters, and workpiece material microstructure has been shown to directly influence the process outputs. Additional research is required to understand the complex relationships between process inputs and outputs.
Titanium and its alloys are commonly used in engineering designs of micro scale components due to their high strength, corrosion resistance, and biocompatibility. In micro milling of
titanium, feed per tooth, depth of cut, and grain size of the material are in the same order of magnitude. Therefore, the process outputs are directly influenced by the grain morphology and grain size. Attanasio et al.[1] studied micro milling of titanium alloys with different microstructures and found that fully lamellar microstructure yielded better tool life. A similar finding was also reported by Abbasi et al. [2] on better machinability of the lamellar microstructure of titanium alloy Ti6Al4V. Ahmadi et al. [3] also investigated the machinability of different titanium alloy microstructures and observed the influence of built-up edge, which tends to grow with smaller grain size and leads to increased process forces.
In this study, the anisotropic behaviour of the commercially pure titanium considering its grain morphology will be investigated by using a mechanistic micro milling model. The influence of work material microstructure on the identified cutting force coefficients will be discussed.
2. Experimental Setup and Sample Preparation
2.1. Sample Preparation and Characterization
In order to investigate the influence of microstructure morphology effects on the micro end milling process, three
samples were heat treated at 950◦C for different durations. After
heat treatment, samples were cooled inside the furnace. Table 1 summarizes the heat treatment durations and temperature levels. A sample has been included in the experimental study as-received work material.
Table 1. Heat treatment parameters Sample
No. Sample Label Duration (hour) Temp. (
◦C) Comments
1 S1 - - As received
2 S2 1 950 Furnace cooled
3 S3 5 950 Furnace cooled
4 S4 10 950 Furnace cooled
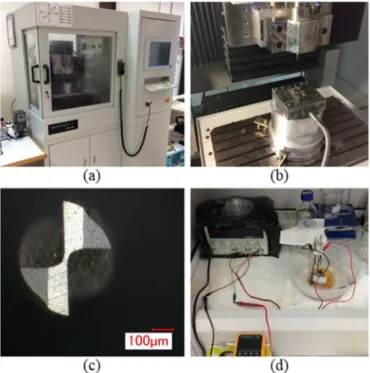
After heat treatment, samples were prepared for metallographic characterization by applying of wet rough grinding with 800, 1200, and 1500 grit SiC sand papers. The ground surface was polished using electro polishing method (Fig. 4(d)). Electrolyte solution of 6% Perchloric Acid (70%) + 35% 2-butoxyethanol + 59% Methanol was used with stainless
steel cathodes [4]. Polishing parameters were 35 Volts for 1 cm2
surface area and duration was approximately 4 seconds. Samples were polished down to 0.2 µm Ra surface roughness values and then etched with Kroll’s reagent (ASTM E407 – 07 number 13).
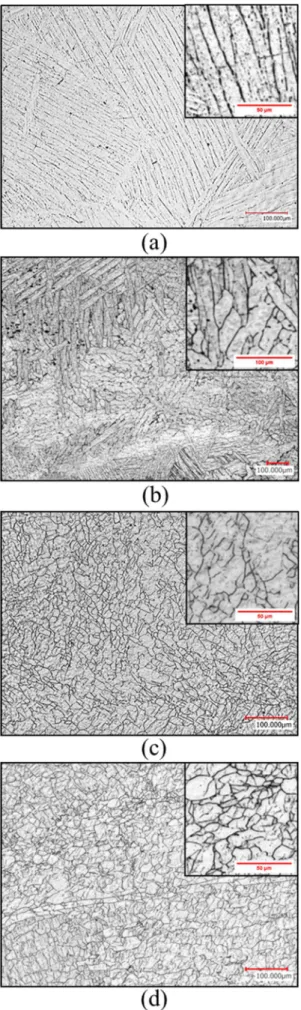
A Keyence VKX 110 3D laser surface topography device was used to inspect the etched surfaces and to collect micrographs. The microstructure morphology obtained after heat treatment and the above mentioned characterization process is shown in Fig. 1. Fig. 1a shows as-received sample (S1) which has highly deformed and elongated grains. After various heat treatment durations, gradual transformation of grain morphology to equiaxed grains is shown through Fig 1b, 1c, and 1d. Grain size of samples were measured according to ASTM E112 – 10 and results are given at Fig. 2. For the elongated grains in sample 1, an intercept procedure was used for grain measuring, for other samples a planimetric procedure was applied.
A Zwick/Roell ZHVµ Micro hardness device was used to conduct tests at HV1 (1 kg) and HV 0.01 (10 g) loads. Load application time was 10 s. Fig. 3 shows the results of the tests. According to the results, uncertainty is higher at HV0.01 measurements compared to HV1. This is due to the cumulative effects of adjacent grains, which are more apparent in HV1 loading. The hardness of individual grains was captured better in HV0.01 loads because the size of the indenter was smaller than average grain size.
Fig. 1. Engineered grain morphologies of (a) S1 as received; (b) S2 partially lamellar and equiaxed; (c) S3 equiaxed; (d) S 4 equiaxed.
Fig. 2. Measured grain size and heat treatment duration.
Fig. 3. Vickers micro hardness test results.
Fig. 4. (a) Micro machining center; (b) Dynamometer, sample and spindle; (c) Micro end mill used in test; (d) Electro polish setup.
2.2. Milling Test Setup
Full immersion milling tests were performed with a Mikrotools DT-110 three axis micro machining centre equipped with a high precision Nakanishi EM3060 spindle (50.000 rpm max) (Fig. 4(a)). Cutting force data were collected using Kistler mini dynamometer 9256C1 together with its multichannel charge amplifier (Fig. 4(b)). Sampling rate was set at 333 kHz (NI 7854R A/D converter) which is suitable to capture micro milling forces. Micro end mills with a diameter of 600 µm and length of 1.5 mm with 30-degree helix angle (NS Tools MSE230 series two flute end mill) were used in experiments as shown in Fig. 4(c). Experimental conditions are summarized in Table 2. A different end mill was used for each sample. End mills were inspected under a microscope after slot milling tests for tool wear, and no significant flank wear was observed. Spindle speed was set constant corresponding to 52 m/min, a cutting speed suitable for titanium machining. Feed per tooth values were set larger than the cutting edge radius of the end mill, which was measured as 2 µm.
Table 2. Micro milling experiment conditions Sample
Label Tool Label Feed per tooth (µm) Cutting speed (m/min) Spindle Speed (rpm) Depth of cut (µm) S1 T1 2, 4, 6, 8 52.8 28000 60 S2 T2 2, 4, 6, 8 52.8 28000 60 S3 T3 2, 4, 6, 8 52.8 28000 60 S4 T4 2, 4, 6, 8 52.8 28000 60 3. Mechanistic Model
The mechanistic model of the micro end milling is based on trochoidal motion of the flutes relative to spindle axis [5]. Mechanistic milling models, include tool runout, elastic recovery of the material, minimum uncut chip thickness, and ploughing-shear zone transitions. The milling model assumes that the tool body is divided into axial disk elements, and a numerical integration procedure is utilized to simulate forces acting on tool.
3.1. Chip thickness calculation
Tool rotation is described in terms of time t which also i
corresponds to time value on first flute (j =0) at ith axial
disk element. To define t a reference start time may be i
accepted as t . Time 0 t is the time at 0th disk element on first 0
flute [6]:
( )
2 2 2 1 2 0 2 tan cos 2 p i R a i R t t K λ ω − − = − (1)Here,
λ
is the helix angle, a is the depth of cut, R is the pradius of the tool, ω is the angular speed of the spindle, K is
the number of axial disk elements. Lamellar Lamellar + Equiaxed Equiaxed Equiaxed 0 2 4 6 8 10 12 0 5 10 15 20 25
S1
S2
S3
S4
He
at
T
re
at
m
ent
a
t 9
50
◦C
[H
ou
r]
G
ra
in
Si
ze
[um
]
Mean Dia. Duration 0 200 400 600 800 1000 1200 S1 S2 S3 S4Vi
ck
er
s H
ar
ne
ss
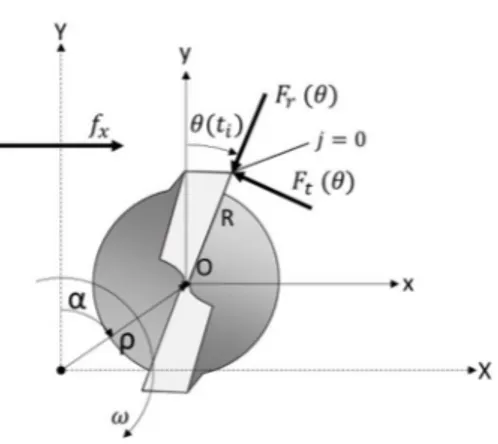
HV0.01 HV1Fig. 5. Mechanistic model geometric parameters
An end mill that is rotating clockwise and feeds in the direction of X (see Fig. 5) is considered. The tool has runout relative to spindle axis, defined with an angle of α and distance
ofρ. To simulate forces, instantaneous chip thickness values
must be calculated accurately for a given immersion angle θ .
The motion of the end mill center at point O x y can be ( , )
described as in Fig. 6:
(
)
(
)
ρ sin ω 60 ρ cos ω 60 x i O i y i O i f t x t f t y t α α = + + = + + (2)Here, f ,x f is feed (mm/min). Using Eq. (2), the point y
( , )
P x y at which cutting occurs can be found as:
2 R sin ω 2 R sin ω P O i z P O i z j x x t N j y y t N π π = + − = + − (3)
Here, Nz is the total flute number of the tool. Similarly, the
center position O x y′( , ) of the previous cutting flute ( 1)j−
that intersects with the line OP can be derived by substituting
i
t with t ′ in Eq. (2). i ti′ is the time value corresponds to
intersection angle θ( )ti′ . Intersection point Q x y( , ) may be
found by replacingO x y( , )O O , j, tiwith O x y′( , )O′ O′ , ( 1)j−
and t ′ respectively. i
Since point P and Q both lie on the same line, theoretical
uncut chip thickness tcr (TUCT) can be found as [7]:
(
tan)
2(
( )
)
1cr P Q i
t = y −y θ t + (4)
To solve this equation, the term (yP−yQ), which requires
i
t ′ , must be known. We may find t ′ using Newton-Raphson i
method [8] as:
Fig. 6. Geometry of the (j-1)th flute intersection with line OP .
( )
( )
' ' ' 1 F ti' ti n ti n F ti = + + ′ (5)Here, F is the root finding function and n is the iteration
number. Using collinear points P and Q, F may be written
in terms of ti′ as:
( )
'(
) (
)
tan(
( )
)
0F ti =xP Q−x − yP Q−y θ ti = (6)
By substituting Eq. (3) for points P and Q into Eq. (6), F can be written as:
( )
( )
( )
( )
(
)
(
( ))
( )
(
)
(
)
' ' ρ cos ω cos ω ' tan 60 2 1 2 ' cos ω cos ω ' ' ρ sin ω sin ω 60 2 sin ω sin f t ty i i ti ti F ti ti j j R ti ti Nz Nz f t tx i i ti ti j R ti N z α α θ π π α α π − + + − + + = − − − − − − + + − + + − − ( ) 0 2 1 ' ωti j Nz π = − − (7)By taking the derivative of Eq. (7) with respect toti′, ( )F t ′′ i
can be found. To implement the NR method, the initial guess
of the ti′can be set as [8]:
' 0 2 i i z t t N π ω = − (8)
After finding ti′ , TUCT can be found using Eq. (4)
3.2. Entry and exit angle calculation
Entry and exit of the tool flute into the material is important since they directly affect force calculations in terms of chip area calculation. If there is no engagement between tool and material, no chip area is developed. Entry and exit angles are the points at which chip area is zero as shown in Fig. 6. Using this important property, a valley finding algorithm can easily
detect entry and exit angles using tcr( )θ values calculated for
the full revolution of tool. Determined angles are then used in the numerical integration step.
3.3. Force calculations
The mechanistic model considers two different chip formation regions: shearing and ploughing [9]. In this study, ploughing region is neglected, since feed per tooth values are selected to be larger than the edge radius. Shearing region is defined as where TUCT is equal or greater than minimum uncut chip thickness (MUCT). In this case, calculation of the force is done according to:
ts ts cr te rs rs cr re
dF
K t dz K dz
dF
K t dz K dz
=
+
=
+
(9)Here, Kts and Kte are tangential cutting and edge coefficients,
while Krs and Kre are radial cutting and edge coefficients. In
force calculations, the axial force F is neglected, due to the a
negligible amount of force generated in the tests. Infinitesimal
Force components in tangential and radial direction dFt and
dFr, can be transformed to cartesian coordinates by using Eq.
(10). In the final step, a numerical integration scheme can be applied to obtain forces generated by micro end mill [10].
cos( )
sin( )
sin( )
cos( )
x t y rdF
dF
dF
dF
θ
θ
θ
θ
−
−
=
−
(10) 3.4. Parameter identificationModel parameters are determined using a genetic algorithm with fitness function based on the sum of squares of RMS values for X and Y directions as shown in Eq. (11).
, , 2 2 exp, , exp, ,
(
i j j)
(
i j j)
m n x sim x y sim y i jF
F
F
F
ε
=
∑∑
−
+
−
(11)Here, mis the number of uniformly random picked sample
values, n is the number of feed values and ε error. is the
simulated force data and is the collected force data.
Collected force data are processed to filter out high frequency components by using a median filter before calculating RMS
values. Genetic algorithm halts when ε is lower than a desired
tolerance of 1 e-6.
4. Results
Fig. 7 shows the measured rms (root mean square) micro milling resultant forces for various feed values for all microstructures. As expected, rms resultant forces increase with increasing feed. Resultant force values increase as microstructure becomes more equiaxed which is an expected result considering micro hardness values given in Fig. 3
Fig. 7. Experimental observations of resultant force RMS values with respect to feed per tooth
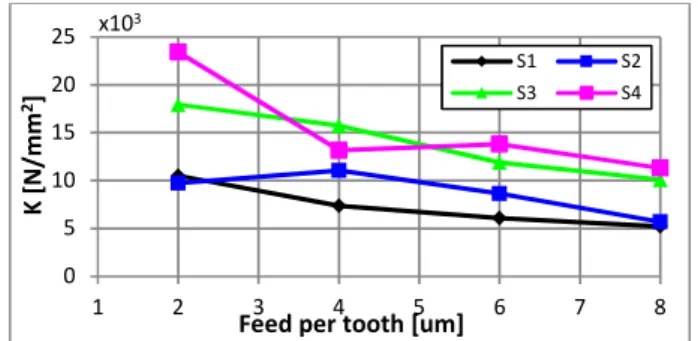
Fig. 8 shows the variation of specific cutting energy for all microstructures as a function of feed per tooth. Again, equiaxed microstructure yielded a higher value at small feeds. The influence of microstructure decreases as feed value increases.
Fig. 8. Specific cutting energy values (atθ= o90 ) with respect to feed per tooth (calculated from mean tangential force and max. chip thickness area)
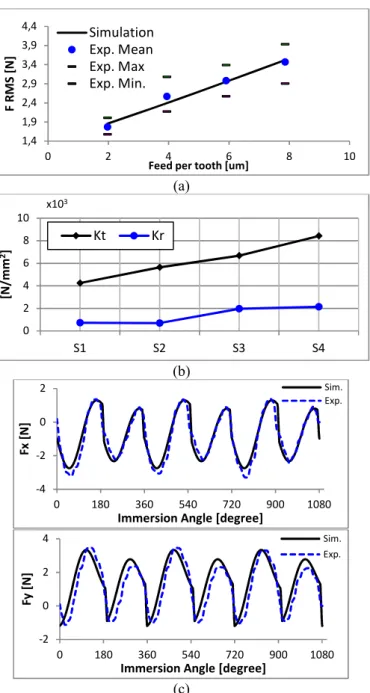
Fig. 9a shows curve fitting approach with genetic algorithm used in mechanistic model to identify force and edge coefficients. A good fit was obtained in the solution. Fig. 9b shows the identified cutting force coefficients in tangential and radial directions corresponding to each sample. Force coefficients are observed to be increasing. Fig. 9c shows the measured and simulated process forces. The mechanistic model force predictions are in good agreement with the measurements. Table 3 summarizes the cutting and edge force coefficients obtained in this study. Neither significant tool wear nor built-up edge were observed in the experiments due to short cutting distance.
Fig. 10a shows the micro milled channels for S1 and S4. Fig. 10b shows the variation of surface roughness as a function of feed for each sample. Surface roughness tends to increase with increasing feed as expected. Influence of increasing feed on microstructure is more pronounced with lamellar microstructure. 0 1 2 3 4 5 2 4 6 8 F RM S [N]
Feed per tooth [um]
S1 S2 S3 S4 0 5 10 15 20 25 1 2 3 4 5 6 7 8 K [N /m m 2] x103
Feed per tooth [um]
S1 S2
(a)
(b)
(c)
Fig. 9. (a) Simulation results of resultant force RMS values for different feeds and experimental data comparison for S3; (b) Identified tangential and radial K coefficients for shear region; (c) Simulation of forces at feed per tooth 6 µm for S2 in X and Y direction.
Table 3. Identified parameters obtained from the model.
Parameters S1 S2 S3 S4 Kts 4247.7 5643.3 6671 8418.4 Krs 728.4 697.6 1971.4 2139.0 Kte 8.9 14 16.9 19.1 Kre 8.2 18.5 12.1 18.9 ρ (µm) 0.03 0.44 0.35 0.073 α (deg) 6.4 20.1 21.2 26.9
Fig. 10. (a) Micro milled channels (Top: S4, Bottom: S1); (b) Roughness values taken from cut slots with respect to feed per tooth (measurement
parameters according to ISO4287 were λs: 0.25µm and λc: 0.08µm)
5. Conclusion
This study investigated the influence of microstructure on machining forces and surface roughness during micro milling of cp-Ti. Microstructures were adjusted through heat treatment such that a gradual transition from acicular to equiaxed grain morphology was obtained. Micro milling experiments were performed. It was observed that as the microstructure becomes more equiaxed, its hardness increases, which in turn increases the machining forces. However, a possible decrease in the material ductility leads to better surface roughness. The influence of microstructure can be observed through calculated force and edge coefficients. The results confirm the complex interplay between process parameters and process outputs.
References
[1] Attanasio A, Gelfi M, Pola A, Ceretti E, Giardini C. Influence of material microstructures in micromilling of Ti6Al4V alloy. Materials 2013; 6: 4268–4283.
[2] Abbasi SA, Feng P, Ma Y, Zhang J, Yu, D, Wu, Z. Influence of microstructure and hardness on machinability of heat-treated titanium alloy Ti-6Al-4V in end milling with polycrystalline diamond tools. Int. J. Adv. Manuf. Technol 2016; 86:1393–1405.
[3] Ahmadi M, Karpat Y, Acar O, Kalay YE. Microstructure effects on process outputs in micro scale milling of heat treated Ti6Al4V titanium alloys. Journal of Materials Processing Tech. 2018; 252:333–347.
[4] Reggiani RC, Mazza F, Sivieri E. Electrochemical polishing of titanium in perchloric-methanolic solutions. Materials Chemistry 1979; 4:149-158. [5] Bao WY, Tansel IN. Modeling micro-end-milling operations. Part II: tool run-out. Int J Mach Tool Manu 2000; 40:2175-2192.
[6] Zhang X, Ehmann KF, Yu T, Wg W. Cutting forces in micro-end-milling processes. Int J Mach Tool Manu 2016; 107:21-40.
[7] Li HZ, Li XP. A numerical study of the effects of cutter runout on milling process geometry based on true tooth trajectory. Int J Adv Manuf Technol 2005; 25:435-443.
[8] Li C, Lai X, Li H, Ni J. Modeling of three-dimensional cutting forces in micro-end-milling. J. Micromech. Microeng 2007; 17:671-678. [9] Malekian M, Park SS, Jun MBG. Modeling of dynamic micro-milling
cutting forces. Int J Mach Tool Manu 2009; 49:586-598.
[10] Altintas Y. Manufacturing automation: metal cutting mechanics, machine tool vibrations, and cnc design. UK:Cambridge University Press; 2000. 1,4 1,9 2,4 2,9 3,4 3,9 4,4 0 2 4 6 8 10 F RM S [N]
Feed per tooth [um] Simulation Exp. Mean Exp. Max Exp. Min. 0 2 4 6 8 10 S1 S2 S3 S4 [N /m m 2] x103 Kt Kr -4 -2 0 2 0 180 360 540 720 900 1080 Fx [N]
Immersion Angle [degree]
Sim. Exp. -2 0 2 4 0 180 360 540 720 900 1080 Fy [N ]
Immersion Angle [degree]
Sim. Exp. 0,2 0,3 0,4 0,5 2 4 6 8 Ra [u m ]
Feed per Tooth [um]
S1 S2 S3 S4