Rainbow trapping in a chirped
three-dimensional photonic crystal
Zeki Hayran
1, Hamza Kurt
1& Kestutis Staliunas
2,3Light localization and intensity enhancement in a woodpile layer-by-layer photonic crystal, whose interlayer distance along the light propagation direction is gradually varied, has been theoretically predicted and experimentally demonstrated. The phenomenon is shown to be related to the
progressive slowing down and stopping of the incident wave, as a result of the gradual variation of the local dispersion. The light localization is chromatically resolved, since every frequency component is stopped and reflected back at different positions along the crystal. It has been further discussed that the peculiar relation between the stopping position and the wave vector distribution can substantially increase the enhancement factor to more than two orders of magnitude. Compared to previously reported one- and two-dimensional photonic crystal configurations, the proposed scheme has the advantage of reducing the propagation losses by providing a three-dimensional photonic bandgap confinement in all directions. The slowing down and localization of waves inside photonic media can be exploited in optics and generally in wave dynamics, in many applications that require enhanced interaction of light and matter.
Temporary storage of light, by means of its slowing down which leads to increase of the local intensity of slow light, has been the subject of intensive research, since many useful optical phenomena rely on strong interaction between light and matter1. Initial attempts to substantially reduce the speed of light were based on quantum
effects such as electromagnetic induced transparency2 and optical coherent effects3, where restrictions like the
usage of ultracold gases or the narrow operational bandwidth limited their practical implementations. More recently the on-chip realizations of slow light schemes have become possible, such as coupled resonator opti-cal waveguides4, 5, which can lead to low group velocities with negligible distortion. However a fundamental
limit, limiting such structures is the so-called delay-bandwidth product, which imposes a trade-off between the factor of slowing-down and the bandwidth in which the slowing, exists6. One way to alleviate this limitation is
to adiabatically tune (or chirp) the structure, meaning that one or several structural parameters are gradually varied along the direction of propagation. In particular, it has been shown that in a tapered metamaterial hetero-structure, light can be slowed down and trapped at specific locations depending on its frequency using negative Goos–Hänchen shift7. This phenomenon, termed as the “Trapped Rainbow” effect, can also be considered as the
spatial separation of the frequency components of the propagating wave, and has been demonstrated in dielectric8
and plasmonic9–18 gratings or waveguides, in one-19 and two-dimensional20–22 photonic crystals (2D PhCs), in a
hyperbolic metamaterial waveguide23, in sonic crystals24, and in a waveguide under a tapered magnetic field25.
While significant steps have been taken towards the slowing down and “trapping” of the light, one still needs to cope with extrinsic losses while implementing such schemes. It has been debated whether material absorption that is reminiscent of metallic structures can give large propagation losses and prevent the light stopping mech-anism in metamaterials26. Although it is possible to overcome the material losses in metamaterials by employing
absorption-free dielectric 2D PhCs in their negative refraction regime27 instead of metallic components, it still
remains unclear whether other extrinsic loss mechanisms such as out-of-plane radiation losses can be compen-sated and overcome in such structures. Yet some attempts to reduce the losses in 2D PhCs have been under-taken28, 29, the inevitable relation between the group velocity of the light and its interaction time with the medium
still leads to considerable amount of scattering loss enhancement, as one approaches the band edge region (where most of the slow light behavior occurs)27, 30–33.
1Nanophotonics Research Laboratory, Department of Electrical and Electronics Engineering, TOBB University of Economics and Technology, Ankara, 06560, Turkey. 2DONLL, Departament de Física, Universitat Politècnica de Catalunya (UPC), Edifici Gaia, Rambla Sant Nebridi 22, 08222, Terrassa, Spain. 3Institució Catalana de Recerca i Estudis Avancats (ICREA), Passeig Lluís Companys 23, 08010, Barcelona, Spain. Correspondence and requests for materials should be addressed to Z.H. (email: [email protected])
Received: 10 February 2017 Accepted: 26 April 2017 Published: xx xx xxxx
of the tapered grating. Such a limitation impose severe constraint onto the local field intensity and the available volume at which the spectrally resolved wave can be efficiently harvested. In this manuscript, on the other hand, we show that the “trapped rainbow” effect occurring in a defect free bulk structure can lead to considerable higher local field intensities by employing 3D PhC bulk modes with large modal volumes.
Results
Chirped 3D woodpile photonic crystal structure.
We consider a 3D woodpile PhC composed of cylin-drical alumina (Al2O3) rods with a radii and height equal to =r 82a and h = 8.463a, respectively, where a is thein-plane period. The Al2O3 rods have a dielectric constant equal to εrod = 9.8 at microwave frequencies. The
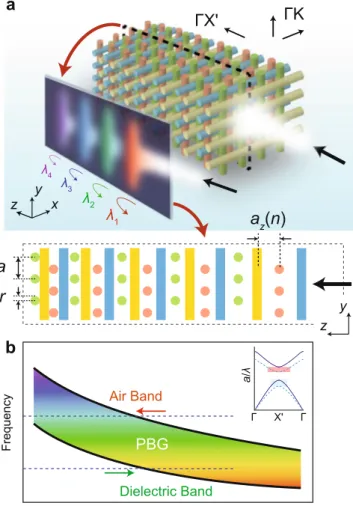
gen-eral schematics and the main operational principle of the proposed configuration is shown in Fig. 1(a). As men-tioned above, the period in the stacking direction is continuously varied. We consider a slow (adiabatic) variation of the PhC period, which allows to consider local dispersion relation of it at every layer24. In result, the frequency
of the PBG becomes smoothly varying along the propagation direction, as shown in Fig. 1(b). Therefore, a wave entering the structure will gradually slow down inside the PhC as its frequency will progressively approach the edge of the local PBG. Once the PBG is reached, the wave will “stop”, i.e. become temporarily localized, and after-wards will propagate back. Since the local PBG is distinct for every spatial position, each frequency component will be localized at different positions along the PhC, as illustrated in the left inset of Fig. 1(a).
Dispersion analysis.
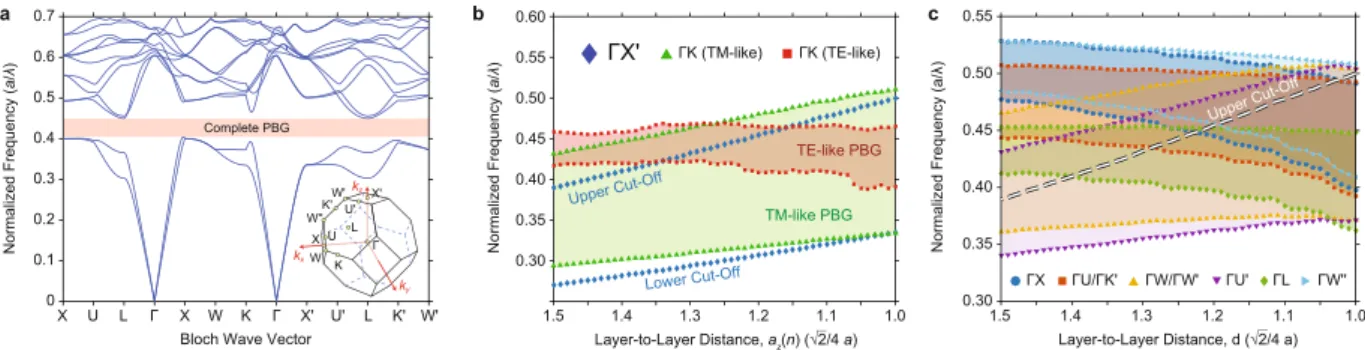
A detailed numerical analysis is performed to deduce the structure parameters. Preliminary, for a periodical woodpile PhC with a constant layer-to-layer distance =d 42a (i.e. the rods from the consecutive layers just touch one another) the local band structure is numerically calculated with the plane-wave expansion method38 and the result is shown in Fig. 2(a). The calculated band structure reveals a complete PBGwith a gap/mid-gap ratio (the ratio of gap width to the central frequency of the gap) of 11%, while the gap/ mid-gap ratio of the partial PBG in the propagation direction Γ-X′ (stacking direction) is equal to 39%. Moreover, the frequencies at the bottom and top of this partial PBG are defined as the lower and upper cut-off frequencies and their variation with respect to the layer-to-layer distance is plotted in Fig. 2(b). Despite their similarity in terms of their layer-to-layer distance relations, the two cut-off regions differ in an important respect: To obtain a local PBG at the lower/upper bands, the layer-to-layer distance should be increased/decreased; respectively (see upper left inset of Fig. 1(b)). Consequently, the direction of the gradual layer-to-layer distance variation (whether it decreases or increases along the propagation direction) depends on the operational frequency region: The upper/lower cut-off regions require a decreasing/increasing layer-to-layer distance, respectively (indicated by red and green arrows in Fig. 1(b)). Apart from this apparent distinction, another difference between the two cut-off regions becomes evident if the partial PBGs in other directions are examined. The PBGs in the Γ-K direction, which corresponds to the direction along the rod axes are superimposed on Fig. 2(b). Unlike the Γ- X′ direction, the wave propagation in the Γ-K direction is nondegenerate for modes with polarization vectors along the rod axis and along the stacking direction, which we will refer to as the transverse electric-like (TE-like) and transverse magnetic-like (TM-like) modes, respectively. As can be seen from Fig. 2(b), the TM-like PBG comprises the whole upper cut-off region in the examined layer-to-layer distance range, whereas the TE-like PBG encloses only a portion of the examined range. On the other hand, for all utilized layer-to-layer distances, the lower cut-off region lies outside the coverage of both PBGs, which indicates that in the case of vertically scattered light, the corresponding structure based on the lower cut-off operation will be vulnerable to radiation losses. Furthermore, the PBG variations in the same range for propagation directions corresponding to the X, U, U′, K′, W, W’, W″, and L symmetry points35, whose positions in the Brillouin zone are shown on the lower right inset of Fig. 2(a), are
calculated and given in Fig. 2(c). For directions with nondegenerate modes, the complete PBGs comprising simultaneously both TE-like and TM-like PBGs have been taken into account. Consequently, the local dispersion analyses in Fig. 2(b) and (c) imply that a complete confinement is not possible, since modifying the layer-to-layer distances will further break the low rotational symmetry of the lattice structure39, which in turn will increase the
structural anisotropy. Nevertheless, a close inspection of the PBG variations reveals that for the layer-to-layer distance range .{1 15, 1 35}. ∗ 42a, the localized mode near the cut-off region is still confined in most directions.
Following this approach, it is reasonable to vary the layer-to-layer distances of the PhC structure from
. ∗ a
from the air region is problematic due to the mode mismatch at the air- PhC interface40, 41. Furthermore, in order
to avoid photon tunneling into the air cladding, one needs additional layers at the end of the structure. These two requirements can be both satisfied by increasing the layer-to-layer distance interval further including
. . ∗ a
{1 00, 1 50} 42 . In this way, the wave enters the structure with a wave vector away from the slow light region and the leakage due to the large penetration depth of the slow light modes is suppressed. On the other hand, since the operational frequency region is at the upper cut-off region, the layer-to-layer distance should decrease along the propagation direction, as discussed previously. Moreover, the number of rods in each layer is chosen to be 7, as it is restricted by the length of the Al2O3 rods (h = 8.463a). The number of layers, on the other hand, is chosen
to be 30, to create a smoothly varying chirp function. In this case, the local layer-to-layer distance between the nth and (n + 1)th layer is equal to =
. − . ∗
a nz( ) (42 5 0 5 )n 42a/28. Here, we note that an important criterion that should be satisfied in adiabatic structures (to reduce the back-reflections) is the Wentzel-Kramers-Brillouin approximation18, which requires
δ = k n− + −k n− a n ( 1) ( ) ( ) 1 (1) n z 1 1
where δn is the adiabatic parameter between the nth and (n + 1)th layer and k(n) is the local wave vector at the nth
layer. To reveal whether the adiabaticity condition is satisfied for the proposed PhC structure, the local wave vec-tor distribution was obtained numerically for the frequency 7.91 GHz (which is predicted numerically to localize
Figure 1. Proposed 3D PhC configuration for rainbow trapping. (a) Schematic illustration of the chirped
woodpile PhC structure. For better visualization the number of periods of the illustrated PhC structure is reduced. The lower inset depicts the cross sectional view of the structure in the yz- plane. (b) The variation of the PBG along the propagation direction is representatively depicted. Due to the gradual variation of the layer-to-layer distances, the incident wave will be spatially separated into its frequency components along the propagation direction, thus forming a “trapped rainbow”, as it is representatively shown as a cross sectional view on the lower left of (a). The upper right inset in (b) representatively shows the change of the dispersion curves in the propagation direction, where the layer-to-layer distance of the solid black dispersion curve is smaller than that of the dashed blue dispersion curve. The black arrows reveal the propagation direction of the incoming wave.
at the 24th layer), by calculating the dispersion curve for all intermediate periods. By inserting the obtained wave vector variation and the az(n) variation into equation (1), the adiabatic parameter has been evaluated to be in the
range of 0.005 and 0.009, which already satisfies equation (1). Possible solutions to further decrease the adiabatic parameter (and, thus, to decrease the back-reflections) could be increasing the number of layers or decreasing the chirping interval. However, the mode coupling mismatch at the slow light regime40, 41 should be further taken into
account when tailoring the latter one, as was discussed above.
Time-domain analysis.
To verify the propagation characteristics, the proposed structure was modeled in a 3D grid by employing commercially available software42 based on the finite-difference time-domain (FDTD)method. Perfectly matched layer (PML) boundary conditions were used to terminate the computational domain and a TM polarized (electric field is in the y- direction) Gaussian pulse with a pulse length equal to ct/a = 30 in normalized time units was launched. The source was placed at a distance of 0.2a in front of the structure. Fig. 3(a–c) show the electric field intensities, calculated along the propagation (z-) direction, at the center point of the xy- plane at each time frame for normalized central frequencies a/λ = 0.450, 0.468 and 0.496, respectively. Figures 3(a–c) suggest that the PhC exhibits distinct localization regions for each frequency. More precisely, the incoming wave is slowed down until it reaches its localization region (or turning point) and is then trapped for a finite time interval before it starts propagating backwards. If the trapping time is defined as the time duration of the electric field intensity decaying from its maximum value until its 1/e 19, then the normalized trapping times
for Figs 3(a–c) would be obtained as ct/a = 18.9, 20.3 and 24.1; respectively. Further inferences can be made from the time evolution of the pulses, if one pays attention to the change of the magnitude of the field intensity. At the localization region the intensity increases, since the local energy density is expected to be inversely pro-portional to the group velocity20, 21, 43. Furthermore, to obtain a broadband analysis of the field enhancement,
the steady-state electric field intensity was numerically calculated at the same region (along the z- propagation direction, at the center of the xy- plane), and is shown in Fig. 3(d). If the turning point is defined as the spatial position where the intensity becomes maximum, then a nearly linear increase of the position of the turning point red colored areas. (c) The PBG variations for other directions. The dashed white line indicates the upper cut-off frequencies in the Γ- X′ direction.
Figure 3. Instantaneous and steady-state field analysis. Time evolution of a Gaussian pulse propagating
inside the 3D PhC (along the z- propagation direction, at the center of the xy- plane), for three frequencies: (a)
a/λ = 0.450, (b) a/λ = 0.468 and (c) a/λ = 0.496. (d) Broadband steady-state field intensity distributions at the
same propagation line. Steady-state field distributions obtained at the xz- plane of the center of the y- direction for the normalized operational frequencies equal to (e) a/λ = 0.450, (f) a/λ = 0.468 and (g) a/λ = 0.496. The magnitude of the field intensities are normalized by dividing the calculated intensities to the intensity produced by the source at the specific frequencies. The distances in the z- propagation direction are given with respect to the position of the source.
is observed, which originates from both facts that the upper cut-off region is nearly linearly dependent on the layer-to-layer distance (see Fig. 1(b)) and that the chirp function is varying linearly. One interesting observation from Fig. 3(d) is that the intensity enhancement is highly sensitive to the operation frequency. In particular, for the normalized operation frequency range a/λ = {0.42, 0.50} the maximum normalized intensities occurring at the localization regions deviate between 8 and 132. We attribute this deviation to the oscillations occurring between the turning point and the entrance of the structure. For instance, Fig. 3(a–c) suggest that the intensity enhancement is nearly equal for these frequencies, which is expected since the nearly linear cut-off variation will induce similar slowdowns for different frequencies, even though their steady-state intensity enhancements are much diversified, as indicated with white arrows in Fig. 3(d). The main difference between these two cases is that the steady state analysis is the response of a continuous source excitement, which comprises multiple enhance-ment factors such as slowing down and multiple interferences of the reflected waves from the turning point and at the entrance of the structure; whereas the time evolution analysis is the response of a source with a finite temporal pulse width, which includes only the slowing mechanism in terms of the intensity enhancement. We therefore believe that the oscillatory behavior of the intensity enhancement stems from the peculiar relation between the optical path and the local wave vector distribution. In this regard, for a specific frequency, the local wave vector distribution leads to such a local wavelength distribution that it will encounter constructive interferences within the optical path (which is also unique to the operational frequency). In other words, the slowing down of the wave will be accompanied by a structural resonance, which in result give rise to an additional enhancement factor. Such frequencies correspond to the narrowband peaks in Fig. 3(d) and one can infer from this figure that the spectral distance between these peaks decreases as the operational frequency increases. This is also reasonable, since increasing the frequency will cause the wave to localize and reflect further away from the entrance of the structure and to enter the structure with a wave vector away from the cut-off region, compared to lower operation frequencies. This will have the consequence that the wavelength distribution will initiate with lower spatial wave-lengths as the wave enters the structure21, in which case it will be enough to increase the operational frequency
less compared to lower frequencies, to match up the next constructively interfered frequency.
Furthermore, the steady state electric field intensities along the xz- plane at the middle of the structure in the
y- transverse direction were calculated and are shown in Fig. 3(e–g) for the normalized operation frequencies equal to a/λ = 0.450, 0.468 and 0.496; respectively. It follows from these figures that the intensity enhancements differentiate that from the pulse excitations, as expected. Furthermore, additional localization regions occur apart from the localization region at the turning point, since the abovementioned resonator effect will give rise to a standing wave within the respective optical path. Nevertheless, the local energy density at the turning points will be higher than at the additional localization regions, as the slowing down will become maximum at these points21.
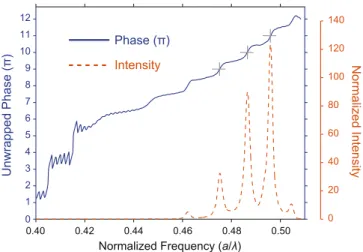
To quantitatively evidence our interpretation regarding the additional enhancement mechanism described above, we calculated the phase of the different frequency components at a particular position. Figure 4 shows the unwrapped phase of the electric field in the y- direction at the longitudinal position equal to 10.55a with respect to the front face of the structure. Moreover, the normalized intensity spectrum at the same spatial position is shown in Fig. 4. It follows that for the frequencies, at which the intensities are locally maximum, the phases are integer multiples of π. This is in accord with our abovementioned interpretation of the large enhancement factors, since a constructive interference between a specific path requires also the same amount of phase shift44.
Further numerical analyses were carried out to reveal the quantitative amount of propagation losses, which occur due to the finite transverse dimensions of the structure. The propagation losses were characterized by calculating the reflected power, by taking into consideration that in the case of a lossless propagation all incident power should be eventually reflected back after it is localized. The calculated reflected power is then normalized to the incident source power to give quantitative information about the loss spectra. Strictly speaking, since every frequency component will travel a different distance, it is more physically meaningful to normalize the loss to the distance travelled by the wave for every frequency component. The travelling distance has estimated as the
Figure 4. Accumulated phase and intensity enhancement relation. Superimposed phase and normalized
intensity spectrum. The unwrapped phases are calculated with respect to the phase at the entrance of the structure. The gray cross markers indicate the locations of the intensity peaks.
twofold of the distance between the entrance of the structure and the turning point, by taking into account the forward and backward propagation distances. Therefore, for a more accurate analysis one must take this fact into account. However, in the present calculations we ignore this fact and define the travelling distance as an effective distance travelled by the wave, excluding the additional round trips. Following this direction, the loss spectra is calculated for 7 (original structure) and 12 (extended structure) transverse periods and are superimposed in Fig. 5. It can be observed from this figure that for the normalized frequency interval a/λ = {0.44, 0.48} the prop-agation losses are lower than the rest of the operational frequency spectrum, which is expected as the TE-like transverse PBG does not compromise outside this interval, as was discussed. Another conclusion that can be drawn from Fig. 5 is that increasing the number of the transverse periods reduces the losses, as expected. It is worth noticing that the narrowband enhancement peaks in Fig. 3(d) matches well with the loss peaks in Fig. 5. As above discussed, the narrowband enhancement peaks arises from multiple roundtrips inside the structure, which lies also in the origin of the enhanced losses.
Experimental test.
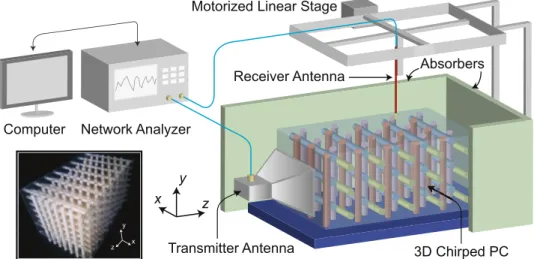
To verify the propagation characteristics experimentally in the microwave regime, the proposed structure was constructed from absorption free Al2O3 rods (see Fig. 6). Prior to performing theexperi-mental analyses, the coupling efficiency has been numerically estimated to be in the range of 65–71% and exper-imentally in the range of 62–74%. The numerical estimation was based on the termination of the simulations at the specific time step where the initial reflections due to air-PhC coupling mismatch have been completely gone through the reflection monitor. Experimentally, on the other hand, a strong microwave absorber was placed inside the PhC structure to similarly avoid the chirping reflections and to account only for the reflections aris-ing from the couplaris-ing mismatch. The discrepancy between the experimental and numerical estimations stems mainly from the additional reflections and interferences inside the receiver antenna’s metallic aperture and to the non-ideal absorption (approximately 95%) of the microwave absorber. In contrast to the calculations, in our
Figure 5. Lateral loss analysis. Superimposed loss spectra of the PhC structure, with 7 and 12 transverse
periods is shown. Note the oscillatory behavior, which is a direct consequence of the resonant propagation of the wave between the localization region and the input side of the structure.
Motorized Linear Stage
Receiver Antenna
Transmitter Antenna 3D Chirped PC
Computer Network Analyzer
z x y Absorbers y z x
Figure 6. Microwave experimental setup. Schematic illustration of the experimental setup is shown. The lower
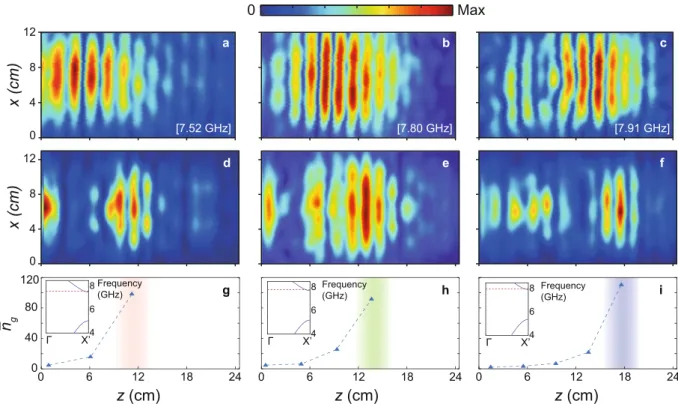
experimental setup (see Fig. 6) we could scan the electric field distribution only at the top surface of the structure. The monopole antenna was kept parallel to the y- axis and the tip of the antenna was placed 2 mm above the top of structure. A motorized linear stage was used to move the monopole antenna with 1 mm lateral resolutions in the x- and z- directions, as shown in Fig. 6. In this way, the y- component of the electric field at the top sur-face of the structure was measured and shown in Fig. 7(a–c) for frequencies equal to 7.52 GHz (a/λ = 0.450), 7.80 GHz (a/λ = 0.467) and 7.91 GHz (a/λ = 0.473), respectively. On the other hand, the electric field distribution was numerically calculated at the same surface and is in Fig. 7(d–f) for frequencies equal to 7.52 GHz, 7.80 GHz and 7.91 GHz, respectively. Comparing Fig. 7(a) with Fig. 7(d), Fig. 7(b) with Fig. 7(e) and Fig. 7(c) with Fig. 7(f), we note that the turning points in the numerical and experimental cases are in good agreement. We attribute the discrepancy in the field distributions between the two cases to the difference of the experimental and numerical source beam shapes.
To experimentally evidence that the group velocity of the propagating wave converges to zero towards the localization regions, we performed a series of time delay measurements45. Figure 7(g–i) show the measured
aver-age group indices ng for the frequencies equal to 7.52 GHz, 7.80 GHz and 7.91 GHz, respectively. We find that in
all three cases ng gradually increases towards the localization region. At these regions, ng varies between 90 and
110, which verifies the slow light originating localizations20. We should note that in theory one expects to obtain
zero group velocity at the localization regions, however there are two major factors that prevent obtaining such a measurement. The first one is the lateral losses occurring at the localization region, which impose an additional decay rate to the system and cause deviation of the group velocity from zero. The second one, which is rather a practical issue, is the difficulty to obtain the time delay measurements continuously along the longitudinal direc-tion. As was said above, due to the 3D periodicity of the structure, the time delay measurements had to be taken at discrete positions which transforms the τd = ∂ϕ/∂ω differential relation into a finite difference approximation.
To further reveal that the localized modes approach the band edge regions, the bandstructure in the propagation Γ-X′ direction for the instantaneous az periods at the localization regions were numerically calculated (see upper
left insets of Fig. 7(g–i)). One can infer from these figures that the localized modes are indeed close to the band edge region and, thus, are expected to be slowed down and be localized.
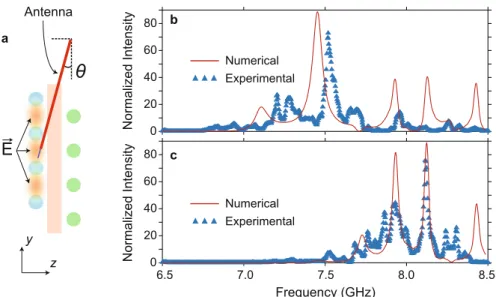
In view of the fact that the field distribution obtained at the top surface of the structure would not give any implication about the intensity enhancement, we further measured the electric field intensity spectrum at sin-gle points inside the structure (see Fig. 8(a)) to estimate the enhancement factors. Accordingly the normalized intensities were obtained at the center of the structural heights in the x- and y- directions and at a distance in the propagation z- direction equal to 5.15a = 9.25 cm and 9.55a = 17.15 cm with respect to the input side of
4 6 8 0 12 4 8 0 12 4 8
x (cm)
x (cm)
0 6 12 18 24z (cm)
0 6 12 18 24z (cm)
0 Max a c d f [7.52 GHz] [7.91 GHz] 0 6 12 18 24 b e [7.80 GHz]z (cm)
0 40 80 120n
g g h i Γ X’ Frequency (GHz) 4 6 8 Γ X’ Frequency (GHz) 4 6 8 Γ X’ Frequency (GHz)Figure 7. Steady-state field and group index measurements. (a–c) Experimentally measured and (c–e)
numerically calculated steady state electric field distributions at the top xz- surface of the structure for frequencies (a–d) 7.52 GHz, (b–e) 7.80 GHz and (c–f) 7.91 GHz are shown. Experimentally measured average group indices for frequencies (g) 7.52 GHz, (h) 7.80 GHz and (i) 7.91 GHz are given. The colored areas denote the localization regions. The upper left insets show the calculated bandstructure for layer indexes equal to 16, 20 and 24; which are determined as the localized positions of the frequencies 7.52 GHz, 7.80 GHz and 7.91 GHz, respectively. The dashed red lines reveal the operational frequencies.
the structure, and are superimposed with the regarding numerical calculations in Fig. 8(b,c), respectively. One can infer from these figures that the experimentally measured maximum intensities are around 72–74 for both cases, whereas the numerically calculated intensities are around 88–89. Moreover, one can observe that there are some spectral peak shifts and intensity differences between the numerical and experimental cases. We attributed these discrepancies to the structural fabrication errors, the non-uniform detection efficiency of the monopole antenna, the modified component of the detected electric field due to antenna tilting and the positional error of the detected area. Nevertheless, the experimental results verified that the wave can be enhanced and localized at various positions depending on its frequency.
Discussion
In summary, a chirped woodpile PhC, whose layer-to-layer distances are gradually decreased along the propa-gation direction, has been numerically and experimentally demonstrated to slow down and finally to trap and enhance different frequency components at different spatial positions. It has been argued that the Fabry-Perot interferences occurring between the turning points and the entrance of the structure together with the adiabatic slowing mechanism can lead to intensity enhancements close to two orders of magnitude. An experimental reali-zation at the microwave regime verified the operation principle, and we further note that the proposed structure is also feasible for current nanofabrication technologies, such as electron-beam lithography46 or direct laser writing
techniques47, 48, due to its simple layer-by-layer architecture and its robustness against fabrication disorders34, 35.
Furthermore we showed that the propagation losses can be suppressed, owing to the 3D periodicity of the struc-ture. Such a phenomenon could be exploited to realize nonlinear optical devices, broadband photon harvesting systems, wavelength division multiplexing devices and optical buffers. We should note however, that the light enhancement phenomenon in the proposed configuration should not be considered as a permanent storage of a ‘trapped rainbow’7, but rather a temporary localization, due to the finite trapping time caused by the reflection at
the turning points25, 49. It should be also noted that although high group indices up to 110 have been measured, a
zero group velocity near the localization region could not be obtained due to additional out-of-plane losses and experimental limitations.
Methods
The experimental setup and the construction of the 3D woodpile PhC structure.
Plates made of Plexiglas were employed to embody the constructed 3D PhC structure. By employing a laser engraving machine, holes were drilled inside the Plexiglas plates at the exact positions where the Al2O3 rods should be placed. Therefractive index of Plexiglas has been measured via Bragg condition50 to be equal to 1.59 and numerical analyses
revealed that placing the Plexiglas plates does not change the results significantly. The structural parameters are same as in the numerical calculations, where the in-plane period is set equal to a = 17.96 mm. The experimental setup (see Fig. 6), consists of a standard horn antenna, a monopole coaxial antenna and a vector network analyzer (Agilent 5071 C ENA). The horn antenna has an aperture size of 12.5 cm and 9.5 cm in the x- and y- directions, respectively, and is used to inject electromagnetic waves into the structure with electric field polarized in the
y- direction, whereas the monopole antenna is used to detect the radiated electromagnetic waves. Furthermore,
the experimental setup was covered with microwave absorbers to minimize the noise due to environmental reflections.
Figure 8. Field enhancement measurements. (a) Schematic description of the measurement of the electric field
intensity inside the structure. The numerically calculated and experimentally measured electric field intensity spectra, obtained at the center of the xy- plane and at a distance equal to (b) 9.25 cm and (c) 17.15 cm in the z- direction with respect to the input of the structure are superimposed.
Measurement of the time delay.
The time delay is a measure of the photon transit time and is defined asτd = ∂ϕ/∂ω, where ϕ is the phase difference between the input and output port of the vector network analyzer and
ω is the operational angular frequency. Since the 3D periodicity of the woodpile PhC structure prevents to take a continuous spatial measurement along the longitudinal z- direction, we injected the receiver antenna inside the PhC structure with a tilting angle of 16° with respect to the y- axis until the center of the structural height at spe-cific points. The difference of the time delays measured at these points have been divided to the corresponding point-to-point spatial distance to obtain the average group velocity, which is then divided to the speed of light in free space to estimate the average group index ng.
Measurement of the intensity enhancement.
The monopole antenna was inserted into the structure until the tip of the antenna reaches the center of the structural height in the y- direction. Keeping in mind that the monopole antenna should be parallel to the polarization axis of the injected electric field, the fact that the electric field is localized mostly between the rods that are perpendicular to the polarization axis inhibits the monopole antenna to be inserted parallel to the polarization axis. Therefore, as shown in Fig. 8(a) the monopole antenna was inserted from the neighboring layer inside and was tilted towards the region of interest with an angle of 16°. The measured electric field intensity was then normalized by the intensity measured with the same tilt angle at the center of the aperture of the transmitter horn antenna.References
1. Krauss, T. F. Why do we need slow light? Nat. Photonics 2, 448–450 (2008).
2. Hau, L. V., Harris, S. E., Dutton, Z. & Behroozi, C. H. Light speed reduction to 17 metres per second in an ultracold atomic gas.
Nature 397, 594–598 (1999).
3. Turukhin, A. V. et al. Observation of ultraslow and stored light pulses in a solid. Phys. Rev. Lett. 88, 023602 (2002).
4. Smith, D. U., Chang, H., Fuller, K. A., Rosenberger, A. T. & Boyd, R. W. Coupled-resonator-induced transparency. Phys. Rev. A - At.
Mol. Opt. Phys. 69, 63804–1 (2004).
5. Totsuka, K., Kobayashi, N. & Tomita, M. Slow light in coupled-resonator-induced transparency. Phys. Rev. Lett. 98, 213904 (2007). 6. Kurt, H., Ustün, K. & Ayas, L. Study of different spectral regions and delay bandwidth relation in slow light photonic crystal
waveguides. Opt. Exp. 18, 26965–26977 (2010).
7. Tsakmakidis, K. L., Boardman, A. D. & Hess, O. ‘Trapped rainbow’ storage of light in metamaterials. Nature 450, 397–401 (2007). 8. Yang, R., Zhu, W. & Li, J. Realization of ‘Trapped Rainbow’ in 1D slab waveguide with Surface Dispersion Engineering. Opt. Exp. 23,
6326–6335 (2014).
9. Gan, Q., Fu, Z., Ding, Y. J. & Bartoli, F. J. Ultrawide-bandwidth slow-light system based on thz plasmonic graded metallic grating structures. Phys. Rev. Lett. 100, 256803 (2008).
10. Gan, Q., Ding, Y. J. & Bartoli, F. J. ‘Rainbow’ trapping and releasing at telecommunication wavelengths. Phys. Rev. Lett. 102, 056801 (2009).
11. Chen, L., Wang, G. P., Gan, Q. & Bartoli, F. J. Trapping of surface-plasmon polaritons in a graded Bragg structure: Frequency-dependent spatially separated localization of the visible spectrum modes. Phys. Rev. B 80, 161106 (2009).
12. Gao, X. et al. Ultrathin dual-band surface plasmonic polariton waveguide and frequency splitter in microwave frequencies. Appl.
Phys. Lett. 102, 151912 (2013).
13. Zhou, Y. J. & Cui, T. J. Broadband slow-wave systems of subwavelength thickness excited by a metal wire. Appl. Phys. Lett. 99, 101906 (2011).
14. Yang, Y., Shen, X., Zhao, P., Zhang, H. C. & Cui, T. J. Trapping surface plasmon polaritons on ultrathin corrugated metallic strips in microwave frequencies. Opt. Exp. 23, 7031–7037 (2015).
15. Stockman, M. Nanofocusing of Optical Energy in Tapered Plasmonic Waveguides. Phys. Rev. Lett. 93, 137404 (2004).
16. Gan, Q. & Bartoli, F. J. Surface dispersion engineering of planar plasmonic chirped grating for complete visible rainbow trapping.
Appl. Phys. Lett. 98, 251103 (2011).
17. Jang, M. S. & Atwater, H. Plasmonic rainbow trapping structures for light localization and spectrum splitting. Phys. Rev. Lett. 107, 207401 (2011).
18. Gan, Q. et al. Experimental verification of the rainbow trapping effect in adiabatic plasmonic gratings. Proc. Natl. Acad. Sci. USA.
108, 5169–5173 (2011).
19. Shen, Y., Fu, J. & Yu, G. Rainbow trapping in one-dimensional chirped photonic crystals composed of alternating dielectric slabs.
Phys. Lett. Sect. A Gen. At. Solid State Phys. 375, 3801–3803 (2011).
20. Engelen, R. J. P., Mori, D., Baba, T. & Kuipers, L. Two regimes of slow-light losses revealed by adiabatic reduction of group velocity.
Phys. Rev. Lett. 101, 103901 (2008).
21. Baba, T., Mori, D., Inoshita, K. & Kuroki, Y. Light localizations in photonic crystal line defect waveguides. IEEE J. Sel. Top. Quantum
Electron. 10, 484–491 (2004).
22. Kurt, H. & Yilmaz, D. Rainbow trapping using chirped all-dielectric periodic structures. Appl. Phys. B. 110, 411–417 (2013). 23. Hu, H., Ji, D., Zeng, X., Liu, K. & Gan, Q. Rainbow Trapping in Hyperbolic Metamaterial Waveguide. Sci. Rep. 3, 1249 (2013). 24. Romero-García, V., Picó, R., Cebrecos, A., Sánchez-Morcillo, V. J. & Staliunas, K. Enhancement of sound in chirped sonic crystals.
Appl. Phys. Lett. 102, 091906 (2013).
25. Liu, K. & He, S. Truly trapped rainbow by utilizing nonreciprocal waveguides. Sci. Rep 6, 30206 (2016).
26. Tsakmakidis, K. L., Boardman, A. D. & Hess, O. Can light be stopped in realistic metamaterials? Nature 455, E10–E11 (2008). 27. He, J., Jin, Y., Hong, Z. & He, S. Slow light in a dielectric waveguide with negative-refractive-index photonic crystal cladding. Opt.
Exp 16, 11077–11082 (2008).
28. Cardenas, J. et al. Low loss etchless silicon photonic waveguides. Opt. Exp 17, 4752 (2009).
29. Li, J., O’Faolain, L., Schulz, S. A. & Krauss, T. F. Low loss propagation in slow light photonic crystal waveguides at group indices up to 60. Photonics Nanostructures - Fundam. Appl 10, 589–593 (2012).
30. Hughes, S., Ramunno, L., Young, J. F. & Sipe, J. E. Extrinsic optical scattering loss in photonic crystal waveguides: Role of fabrication disorder and photon group velocity. Phys. Rev. Lett. 94, 033903 (2005).
31. Ek, S. et al. Slow-light-enhanced gain in active photonic crystal waveguides. Nat. Commun. 5, 5039 (2014). 32. O’Faolain, L. et al. Loss engineered slow light waveguides. Opt. Exp 18, 27627–27638 (2010).
33. O’Faolain, L. et al. Dependence of extrinsic loss on group velocity in photonic crystal waveguides. Opt. Exp 15, 13129–13138 (2007). 34. Fan, S., Villeneuve, P. R. & Joannopoulos, J. D. Theoretical investigation of fabrication-related disorder on the properties of photonic
crystals. J. Appl. Phys. 78, 1415–1418 (1995).
35. Özbay, E. et al. Measurement of a three-dimensional photonic band gap in a crystal structure made of dielectric rods. Phys. Rev. B
50, 1945–1948 (1994).
36. Smolyaninova, V. N., Smolyaninov, I. I., Kildishev, A. V. & Shalaev, V. M. Experimental observation of the trapped rainbow. Appl.
48. Trull, J. et al. Formation of collimated beams behind the woodpile photonic crystal. Phys. Rev. A - At. Mol. Opt. Phys. 84, 033812 (2011).
49. He, S., He, Y. & Jin, Y. Revealing the truth about ‘trapped rainbow’ storage of light in metamaterials. Sci. Rep. 2, 1–9 (2012). 50. Shu, X., Gwandu, Ba, Liu, Y., Zhang, L. & Bennion, I. Sampled fiber Bragg grating for simultaneous refractive-index and temperature
measurement. Opt. Lett. 26, 774–776 (2001).
Acknowledgements
Authors acknowledge financial support of NATO SPS research grant No: 985048. K.S. acknowledges financial support of Spanish Ministerio de Ciencia e Innovación and European Union FEDER through project FIS2015-65998-C2-1-P. H.K. also acknowledges partial support of the Turkish Academy of Science.
Author Contributions
Z.H., H.K. and K.S. contributed to the discussions, concept development, analysis of the numerical and experimental results, data processing, writing and reviewing of the manuscript.
Additional Information
Competing Interests: The authors declare that they have no competing interests.
Publisher's note: Springer Nature remains neutral with regard to jurisdictional claims in published maps and
institutional affiliations.
Open Access This article is licensed under a Creative Commons Attribution 4.0 International
License, which permits use, sharing, adaptation, distribution and reproduction in any medium or format, as long as you give appropriate credit to the original author(s) and the source, provide a link to the Cre-ative Commons license, and indicate if changes were made. The images or other third party material in this article are included in the article’s Creative Commons license, unless indicated otherwise in a credit line to the material. If material is not included in the article’s Creative Commons license and your intended use is not per-mitted by statutory regulation or exceeds the perper-mitted use, you will need to obtain permission directly from the copyright holder. To view a copy of this license, visit http://creativecommons.org/licenses/by/4.0/.