Emerging Markets Review xxx (xxxx) xxx
Available online 8 January 2021
1566-0141/© 2021 Elsevier B.V. All rights reserved.
Balance sheet effects of foreign currency debt and real exchange
rate on corporate investment: evidence from Turkey
Serkan Demirkılıç
Department of International Trade and Finance, Kadir Has University, Cibali Mah. Kadir Has Caddesi, Fatih, Istanbul 34083, Turkey
A R T I C L E I N F O JEL: Codes: E22 F31 F41 G31 G32 O16 Keywords: Balance sheet effects Currency mismatch Corporate investment Corporate debt Foreign currency debt
A B S T R A C T
I analyze the balance sheet channels of depreciation of the Turkish non-financial corporations for 2003–2015. Having constructed a novel, hand-collected firm-level dataset on the composition and term structure of foreign currency assets and liabilities, I show that foreign currency debt and mismatch has a significant negative balance sheet effect on capital investment following a depreciation. The results remain same even after controlling for foreign currency assets and ex-ports. This implies that the contractionary net worth effect of depreciation dominates its expansionary competitiveness effect. The result is more pronounced for the firms with short-term foreign currency exposures.
1. Introduction
Global Financial Crisis (GFC) of 2007–2009 has reignited the discussions on the role of the currency composition of debt and its term structure in both micro fragilities and full-fledged crisis in developing countries. Following GFC, increase in the size and the pace of foreign currency (FX) debt of non-financial corporations (NFCs) has been argued as a potential source of fragility in emerging market economies (EMEs). Firms take the risk of an unexpected depreciation in domestic currency by holding FX debt in their balance sheets. An unexpected depreciation inflates the domestic currency value of FX liabilities, and deflates the FX value of domestic currency assets. Thus, depreciation leads to a real melt-down in balance sheet net worth.
In addition to the net-worth effect, depreciation also leads to deterioration in the balance sheet through maturity mismatch and interest rate channels. If much of the FX debt is short term, and firms’ short-term earnings are not sufficient to pay their short term liabilities, then a depreciation in the domestic currency leads to a maturity mismatch in debt services by inflating short-term indebtedness. Hence, firms may need to borrow more to rollover their outstanding debt. Moreover, if the meltdown in net worth is substantial, firms may not be able borrow because of the increase in their risk premium. Even if they manage to borrow, the cost of borrowing-interest rate- will likely be substantially higher. As a result, firms will constantly try to roll over their outstanding debt by borrowing more. Meltdown in net worth, deterioration in debt services, and increase in cost of borrowing are likely to constrain firms’ productive expenditures.
Traditional open economy models do not take this balance sheet channel into account while analyzing the stabilizing effects of E-mail address: [email protected].
Contents lists available at ScienceDirect
Emerging Markets Review
journal homepage: www.elsevier.com/locate/emrhttps://doi.org/10.1016/j.ememar.2021.100796
currency depreciation on the monetary policy and international trade. For instance, according to the Mundell and Fleming model,1 assuming the Marshall-Lerner conditions hold, depreciation in the domestic currency is assumed to have an expansionary effect on domestic output through an increase in export. However, as shortly discussed above, when domestic firms carry substantial amount of un-hedged FX debt on their balance sheets, a significant deterioration in balance sheet net worth due to depreciation may lead firm level investment, sales, and profitability to decline. As a result, the expected expansionary effect of depreciation on output through the trade channel might be limited, or even be reversed, i.e., depreciation may have a contractionary effect.
The East Asian Crises of 1990s have proved that excessive reliance on short-term and unhedged foreign currency debt of firms led to financial fragilities. Earlier works in this area have developed theoretical links between balance sheet net worth and firm output.
Bernanke et al. (1999) demonstrated that investment can be constrained by the erosion in the net wealth due to an increase in the firm
leverage. Along the same line, Krugman, Paul. R. (1999), Aghion, Bacchetta, and Banerjee (2001), and C´espedes et al. (2004) argued that depreciation could decrease firm level activities through the deterioration in the balance sheet net worth. The melt down in net worth deteriorates creditworthiness that leads to increase the risk premium for firms, which in turn further increases indebtedness by making higher interest payment. As a result, firm-level productive activities are likely to be constrained.
Previous empirical studies on the impact of FX indebtedness on the firm-level activities through depreciation are mixed and inconclusive. Bleakley and Cowan (2002) is one of the earlier cross-country firm-level study that explores the balance sheet net-worth channel of exchange rate fluctuations through firm-level FX indebtedness in select Latin American countries. They find no evidence of contractionary net worth effect of exchange rate fluctuations. On the contrary, they find a positive composite balance sheet effect.
Bleakley and Cowan (2002) sparked off a new wave of empirical research on the question. Following individual country analyses find
mixed evidences on the sign and the significance of balance sheet effect of FX indebtedness through depreciation. Echeverry et al.
(2003) show that while depreciation adversely affects firms’ profitability, the negative balance sheet effect is not significant for firm-
level investment to be constrained in Colombia. Bonomo et al. (2003) find no evidence of significant negative balance sheet effect on investment in Brazil. Benavente et al. (2003) present some evidences that devaluation increases investment of FX indebted firms in Chile in the aftermath of the East Asian Crisis between 1994 and 2001.
On the other hand, several studies find significant negative balance sheet effects of deprecation on firm output. Pratap et al. (2003),
and Aguiar (2005) find negative balance sheet effect in the aftermath of the Tequila Crisis in Mexico where exporting firms were more
indebted in foreign currency. They argue that firm-level investment in Mexico was constrained because of the deterioration in the balance sheet net worth due to the increase in short term FX indebtedness in the aftermath of the depreciation in Peso. Cowan et al.
(2005) provide evidences of very strong negative balance sheet effect that constrained investment expenditure in Chilean non-financial
firms. Tkalec and Verbic (2012) and Endr´esz and Harasztosi (2014) illustrate that balance sheet “Euroization” negatively affects in-vestments and sales in Croatian and Hungarian non-financial firms respectively. Barajas et al. (2016) and Kim (2016) find negative net worth effects for Colombian and Korean firms respectively. Kalemli-Ozcan et al. (2016) also provide evidences on negative effects of depreciation on investment for select Latin American countries. They demonstrate that domestic exporters with un-hedged FX debt on their balance sheet experience a decrease in investments. ´Alvarez and Hansen (2017) find strong negative balance sheet effect on investment, but find not statistically differential effect on firm profitability for Chilean firms. Hardy (2018) finds mixed results for Mexican firms. He finds that larger firms see an increase in their investment and employment whereas smaller firms face no employment growth and experience lower investment growth.
Studies on the Turkish case are scarce and limited to sectoral analyses. Alp (2013), Kesriyeli et al. (2011), and Adanur Aklan, and
Nargeleçekenler (2010) analyze sectoral composition of FX indebtedness and all of those studies find that sectors with higher debt
dollarization are generally exporters, and real depreciation in domestic currency decreases real investment. G¨onenç et al. (2005) is the only firm level study that finds a negative impact on investment for the period of 2000 - 2003.
In this paper, I explore whether FX indebtedness and FX mismatch constrain firm-level capital expenditure through exchange rate fluctuations for the Turkish non-financial firms for the period of 2003 to 2015. By exploring the impact of firm level FX indebtedness and FX mismatch on firm performance, this paper aims to contribute to recent discussions and concerns over the impact of capital flows to EMEs in the aftermath of the GFC of 2007–2009. The results of this study may provide insights on whether FX indebtedness causes slow-down in investment in countries where domestic firms are highly dollarized, focusing on the context of the Turkish nonfinancial firms. This paper will also help us understanding the micro-macro dimension of some of the fragilities in non-financial firms rooted in balance sheet mismatches. The empirical findings will contribute and extend earlier literature by providing an up-to-date and thorough assessment of the impact of FX indebtedness and FX mismatch of firm balance sheets on capital investment through depreciation.
The empirical analysis in this paper suggests that FX leveraged firms invest less in the aftermath of a depreciation. This result implies that contractionary net-worth effects of depreciation dominate expansionary competitiveness effect of depreciation in Turkish NFCs. The finding is robust to various robustness checks and alternative econometric techniques. To the best of my knowledge, this is one of the few firm-level empirical analysis finds that the contractionary net-worth effects of depreciation dominates the expansionary competitiveness effects, without conditioning on any competitiveness factors such as export and import in the regression.
The rest of the paper is structured as follows. Section 2 presents and describes the data, and section 3 presents the empirical strategy. In section 4, I discuss the empirical findings of the estimations. Section 5 presents sensitivity analyses of the baseline results. Lastly, I discuss the importance of the findings, and conclude the paper in section 6.
2. Data
The dataset consists of standard balance sheet and income statement information of 425 listed and 25 non-listed2 Turkish NFCs spanning from 2003 to 2015. I hand-collected the information on FX holdings from the footnotes of the firms’ financial statements. Listed firms must disclose footnotes of their financial statements along with their accounting information. They are subject to strictly follow standardized accounting rules. Sources of these footnotes are Istanbul Stock Exchange (ISE), Public Disclosure Platform (PDP), and Turkish Capital Market Board (CMB). Data availability limits me to work with listed firms because in Turkey only listed firms and firms those raise capital through stock exchange are obliged to disclose their financial statements and their footnotes by law. Table 1
displays the summary statistics of the variables used in the regressions.
The dataset is unique in that it has detail information on both FX liabilities and FX assets of NFCs. To the best of my knowledge, with few exceptions such as Kim (2016), Alvarez and Hansen (2017) and Hardy (2018), existing datasets in the literature do not have information on firm-level FX assets. Therefore, empirical analyses only focus on total foreign debt as the measure of FX exposure. However, if firms hold both FX assets and FX debts, the effect of depreciation on the balance sheet is ambiguous and will depend on the relative sizes of FX assets and FX debts. Therefore, having information on FX assets enables an accurate measure of FX exposure. The dataset used in this paper contains detailed information on the size and the maturity of FX assets.
Firms in our sample hold on average 11% of their assets in FX, and they carry on average 25% of their debt in FX. Overall, firms in the dataset carry out 14% foreign currency open position as presented in Fig. 1. FX asset accumulation remain almost constant and fell behind FX debt accumulation; hence NFCs had foreign currency open position during 2003–2015. While FX open position widens up from 2007 to 2010, the scissors start narrowing after 2010. The Fig. 1 shows that the main reason behind the decrease is the fact that firms limit their FX indebtedness starting from 2012 due to the excessive depreciation in the domestic currency.
In addition to the level of FX debt, information on the term structure of the FX debt and FX mismatch is important to analyze the impact of FX exposure. If firms hold a significant portion of FX debt in short term, depreciation may lead to a significant increase in the short term liabilities relative to short term assets which results in a maturity mismatch in firms’ debt services. Therefore, a thorough analysis of FX exposure through depreciation also requires detail information on the term structure of the FX debt. The dataset dif-ferentiates maturity structure of FX holdings as short term and long term. The descriptive statistics shows that whereas firms hold 10% of their FX assets in short term, they hold 17% of their FX debt in short term. The left panel of Fig. 2 displays the trends in the short and long term foreign currency debt ratios. We observe that both total and short-term FX debt as a ratio of total asset increases until 2010 and then start decreasing. On the other hand, the average dollarization ratio, foreign currency debt to total liabilities, is 40%. Similarly, the liability dollarization has a decreasing trend after 2008 as well.
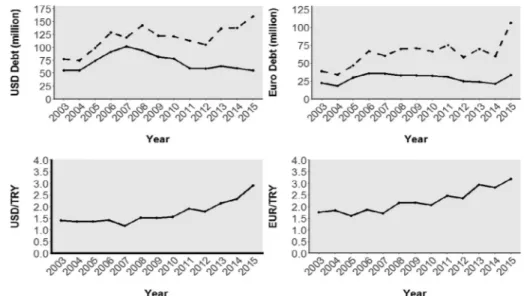
The foreign currency choice of debt may also be crucial in analyzing FX exposure. If firms shuffle the shares of their FX debt among different currencies i.e. US Dollar to Euro, or vice versa, the extent of fluctuations in different currencies will affect the balance sheet differently. On average, 65% of FX debt is in US dollars, and 30% is in Euro in the dataset. The remaining 5% is denominated in other currencies. Fig. 3 displays the relationship between both original and the Turkish Lira values of USD and EUR debts and nominal exchange rates. As displayed, when Turkish Lira vis-a-vis US Dollar depreciates starting from 2012, firms decreases their USD and EUR debts in original currencies whereas the Turkish Lira value of their debts increase faster than the decrease in their debt in original currencies. Obviously, firms reshuffle their FX debt composition due to the depreciation in currencies.
Information regarding firms’ income linked to a foreign currency is crucial to evaluate the extent of natural hedging of firms. Firms that expect their future earnings to increase as a result of depreciation may also be the firms that carry more FX debts. Hence, the information on firms’ export revenue is crucial to assess firms’ capabilities of natural hedging. Information on foreign sales is available in the footnotes. Whenever foreign sales information is missing, I fill the gaps by using Istanbul Chambers of Industry’s (ICI) manufacturing sector datasets for the common firms in the datasets.3 Similarly, FX debt burden of importing firms increases due to depreciation. As much as import can boost investment and earnings, the increase in import cost due to depreciation may constrain investment. However, only 40% of firm-year observations of import data are available in the dataset. While the average export to sales ratio of the firms is 26%, the import to sales ratio is 24%.
A thorough analysis of currency exposure requires information on off-balance sheet positions. Foreign currency derivatives can substantially reduce currency exposure risk in the balance sheet. Due to inconsistencies in accounting standards over time, currency composition of financial derivatives such as forwards, futures, swaps have not been recorded separately on the balance sheet. The information on the uses of derivatives improves starting from 2008 because the regulators imposed new requirements for firms to report such transactions separately. Before 2008, such transactions could be recorded within a specific balance sheet item or as ‘other’. As long as reported, our dataset contains information on derivative position of the balance sheet activities. The dataset indicates that only a few of the largest firms in the sample use FX derivatives to hedge their FX assets and liabilities. Specifically, 80 firms, which consist of 271 year-firm observation have information on currency derivatives.7 Given these limitations, we cannot effectively uncover the effect of the use of the derivatives on hedging in our analyses.
In addition to standard accounting information, the dataset also contains information regarding the institutional aspects of firms,
2 The non-listed firms are those have raised capital through the stock market. Although they are not listed, they have to be approved by Capital
Market Board (CMB), and they are required to disclose their financial statements based on the level of activities they engage in. The source of the information for non-listed firms is the Capital Market Board’s web page.
3 Every year Istanbul Chambers of Industry(ICI) publishes main accounting information of its member manufacturing firms. 254 firms in my
including; ownership structure, multinational affiliation, mergers, acquisitions, and privatizations, and the average number of workers employed in a given year. Firms’ sectoral classification, ownership structure, and affiliation are particularly important when there are fluctuations in the domestic and international credit conditions. For example, foreign and bank affiliated firms can relatively easily gain access to both domestic and international credit markets. Likewise, firms operate in the tradable sectors are expected to increase their FX earnings due to depreciation. The availability of such information will allow me to evaluate FX debt exposure based on these firm characteristics. Table 2 displays the number of firms and total observations in each year based on firm characteristics.
Firms in the dataset operate in 8 different main non-financial sectors,4 and 77% of them are in the manufacturing sector. I classify the firms up to 3-digit ISIC-REV2 (International Standard Industrial Classification Revision2) industry codes. These classifications provide information on firms’ production mix, and allow me to control for any industry effect at different levels of aggregation. Due to entry and exit, mergers, acquisitions and bankruptcy, the panel is unbalanced. The reasons behind these annual changes can poten-tially be informative. For example, it is important to control for mergers, acquisitions, and privatization that leads to change in the sample size. Firms that are subject to mergers and acquisitions generally experience a significant increase in their fixed assets and investment due to consolidation of balance sheets. Likewise, firms exit and hence drop out of the sample due to bankruptcy. If the exiting firms have higher ratio of foreign debt, then we will observe an artificial reduction in average FX indebtedness. Identifying and controlling for corporate events helps me avoid potential accounting and selection biases built into the sample. Firms that experienced corporate events including mergers, acquisitions, and privatizations are indicated by a dummy variable that takes on the value one starting the year of the event.
If a firm has a parent-bank and holding-, or a foreign affiliation, it is indicated by a dummy variable that takes the value of one and zero otherwise. The dataset allows me to construct different measures of foreign affiliation.5 First, if a firm is multinational, and if foreigners hold any share of a firm, regardless of the percentage of the share, firm is categorized as “foreign”. If a firm is multinational, and if the foreign share of a firm is greater than 10%, it is categorized as “foreign-controlled”. Similarly, if a firm is multinational, and if foreigners own the larger share, it is categorized as “foreign-owned”. Foreign share decreases starting from 2009, and the average foreign share is 21%. Sixty-one percent of the firms have a parent affiliation, 49% of them are mature by age, 59% is large in terms of labor employed, 76% operates in the tradable sector, and 77% is exporters.
Several cautionary remarks are necessary in terms of limitations of the dataset. First and foremost, this dataset is a product of a manual hand collection from financial reports, hence potential errors are inevitable. With this point in mind, I dropped all inconsistent firm-year observations. In particular, I dropped observations if short-term assets exceed total assets, and if accounting variables did not accord with sign conventions. The dataset only covers listed firms and a few non-listed firms that raise capital thorough the stock exchange. Therefore, sample selection bias is unavoidable, and is a result of data availability. The sample consists of a mix of consolidated and nonconsolidated financial statements; however, most of the information is based on consolidated balance sheets.6 Unfortunately, accounting standards significantly differs before and after 2003. Therefore, I work with the firms those adopted IFRS between 2003 and 2015. I excluded firms that choose to report their financial statements in a foreign currency other than Turkish Lira. I only considered firms that report their financial statements through January 1st to December 31st.
Whenever a balance sheet and an income statement item are reported in a foreign currency, I converted it into Turkish Lira by using the end of the year and the average of the year exchange rate respectively. I converted all nominal accounting variables into real by using the manufacturing producer price index (MPPI), (OECD, 2010 = 100).
3. Empirical strategy
The empirical strategy of the paper follows the framework suggested by Bleakley and Cowan (2008) and extends it in several ways. The empirical strategy centers on the estimation of the interaction of the lagged FX exposure with the logarithmic change in the real exchange rate:
βBS(FX exposurei,t− 1x logarithmic change in real exchange ratet )
The FX exposure is the book value of FX debt and FX mismatch, the difference of FX debt, FX asset and FX derivatives, that is converted into Turkish Lira by using the end of year exchange rate, and then normalized by the total asset. The real exchange rate (e) is constructed as the end of year nominal Turkish Lira value of US Dollar multiplied by the ratio of the end of the year US to Turkish consumer price indices. Hence, in this definition, an increase in the real exchange rate leads to a depreciation in the domestic currency vis-`a-vis the US Dollar.
I specify the following fixed-effects regression to assess the impact of FX indebtedness on firms’ capital expenditure through ex-change rate fluctuations:
4 They are agriculture, mining, manufacturing, construction, energy, transport and communication, retail and wholesale, and others (including,
administrative activities, recreational activities, health-education, and other services).
5 I compiled the ownership structure, and foreign affiliations information from the balance sheet footnotes. However, this information was not
complete in the financial footnotes. To complete this information, I used the ICI dataset in which the percentage of firms’ ownerships as foreign, private and public is presented in details.
6 By law, as long as firms disclose their consolidated financial statements, they do not have to disclose their sole financial statements in Turkey. Hence, data availability prevents me from compiling data on sole balance sheets.
yi,t=αyi,t− 1+βBS
(
fxdebti,t− 1×∆et
)
+βXXi,t− 1+λj x t+εi,j,t (1)
where subscripts i, j and t stand for firm, industry, and year respectively. The growth rate of firm-level capital expenditure (y) is the logarithmic change in tangible fixed assets, net of depreciation. The coefficient of the interaction term, βBS is a point estimate of the differential effect of exchange rate fluctuations on firm investment with different level of FX debt. Because this interaction contains all exchange rate related factors due to FX holdings, βBS measures the composite effects of both the expansionary trade effect and the contractionary balance sheet channels of depreciation. Therefore, the sign of the coefficient is ambiguous, and depends on the relative strengths of the competitiveness and the net-worth effects of depreciation. If the expansionary competitiveness effect dominates the contractionary net-worth effect, then the estimated coefficient will be positive, and vice versa.
Vector X denotes firm-level pre-determined accounting variables as the ratio of total asset, including the total leverage ratio (total liabilities/total assets) and its interaction with the logarithmic change in real exchange rate as well as the main effects of FX debt, total leverage and lagged dependent variable. The main effect of lagged FX debt absorbs any pre-existing differences among firms with different levels of FX indebtedness. Lagged total leverage is included to control for any pre-existing differences among firms’ ex-penditures such as expanding production and renewing production technologies. The lagged-dependent variable controls for any pre- existing differences among firms’ capital expenditures which tends to be persistent. Finally, the natural logarithm of total asset as size, and firm age control for firms’ access to credit. Based on the analyses, X includes FX asset, net FX derivative position, export to sales, import to sales, operating income to asset and their interaction with log change in real exchange rate; as well as the time-varying firm characteristics such as firms’ foreign, bank and parent affiliations and their interaction with exchange rate.
As the real exchange rate is fixed for each firm in each year, year dummies replace it. The industry-by-year dummies (λ)7 control for the time varying differences among industries in our sample such as changes in demand or production costs. Finally, standard errors (ε) are clustered by firm. Thus, the baseline regression is as following:
yi,t=αyi,t− 1+βBS
(
fxdebti,t− 1x Δet+β2
(
fxdebti,t− 1+β3
(
debti,t− 1x Δet+β4
( debti,t− 1
)
+β5(log total asseti,t− 1
)
+β6(age dummyi,t− 1
) +λjxt+εi,j,t
(2) If firms expect their current and future earnings to increase with depreciation, they may hold more FX debt with the expectation of matching their debt with their earnings. To account for this matching hypothesis, I follow Bleakley and Cowan (2008) and estimate the baseline regression in which dependent variable is from the future (t + 1) and exchange rate is contemporaneous (t) to the lagged dependent variable (LDV). Specifically, I estimate the following specification;
yi,t+1=αyi,t+βBS
(
fxdebti,t×∆et
)
+βXXi,t+λj x t+εi,j,t (3)
Before proceeding, explanations regarding the baseline specification and estimation strategy are in order. First of all, by interacting FX debt and real exchange rate, I explicitly argue for the existence of non-linear and differential effects of FX debt on investment based on the differential levels of exchange rate. Second, the baseline regression does not control for unobserved heterogeneities among firms, but it does for industries. Firm fixed-effects along with LDV lead to “dynamic panel bias” (Nickell, 1981). Therefore, my limited treatment of firm heterogeneity might be considered a weakness. I address this in detail in section 5.2 and show that the baseline results are not biased despite the limited control for the differences among firms. Third, the fact that the baseline specification includes only debt variables may be considered too restrictive for an investment regression. However, this is a deliberate choice. The purpose of this exercise is not to uncover the determinants of investment; rather to focus only on one of the determinants-FX indebtedness through exchange rate fluctuations-, and to assess its impact through the trade and the balance sheet channels. Hence, I start with debt var-iables, and subsequently augment the baseline regression to control for whether the results are sensitive to any correlates of exchange rate, investment, and FX indebtedness.
4. Estimation results 4.1. Main results
The empirical analyses start with the estimation of the baseline regression suggested in Eq. 1. Table 3 presents the results of the baseline estimation, where in columns 1–3, the dependent variable and the real exchange rate are from the current period (t), and the micro variables8 are contemporaneous to the lagged dependent variable (t + 1). To account for the matching hypothesis, columns 4–6 display the baseline estimation where dependent variable is from the future period (t + 1) and the real exchange rate and micro variables are contemporaneous to the lagged dependent variable (t).
The baseline estimation starts with estimating the interaction of FX debt with the logarithmic change in real exchange rate (fxdebti, t− 1 ×∆et) and the main effect of the lagged FX debt.9 As column 1 displays that the estimated coefficient of the variable of interest is negative although not significant at conventional levels. This initial estimation suggests that composite balance sheet effect is negative
7 Industry dummies are constructed based on 3-digit ISIC-Rev.2 codes.
8 Micro variables refer to firm-level variables. Alternatively, macro variables refer to real exchange rate and credit variables.
for our sample. Next, I augment the specification by including the interaction of total debt with the logarithmic change in exchange rate, and the main effect of total debt to control for any pre-existing differences among firms’ level of expenditures. Inclusion of total debt significantly increases the negative value of the estimated composite balance sheet effect. Finally, adding the lagged-dependent variable to control for any pre-existing differences in firms’ differential level capital expenditure reaches me to the final specification. As seen in column 3, in this final specification, the estimated effect of the FX indebtedness through exchange rate fluctuations (fxdebti, t− 1 ×∆et) is still negative and statistically significant. The findings of the baseline estimation suggest that FX indebted firms invest less in the aftermath of a depreciation.
Because the estimated coefficient does not provide us the marginal effect, I visualize the marginal effect of the real exchange rate on investment with the different level of foreign currency debt. As displayed in Fig. 6, investment growth has a negative relationship with foreign currency debt through depreciation, and when foreign currency debt exceeds its mean, investment growth becomes negative. On the other hand, all else is constant, one standard deviation (around 12%) depreciation in real exchange rate decreases the in-vestment by around 11% through the interaction term, (fxdebti, t− 1 ×∆et).
The estimation of the dependent variable from period (t + 1) suggests partial matching to a certain extent. Although the effect of the interaction between FX debt and exchange rate are negative in column 4, as columns 5–6 show that they are positive although not significant. Furthermore, the coefficients of the main effect of FX debts are always negative in column 5–6. Although not significant, these results suggest some evidences that FX indebted firms expect their future investment to increase with depreciation.
4.2. The trade and balance sheet channels of exchange rate and FX debt
The absence of positive composite balance sheet effect indicates that the contractionary effect of depreciation dominates its expansionary effect. To get a better idea about the relative strengths of these contractionary balance sheet and expansionary trade channels, I will separately look at the competitiveness and the net worth effects of depreciation.
4.2.1. Competitiveness effect of exchange rate and FX debt
One should expect a significant increase in firm sales and investment in the aftermath of depreciation if the competitiveness effect is strong. For instance, following a depreciation, I should observe a surge in firm profits that operate in the tradable sectors. Therefore, the aim of this section is to assess whether FX indebted firms perform better and witness a significant increase in investment, sales, and earnings in the aftermath of a depreciation.
First, I estimate the baseline investment regression by including contemporaneous earning, which also proxies for cash flows from operations. As seen in column 1 of Table 4, inclusion of the contemporaneous earning and tradable dummy improves the estimation, but only marginally. As expected, both the main effects of operating income, tradable dummy, exporter dummy, and the interaction of tradable dummy with exchange rate are positive. However, interactions of operating income and export with the exchange rate are negative. Although investment increases through the main effects of the competitiveness measures, depreciation in exchange rates effects investment negatively.
Subsequently, I add contemporaneous sales and sales costs into the regression. Although they have the expected signs and both are significant, I cannot rely on this estimation. As sales and cost are endogenous, I instrument them for the interaction of 3-digit ISIC.Rev- 2 industry codes with the interaction of export to sales and the logarithmic change in real exchange rate. The main effects of export to sales and its interaction with real exchange rate are treated as excluded instruments. The new estimation improves the composite balance sheet effect. As expected, the results suggest that competitiveness effect of exchange rate increases investment, but only marginally. To sum up, we observe that firms are matching their foreign currency debt with the increase in their income and profit up to a certain extent.
4.2.2. The balance sheet effect of exchange rate and FX debt
The fact that FX indebtedness increases with depreciation does not necessarily mean that depreciation is contractionary. Hence, I evaluate if the change in net worth due to depreciation is contractionary.
I assess whether overall debt of FX indebted firms increase due to depreciation. I estimate the baseline specification as total debt, financial debt, working capital, net worth and their change are as dependent variables. Column 1–4 in Table 5 shows that total debt and financial debt substantially increases with a depreciation. Similarly, Column 5–8 of Table 5 displays that in the aftermath of a depreciation, firms’ net worth decreases and their need for working capital increase substantially.
The evaluation of competitiveness and net worth channels of depreciation are shown in Tables 4 and 5 indicates that firms find their profit decreases, sales increases, and their indebtedness increases substantially in the aftermath of a depreciation. As a result, their need for working capital increases. Because the increase in total indebtedness is greater than the increase in earnings, the net-worth effect of depreciation dominates the competitiveness effect. As a result, FX indebted firms invest less in following a depreciation. 4.3. Foreign currency debt versus currency mismatch
The existing empirical works exclusively focus on FX debt as the main exposure variable. However, firms match their currency composition of liabilities with not only FX earnings, but also foreign assets and FX derivatives. If a firm holds some portion of its assets in a foreign currency, depreciation also inflates the domestic currency value of FX assets, hence the change in the net-worth will be ambiguous. Indeed, firms in our sample hold, on average, 11% of their assets in a foreign currency. Therefore, estimates based on FX debt alone may not be sufficient to understand balance sheet exposure of depreciation.
Having information on FX assets and FX derivatives enable me to disentangle the negative balance sheet effects of depreciation from its positive competitiveness effects. Another question to investigate is whether firms with larger currency mismatches invest relatively less in the aftermath of a depreciation. Hence, in this section, I present the results of a slew of estimation of the balance sheet effects to check whether firms with more mismatches in their balance sheet are more constrained in the aftermath of a depreciation. With these points in mind, first I augment the baseline specification by adding firms’ FX assets, FX derivatives, exports, imports, and their interactions with exchange rate.
Table 6 displays the results. When the effect of FX asset is accounted for, the magnitude of the estimated coefficient of our key
variable, (fxdebti, t− 1 ×∆et) becomes more negative, and remains significant. It implies that firms with FX denominated assets expe-rience a higher increase in their fixed capital expenditure relative to those that only hold Turkish Lira denominated assets. This is in itself an indication of a strong balance sheet effect. Next, I only include export to sales ratio and interact it with exchange rate. Although the main effect of export is positive and significant, its interaction with exchange rare is positive but insignificant. In column 4, I only include import to sales ratio and interact it with exchange rate. As expected, both the main effect of import is positive and the interaction of import to exchange rate is negative. In column 5, I include FX assets, export, and import; and in column 6, I also add FX derivatives. These new estimations yield interesting results. First, the interaction of export to exchange rate is negative and significant, although the main effect of export remains positive and significant. Unfortunately, I do not have any explanation for such a surprising result. The interaction of lagged import to exchange rate is negative as expected and the main effect is positive. The result suggests that the cost of import increases with depreciation, but import is used for investment and hence the main effect of import on investment is positive. Finally, I add FX derivatives into the specification. The results suggest that the interaction of FX derivatives with exchange rate is positive but insignificant.
The number of the observations for FX assets, FX derivatives, and exports differ in our dataset. To compare the relative effects of these variables, I only consider same firm-year observations those have both FX assets, FX derivatives and export revenues in the sample. The new results are displayed in Table 6. First, I consider the effect of FX derivatives used on hedging in columns 1–2. Column 1 presents the results of the baseline regression for the firms uses FX derivatives without FX derivatives, whereas column 2 presents the result of the baseline regression for the firms uses FX derivatives with FX derivatives. Results suggest that if used, FX derivatives are effective to hedge FX exposure.
Next, I consider firms with the same number of observation in their export revenues and FX assets in their balance sheets. I gradually add exports to sales ratio and its interaction with the logarithmic change in the real exchange rate into the baseline model to understand the relative effects of FX assets and exports on the magnitude of the composite effect. This exercise allows me to make some judgments about which of these variables are relatively more effective in hedging negative net worth effects of depreciation. Results are displayed in columns 3–5 of Table 7.
When FX assets are added, the coefficient of the variable of interest improves significantly. Although the interaction of FX asset with the exchange rate is not significant, the main effect of FX asset is positive and significant. Similarly, I add exports to sales ratio and interact with the exchange rate, the estimated coefficient (export x ∆ log real exchange rate) is positive and insignificant, but the main effect of exports is positive and significant. However, the coefficient of the variable of interest, (fxdebti, t− 1 ×∆et) does not change much compared to the baseline; it only improves marginally. This implies that FX earnings (exports revenues) are not as effective as FX assets to hedge the FX exposure. Furthermore, the coefficients of the interaction of FX assets with exchange rate and the main effect of FX assets are greater than those of the interaction of exports with exchange rate and the main effect of exports to sales. Hence, the result suggests that degrees of partial hedging with foreign asset holdings is greater than it is with FX earnings.
Next, I substitute FX variables with their short term measures and present the results in Table 8. The results are qualitatively same as previous estimations: in all cases I find a negative and significant balance sheet effect. However, the negative balance sheet effect is more significant for short term foreign currency debt compared to total foreign currency debt.
Last but not the least; I construct the accounting definition of both total and short-term currency mismatch as the difference be-tween FX liabilities, FX derivative and FX assets as the exposure variables. Then, I augment the specification with export and import variables as presented in Table 9. Again, in neither case do I find a positive balance sheet effect, which implies that depreciation is contractionary for firms with larger FX open positions.
5. Sensitivity analysis
5.1. Alternative measures of foreign currency debt
Estimations based on different measures of FX debt will shed some light on the relevance of the term structure (short vs long term) and currency break down of FX indebtedness (Dollar debt, Euro debt). The dataset allows me to construct short-term FX debt, monetary FX debt, and short-term monetary FX debt variables as FX exposure variables. Estimations based on the new indebtedness variables are qualitatively as same as the baseline results. However, results suggest that term structure of FX exposure matters quantitatively. As seen in the columns 1 and 4 in the panel A of the Table 10, the negative effect becomes more pronounced when the short-term FX debts
are taken as the exposure variables.
To account for whether firms shuffle the denomination of their FX debt between different currencies during an exchange rate fluctuation, I estimate the baseline specification by interacting each FX debt variables with the corresponding real exchange rates, i.e. I interact US Dollar debts with USD/TRY, and Euro debts with EUR/TRY exchange rates.10 Panel B of Table 10 displays the results. The new estimates indicate that the interaction of the Dollar and the Euro denominated debts with the exchange rate and the main effects of both the Dollar and Euro denominated debts are also negative, thus constrain investment.
5.2. Estimation with different fixed effects
The fixed effect OLS technique is subject to criticisms for its weaknesses into controlling the cross sectional unobserved differences in the dynamic model. Estimation of a fixed effect OLS regression along with lagged dependent variable leads to an attenuation bias
(Nickell, 1981). One way of controlling the unobserved cross sectional heterogeneities along with lagged dependent variable is using
the Arelleno-Bond type Generalized Method of Moments (GMM) estimation techniques (Arellano and Bover, 1995, Blundel and Bond,
1998, Arrellano and Bond 1991). However, GMM has its own problems and weaknesses. The main one is that the system is almost
always over-identified due to the instrument proliferation (see Roodman, 2007).11 As already discussed earlier, we are not interested in the determinants of investment, hence estimating the LDV is not an interest of this research. I am only interested in the impact of one variable which captures the effects of FX debt on investment through exchange rate fluctuations. Therefore, I rely on an OLS fixed effect estimation technique which is simple, explicit, exactly identified, and easy to understand. With these points in mind, I address concerns over the limited treatment of firm fixed-effects in two different ways. First, I estimate the baseline specification with and without lagged dependent variable by including the appropriate fixed effects into the specification. The results are presented in
Table 11, and they are qualitatively same as the baseline results. In neither of the case do I obtain a positive and significant balance
sheet effect.
Nevertheless, I still need to address the problem of not controlling for firm heterogeneities along with LDV in the regressions. I address this concern by following Guryan (2001) and Bleakley and Cowan (2008) in which I can control the unobservable firm dif-ferences together with LDV. Specifically, I estimate the baseline regression for constrained values of the lagged dependent variable that satisfy the stability condition of the system,12 and sum the dependent and lag dependent variables over each other.
Consequently, I illustrate the estimated coefficients and the corresponding Student’s t statistics of the variable of interest; (fxdebti, t− 1 ×∆et) in Fig. 7. As illustrated, for all the values of the lagged dependent variable that satisfy the stability condition of the system, the composite estimates of the balance sheet effects are always negative. This exercise suggests that our baseline results are not biased for not controlling the firm-level heterogeneities, and hence there is no need for GMM.
5.3. Controlling for firm characteristics
I control the firms’ access to FX credit by constructing indicators for firms’ foreign affiliation, parent company and bank affiliation, size, age, and their interactions with (fxdebti, t− 1 ×∆et) separately. Doing so will absorb any effects that are correlated with these characteristics and firms’ FX indebtedness which are likely to affect investment decision. Firms with foreign affiliates can relatively easily gain access to the international capital market. Affiliation with a bank and a parent company is likely to affect the availability of internal funds for necessary firm actives, especially when there is a credit crunch in the domestic financial market. Large and mature firms can easily gain access to domestic financial markets due to their long-established relationships. On the other hand, large and older firms may be relying mostly on their internal funds instead of borrowing. To account for these factors on firms’ access to foreign debt, I constructed indicator variables as described earlier.13 Then, I augmented the baseline regression by interacting these indicators with exchange rate. The results are displayed in Table 12.
As seen in Table 12, controlling for the micro characteristic that are likely to affect firms’ access to foreign funds and investment opportunities do not change the results presented in the baseline regression. I still obtain a negative and significant balance sheet effect. On the other hand, a positive triple interaction indicates that the net worth effect of depreciation is mild for those firms. Regression results suggest that foreign-controlled firms, firms affiliated with a parent company and larger firms have milder net-worth
10 The sum of the US Dollar and Euro denominated debt consists of around 95% of the total FX debt. In addition to USD and Euro, I also have
foreign currency debt in 15 different exchange rates. The remaining “other currencies” denominated debts are added into the specification sepa-rately in column 2 in Table 4 in panel B. They are also assumed as Dollar (Euro) debt and summed over the Dollar (Euro) debt in column3 (4) in panel B. In either case, the results are remaining same.
11Statistical tests for over-identification are extremely sensitive to the number of the lags used, and using longer lags of the variables as
in-struments without proper statistical testing to assess whether they are statistically valid inin-struments causes the system of GMM to suffer from “instrument proliferation”.
12 When lagged dependent variable, which is the AR (1) process, is equal and greater than 1, the system becomes explosive; that is, it is not going to converge to its long run equilibrium. If AR (1) equals to − 1, system oscillates around the mean, but there are concerns that LDV is close to the near unit root. In addition, if capital expenditure is a continues process, we can expect LDV to be greater than zero. Keeping these points in mind, I still display the coefficients for − 1 ≤ LDV ≤ 1.
13 I follow the corporate finance literature and use the natural logarithm of total assets as size variables. However, I constructed additional size
effects in our sample.14 6. Discussion and conclusion
This paper contributes to the empirical literature on the balance sheet effects of corporate FX indebtedness and FX mismatch through exchange rate fluctuations. The findings of this paper regarding FX exposures can provide evidence from an emerging market perspective, which has been a concern during the implementation as well as normalization of non-traditional monetary policy in the advanced countries. Although theoretical models have demonstrated that depreciations may be contractionary on output by putting pressures on firm balance sheet, the empirical literature finds mixed and inconclusive evidences. In this paper, I use a novel; hand- collected dataset that allows me to carry out comprehensive analyses on currency exposure, while controlling for many correlates of FX exposure, exchange rate fluctuation, and firm-level investment opportunities to overcome omitted variable bias.
Our findings indicate that firm-level total indebtedness and the need for working capital increases more than earnings in the aftermath of a depreciation. As a result, the contractionary net worth effect of depreciation dominates the expected expansionary competitiveness effect. Furthermore, those firms expect their future earnings and investment to increase as a result of depreciation observe a decrease in their future earnings and investment. Because firms cannot match currency composition of their liabilities with their FX earnings, the contractionary effect of depreciation dominates its positive effect. As a result, I see a substantial decrease in firms’ net worth. Our findings contrast for Bleakley and Cowan (2008) and Allayannis et al. (2001) those find that nonfinancial firms match their FX debts with foreign earnings for a select Latin American and East Asian countries respectively.
On the other hand, the term structure of FX indebtedness matters for the magnitude of the FX exposure. The negative composite effect becomes more pronounced when I take short-term FX measures as the FX exposure variables. On the other hand, I find that the interaction of the Turkish Lira debt with exchange rate are almost always positive and significant, i.e. while FX indebtedness is contractionary, the Turkish Lira indebtedness is expansionary.
The findings of this paper suggest that increasing NFCs’ FX leverage does not contribute to investment growth in Turkey. As documented above, this disconnection apparently related to firms’ lower operational profitability and their increasing need for working capital. As the results show that financing needs of FX indebted firms for servicing the debt increase with depreciation. This finding is aligned with the results of some of the recent CBRT’s Bank Loans Tendency Surveys in which NFCs have indicated that while their financing need for fixed investments has declined, they borrow more for working capital and debt restructuring.
I also consider the fact that firms hold FX assets in their balance sheet. This information allows me to assess whether having a larger FX open position makes depreciation more contractionary. It also allows me to disentangle the balance sheet and competitiveness effects. As illustrated, indeed having a large FX mismatch is contractionary. Furthermore, export revenues only marginally improve the balance sheet effect whereas FX asset holding hedges balance sheet mismatch better than export revenues.
These findings are robust and consistent to controlling and estimating the variables those are correlated with the exchange rates, firms’ FX indebtedness, and their investment opportunities. In neither cases do I find a negative composite balance sheet effect. Acknowledgments
I am grateful to Gerald Epstein for his guidance and endless support. I would like to thank Arslan Razmi and Adam Honig for their helpful discussions, comments and suggestions on the paper. I also thank Doruk Cengiz, Hoyt Bleakley, Herman Kamil and Mark Aguiar for answering my questions during the completion of this paper. I am grateful to Hatice Güler, Mehmet Dabako˘glu, and Adem Do˘gan for their excellent research assistance. I am alone responsible of any remaining errors. Author acknowledges the support of the Political Economy Research Institute of University of Massachusetts Amherst Dissertation Fellowship, Dissertation Travel Grant and University of Massachusetts Graduate School Dissertation Travel Grant.
Author statement
Manuscript title: Balance Sheet Effects of Foreign Currency Debt and Real Exchange Rate on Corporate Investment: Evidence from Turkey.
Authorship contributions:
The author, Serkan Demirkılıç has done all the work.
Serkan Demirkılıç: Acquisition of data, Conceptualization, Formal analysis, Visualization, Writing- Original draft preparation, Writing- Reviewing and Editing,
Declaration of Competing Interest None.
Appendix A. Variable Construction and Sources
Tangible Fixed Assets: Tangible fixed asset is the sum of machinery, plants, equipment, buildings, land, property, other tangible assets, and construction-in-progress. It does not include depreciation. Inventories are reported separately and not included in the calculations. Source is company balance sheets.
Capital Investment: Capital investment calculated as natural logarithmic change in tangible fixed assets. Author’s calculations. Investment Expenditures: Investment expenditures are calculated as the change in the sum of tangible and intangible fixed assets, and change in the sum of tangible and intangible fixed assets, and property expenditures, respectively. Author’s calculations.
Real Exchange Rate: The real exchange rate is constructed as end of year nominal Turkish Lira value of one US Dollar (USD/TRY) multiplied by the ratio of end of the year US to Turkish consumer price index (CPI). Similarly, it is constructed as the end of year Turkish Lira value of one Euro (EUR/TRY) multiplied by the ratio of the 28 Euro countries end of the year harmonized CPI to Turkish CPI. Alternative measure of real exchange rate also includes end of year Turkish Lira value of one US Dollar divided by end of year Turkish CPI. The source of CPIs is OECD. Hence, in this definition, an increase in the real exchange rate leads to a depreciation in the domestic currency vis-`a-vis the US Dollar. Author’s calculations.
Debt Weighted Real Exchange Rate: Debt weighted basket of real exchange rate of USD and EUR is constructed based on the weights of the USD and EUR debts within the total FX debt in each year. Author’s calculations.
Expected Real Exchange Rate: Author’s calculations based on Istanbul Chamber of Industry’s manufacturing sectors survey data, and CBRT’s expectation surveys.
Unexpected Component of Real Exchange Rate: The difference of realized and expected real exchange rate. Author’s calculations.
Foreign Currency Debt: Outstanding short and long-term FX liabilities in period t. These include financial and trade related li-abilities. Source is company footnotes.
Foreign Currency Assets: Outstanding short and long term foreign currency assets in period t. These include cash and cash equivalent as well as financial and trade related receivables. Source is company footnotes.
Foreign Currency Derivatives: Net of outstanding foreign currency derivatives in period t. Source is company footnotes. Foreign Currency Mismatch: Net of FX debts, FX derivatives and FX assets in period t. Source is author’s calculations and company footnotes.
Financial Debt: Outstanding liquid form of short and long term financial debts which are mostly bank credits. Source is company balance sheet.
Total Leverage: Ratio of total liabilities to total assets in period t. Source is company balance sheet and author’s calculation. TRY Leverage: Ratio of total Turkish Lira liabilities to total assets in period t. Source is company balance sheet and author’s calculation.
Maturity Mismatch: Net of current liabilities and current assets in period t. Author’s calculations.
Domestic Bank Credit: Domestic credit supplied by the domestic financial sector as the ratio of lagged GDP. The source is World Development Indicators.
Credit Inflow: Credit received from abroad as the ratio of lagged GDP. This data was compiled from balance of payment statistics. Alternatively, measures of credit inflow include total and short-term credit and loans received by non-financial firms’ from abroad. Source is CBRT.
Sales: Total net firm sales; the sum of domestic and foreign sales in period t. Source is company income statements. Sales Cost: Cost of sales in period t. Source is company income statements.
Export: Firm’s foreign sales in period t. Sources are income statements, company footnotes and Istanbul Chambers of Industry database.
Import: Firm’s import in period t. Source is income statements and company footnotes.
Operating Income: Net of gross profit and operating expenses in period t. Operating expenses are general and administrative expenses, sales, distribution and marketing expenses and research and development expenses in period t. Operating expenses excludes other operating income and costs such as financial related items (i.e., interest income, dividend income, and interest expense), extraordinary items, and taxes (same as operating income) in period t. Source is company income statements.
Net Worth: Ratio of net of total assets and total debt to total assets in period t. Source is company balance sheets. Working Capital: Net of current assets and current liabilities in period t. Author’s calculations.
Appendix B. Figures and Tables B1.
Fig. 1. Foreign Currency Open Position.
Notes: This figure illustrates the FX open position of firms. The solid line is total foreign currency debt, dashed line is total foreign currency asset,
and the long-dashed line below the x-axes is the total foreign currency open position as the difference between foreign currency asset and foreign currency debt as the share of total assets. Author’s calculations based on the dataset.
Fig. 2. Trends in Foreign Currency Debts.
Notes: This figure illustrates the ratio of the short term (dashed lines) and long term (solid lines) foreign currency debts as a share of total assets (left
panel) and total liabilities (right panel). Source: Author’s calculations based on the dataset.
Fig. 3. Trends in USD and EURO Debts and Nominal Exchange Rates.
Notes: This figure illustrates the trend in the original (solid line) and Turkish Lira (dashed line) values of USD and Euro Debt, and corresponding
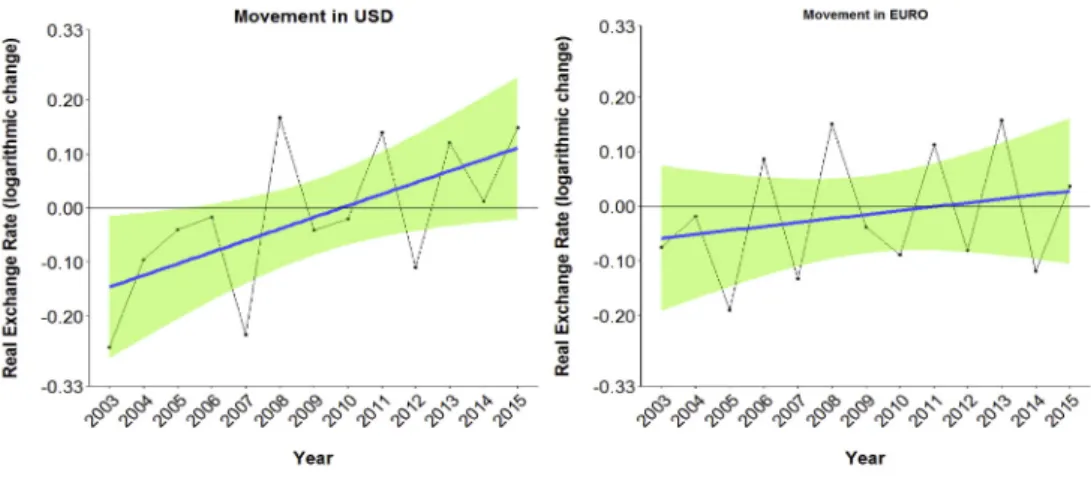
Fig. 4. Movements in the Real Exchange Rates.
Notes: This figure displays the movements in real exchange rates. The real exchange rate is constructed as end of year nominal Turkish Lira value of
one US Dollar (Euro) multiplied by the ratio of the end of the year US (Euro Area) to Turkish consumer price indices. An increase in the index implies depreciation in the domestic currency. Author’s calculations.
Fig. 5. Growth Rate of Capital Investment.
Notes: This figure displays the growth rate of capital investment. Capital investment is constructed as the logarithmic change in tangible fixed
assets, net of depreciation. Author’s calculations based on the dataset.
-.4 -.2 0 .2 .4 .6
Effects on Linear Prediction on Investment Growth
.001.03 .17 .25 .34 .52 .65
Foreign Currency Debt
Fig. 6. Average Marginal Effects of Real Exchange Rate.
Notes: This figure displays the average marginal effects of exchange rate with the different level of foreign currency debt. Foreign currency debt is at
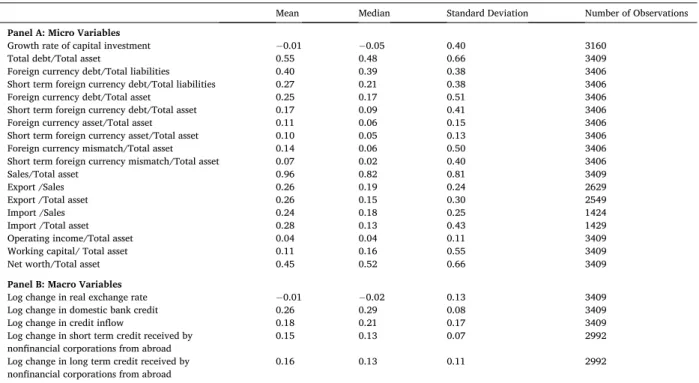
Table 1
Descriptive statistics.
Mean Median Standard Deviation Number of Observations Panel A: Micro Variables
Growth rate of capital investment −0.01 −0.05 0.40 3160
Total debt/Total asset 0.55 0.48 0.66 3409
Foreign currency debt/Total liabilities 0.40 0.39 0.38 3406
Short term foreign currency debt/Total liabilities 0.27 0.21 0.38 3406
Foreign currency debt/Total asset 0.25 0.17 0.51 3406
Short term foreign currency debt/Total asset 0.17 0.09 0.41 3406
Foreign currency asset/Total asset 0.11 0.06 0.15 3406
Short term foreign currency asset/Total asset 0.10 0.05 0.13 3406
Foreign currency mismatch/Total asset 0.14 0.06 0.50 3406
Short term foreign currency mismatch/Total asset 0.07 0.02 0.40 3406
Sales/Total asset 0.96 0.82 0.81 3409
Export /Sales 0.26 0.19 0.24 2629
Export /Total asset 0.26 0.15 0.30 2549
Import /Sales 0.24 0.18 0.25 1424
Import /Total asset 0.28 0.13 0.43 1429
Operating income/Total asset 0.04 0.04 0.11 3409
Working capital/ Total asset 0.11 0.16 0.55 3409
Net worth/Total asset 0.45 0.52 0.66 3409
Panel B: Macro Variables
Log change in real exchange rate −0.01 −0.02 0.13 3409
Log change in domestic bank credit 0.26 0.29 0.08 3409
Log change in credit inflow 0.18 0.21 0.17 3409
Log change in short term credit received by 0.15 0.13 0.07 2992
nonfinancial corporations from abroad
Log change in long term credit received by 0.16 0.13 0.11 2992
nonfinancial corporations from abroad
All micro (accounting) data is collected from Istanbul Stock Exchange, Public Disclosure Platform, and Capital Market Board and macro data is collected from Central Bank of Republic of Turkey. All variables are author’s calculations.
Fig. 7. Bracketing Lagged Dependent Variable.
Notes: This figure presents the coefficients of (fxdebti, t− 1 ×∆et) along with their corresponding t-statistics (vertical axes) when lagged dependent variable (horizontal axes) ranges by 0.01 in [− 1,1], which satisfies the stability condition of the system. Specifically, I estimate the following regression in which α, the value of the LDV ranges within [− 1,1], by 0.01: ynewi, t =yi, t − αyi, t − 1 =βBS(fxdebti, t − 1x Δet) + βX Xi, t − 1 +λjxt +ηi +εi, j, where η is firm fixed effect. The dependent variable is fixed capital investment as logarithmic change in tangible fixed assets, net of depreciation. Firm-level independent variables are once-lagged, and are scaled by the lag of total firm assets. The real exchange rate is from current period and hence contemporaneous to dependent variable. In addition to (fxdebti,t-1x Δet), all regressions include foreign currency debt, interaction of total debt to log change in real exchange rate, total debt as leverage, log total assets as size, age dummy, firm, industry-by-year and year fixed effects. As displayed, the coefficient of interest, (fxdebti,t-1x Δet), is always negative. This exercise proves that I do not need GMM. Author’s calculations.
Emerging Markets Review xxx (xxxx) xxx 14 Table 2
Number of observations based on firm characteristics.
Listed Foreign Parent Mature Large Tradable Exporter Total
Year Number Percent Number Percent Number Percent Number Percent Number Percent Number Percent Number Percent N
2003 209 100 52 24.9 153 73.2 105 50.2 138 66 169 80.9 171 81.8 209 2004 217 100 52 24 154 71 100 46.1 150 69.1 140 64.5 177 81.6 217 2005 224 100 57 25.4 157 70.1 105 46.9 151 67.4 175 78.1 182 81.3 224 2006 219 100 58 26.4 155 70.5 104 47.3 152 69.1 177 80.5 180 81.8 220 2007 230 100 59 25.5 157 68 115 49.8 154 66.7 191 82.7 184 79.7 231 2008 242 99 62 25.4 162 66.4 120 49.2 153 62.7 197 80.7 192 78.7 244 2009 264 99 63 23.6 166 62.2 135 50.6 156 58.4 213 79.8 207 77.5 267 2010 288 98 64 21.8 171 58.4 143 48.8 163 55.6 222 75.8 222 75.8 293 2011 308 96 63 19.7 175 54.7 159 49.7 171 53.4 243 75.9 237 74.1 320 2012 319 93 64 18.7 184 53.6 168 49 175 51 247 72 250 72.9 343 2013 322 94 62 18.1 185 53.9 172 50.1 176 51.3 254 74.1 249 72.6 343 2014 315 96 62 18.9 180 54.9 163 49.7 172 52.4 242 73.8 238 72.6 328 2015 295 97 56 18.4 164 53.9 153 50.3 166 54.6 223 73.4 224 73.7 304
Each column displays the number and percentage of select firm characteristic in each year. Listed refers a firm listed in Istanbul Stock Exchange. Foreign represents firms’ foreign affiliation. Parents refers to firms’ parent company affiliation. Mature represent mature firms by age. If the firms’ age is greater the median age is year t, firm is called mature. Large refers to large firms in terms of the workers employed. If firms employ more than 249 workers in year t, it is called large. Tradable represents the tradable sectors; agriculture, mining and manufacturing. Exporter represents firms those export in year t. Author’s calculations based on the dataset.
Table 3
Effect of foreign currency debt and exchange rate on firm investment.
(1) (2) (3) (4) (5) (6)
Independent variables Dependent Variables
Capital Investment(t) Capital Investment(t + 1)
Foreign currency debt x ∆ log real exchange rate −0.115 − 0.669 −0.854** − 0.084 0.350 0.605 (0.148) (0.412) (0.393) (0.208) (0.395) (0.454)
Foreign currency debt −0.115 − 0.669 −0.854** − 0.084 0.350 0.605
(0.053) (0.114) (0.063) (0.040) (0.069) (0.067)
Total debt x ∆ log real exchange rate 0.458 0.583* 0.009 0.010 0.011
(0.329) (0.310) (0.007) (0.007) (0.007)
Total debt 0.014 0.054 0.005 0.005 − 0.012
(0.112) (0.044) (0.020) (0.020) (0.017)
Log total assets −0.110** − 0.107* 0.012* − 0.351 − 0.469
(0.052) (0.057) (0.007) (0.301) (0.364)
Age Dummy −0.055 − 0.052 −0.010 0.061 0.072
(0.049) (0.049) (0.017) (0.047) (0.046)
Lagged capital investment 0.181*** 0.184***
(0.038) (0.038)
Observations 3016 3016 2770 3016 3016 2770
R-squared 0.396 0.397 0.240 0.203 0.205 0.239
Firm FE Yes Yes No Yes Yes No
Industry-by-Year FE Yes Yes Yes Yes Yes Yes
Year FE Yes Yes Yes Yes Yes Yes
Each column displays the results of OLS fixed effect regression. The dependent variable is fixed capital investment as log change in tangible fixed assets, net of depreciation. Estimates of the independent variables are listed in each row. The real exchange rate is constructed as the end of year Turkish nominal exchange rate multiplied by the ratio of US to Turkish CPI. Firm-level independent variables are once-lagged, and are scaled by the lag of total assets. In columns 1–3, real exchange rate is from the current period, and hence they are contemporaneous with the dependent variable. In columns 4–6, dependent variable is from the next period, and hence is contemporaneous with the lagged dependent variable. Column 3 and 6 are the baseline regressions. The number of observations varies because of the specifications and data availability. Standard errors are clustered by firm and are in parentheses. [*** p < 0.01, ** p < 0.05, * p < 0.1]. Descriptions of the variables and data sources are in Appendix A.
Table 4
Competiteveness effect of exchange rate.
(1) (2) (3) (4) (5)
Independent Variables Dependent Variables Capital Investment
FX debt x ∆ log real exchange rate −0.927** − 0.855** −0.839** − 0.787** −1.129***
(0.417) (0.393) (0.396) (0.391) (0.357)
Operating income x ∆ log real exchange rate −0.239*** (0.092)
Operating income 0.039***
(0.014)
I(Tradable) x ∆ log real exchange rate 0.340 (0.347)
I(Tradable) − 0.035
(0.067)
I(Exporter) x ∆ log real exchange rate −0.019
(0.236)
I(Exporter) 0.031
(0.033)
Contemporaneous Sales 0.183*** 0.345**
(0.061) (0.174)
Contemporaneous Sales cost − 0.124** −0.285
(0.062) (0.185)
Observations 2639 2770 2770 2770 2108
R-squared 0.245 0.241 0.241 0.256 0.062
Industry-by-Year FE Yes Yes Yes Yes Yes
Year FE Yes Yes Yes Yes Yes
IV for Sales and Sales cost Yes
Each column displays the results of OLS fixed effect regression. The dependent variable is fixed capital investment as log change in tangible fixed assets, net of depreciation. Estimates of the independent variables are listed in each row. I (.) indicates a dummy variable as shown. The real exchange rate is constructed as the end of year Turkish nominal exchange rate multiplied by the ratio of US to Turkish CPI. Firm-level independent variables are