Copyright (C) 2012 HKIEd APFSLT. Volume 13, Issue 2, Article 3 (Dec., 2012). All Rights Reserved.
Can eco-schools improve elementary school students’
environmental literacy levels?
1Sibel OZSOY
Department of Elementary School Education Faculty of Education
Aksaray University, TURKEY E-mail: [email protected]
Hamide ERTEPINAR
İstanbul Aydın University, TURKEY Necdet SAGLAM
Hacettepe University, TURKEY
Received 13 Mar., 2012 Revised 11 Jul., 2012
Contents
o Abstract o Introduction o Method o Results o Inferential Statistics o Conclusion o References1This study is based on the dissertation entitled as “Effects of Eco-School Application on Elementary School
Copyright (C) 2012 HKIEd APFSLT. Volume 13, Issue 2, Article 3 (Dec., 2012). All Rights Reserved.
Abstract
This study was conducted to investigate the effects of eco-schools on elementary school students’ environmental literacy levels. Data of the study were gathered from 316 students enrolled to two elementary schools. One of the schools was determined as experimental group (n = 156) and students attending this school received eco-school application. The other school was set as control group (n = 160) and students enrolled to this school received traditional school application. Environmental Literacy Questionnaire with four subscales; environmental knowledge, attitudes, uses and concerns, was used to determine students’ environmental literacy levels. Results revealed that there were significant differences between control and experimental groups of different grade levels in terms of the all subscales of Environmental Literacy Questionnaire in favor of experimental group.
Keywords: Environmental education, environmental literacy, eco-schools
Introduction
The ultimate goal of environmental education is to educate children as environmentally literate citizens who can actively participate in solving environmental problems (Roth, 1996; Rothkrug & Olson, 1991; Wilke, 1995). Within the debate about environmental education, environmental educators discuss about the concept of environmental literacy and the ways to educate environmentally literate children. From its birth, the term environmental literacy has received attention of many educational researchers and environmental scientists. Even though the term has been discussed with researchers, there is no generally agreed definition of it. The earliest definition of environmental literacy was made by Roth in 1968. Roth defined environmentally literate person as “someone who possesses the basic skills, understandings and feelings for man-environment relationship” (p. 2). According to Roth an environmentally literate person understands “the interrelationships between natural and social systems”, “the unity of humankind with nature”, “how technology influences environmental decision making” and “learning about the environment is a life-long endeavor” (p. 2). Agreed with Roth, many educators state that environmentally literate person recognizes the connections between science, technology, society and the environment (Bybee & DeBoer, 1994;
Copyright (C) 2012 HKIEd APFSLT. Volume 13, Issue 2, Article 3 (Dec., 2012). All Rights Reserved. Palmer, 2003). Another definition of environmental literacy was made by Hungerford and Peyton (1997). They defined environmental literacy as a concept which is “reflected by human beings who have knowledge of and the ability to communicate the need for environmental action strategies, who have the ability to use these skills inherent in environmental action strategies, and who are willing to use action strategies in an effort to remediate environmental issues” (p.4). Although there are discrepancies on the definition and components of environmental literacy, researchers agree that the solution to environmental problems is to develop an environmentally literate society behaving in more environmentally responsible ways (Roth, 1996; Rothrug & Olson, 1991; Wilke, 1995). A behavior is considered to be an environmentally responsible one when “the actions of an individual or group advocate the sustainable or diminished use of natural resources” (Sivek & Hungerford, 1990, as cited in Vaske & Kobrin, 2001, p.16).
Developing an environmentally literate society is possible through effective environmental education. As places of learning, schools have a special role to play; they can help students to understand our impacts on the planet; and become places where sustainable living and working is demonstrated to young people and the community. However, current educational practices are not effective to improve students’ environmental literacy (Cutter, 2002; Daudi, 2008, Michael, Stamou & Stamau, 2007, Orr, 1992). Hungerfold and Volk (1990, p.437) noted that “environmental educators typically assume that if they simply impart knowledge to students, responsible action will follow”. However, gaining ‘responsible environmental behavior’ is more than having scientific knowledge about environmental issues. We have to provide effective instructional practices to develop environmentally responsible behaviors and the required learning environment should give students the chance of studying out of the classes, observing the nature, practicing and testing the learned issues about the environment. With this respect an international award program, named as eco-school, emerged to improve students’ environmental literacy. Eco-school program was developed by Foundation of Environmental Education (FEE) as a means of delivering Agenda21 commitments (http://www.fee-international.org). The major aim of this program is to prepare children for sustainable living and to show that sustainable living is about finding solutions to the problems we confront and improving the people’s quality of life without destroying the environment. This program combines learning and action, thus providing an effective method to change behavior shift. By the rise of the eco-school program, it gained an increased attention throughout the world and today,
Copyright (C) 2012 HKIEd APFSLT. Volume 13, Issue 2, Article 3 (Dec., 2012). All Rights Reserved. 27,000 schools from 44 countries including Turkey are enrolled to the program. Eco-schools program is administered in Turkey by Turkish Foundation for Environmental Education since 1995. Hundreds of schools; kindergartens, primary, elementary and secondary schools; enrolled to the project all over the country. Eco-school program provides a framework including seven steps to guide schools on their sustainable journey (http://www.eco-schools.org.uk). The program starts with forming an eco-committee (http://www.fee-international.org). In this step, the school establishes an eco-school committee that includes teachers, students, parents, staff and if it is possible other stakeholders in the local community. The major roles of eco-committee are to inform whole school about the program, to lead in carrying the environmental review and the action plan and to provide a link between students, teachers, administrators and the whole school community. The second step in eco-school program is conducting an environmental review. In this step, eco-teams provide information on the school’s impact on the environment. Schools can address environmental issues such as litter, waste minimization, energy, health and school grounds. As a result of the environmental review, a list of actions is drawn out. During the third step, forming an action plan, members of the eco-teams and whole school community are assigned to accomplish the targets in the action plan. Through the process, eco-teams should monitor their actions and evaluate their progress. Coordinator teachers are advised to encourage students to take an active role during monitoring and evaluation. By this way students will have a greater sense of ownership towards the program. The next step in eco-school program is the curriculum work. Teachers are expected to make an effort for integrating environmental issues throughout the curriculum and different areas of study such as mathematics, language, religion and social sciences. Informing and involving the whole school and wider community is the sixth step of eco-school program. The program aims to raise the environmental awareness of the whole school and wider community. For this reason, activities that provide the involvement of the wider community are advised. Last step in eco-school program is producing the eco-code. Eco-code is a mission statement demonstrating the school’s commitment to improving its environmental performance. It is advised to produce the eco-codes with students and display on eco-school board, classrooms, staff rooms and corridors. At the end of the process, schools are evaluated in developing students’ awareness and in changing their behavior in respect of environment. If the school is found to be successful, it is labeled as eco-school.
Copyright (C) 2012 HKIEd APFSLT. Volume 13, Issue 2, Article 3 (Dec., 2012). All Rights Reserved. Eco-schools program is a promising approach to improve students’ environmental literacy. Although the program is implemented in a wide area, there are not enough research studies questioning the effectiveness of eco-school applications. In one of the research study, Aktepe and Girgin (2009) compared 8th grade students attending eco-schools with students attending public school with respect to their environmental consciousness and environmental knowledge. The research has been applied to 178 primary school students and the results of the study showed that while eco-school students are more conscious in practice, traditional school students are more successful in theoretical area.
In another research study, Krnel and Naglic (2009) compared eco-school students and public school students with respect to their environmental knowledge and awareness. Besides, researchers also investigated if there are any differences between two groups with respect to their environmentally responsible behaviors. Statistical comparisons showed that eco-school students’ environmental knowledge level is slightly higher than students’ attending public school. On the other hand, results also showed that, there are no statistically significant differences between groups with respect to their environmental awareness and environmentally responsible behaviors.
In their study, Bajd and Leščanec (2011) compared ecological awareness and environmental responsibility of students involved in the Eco-School Project with those of pupils involved in Healthy School Project. Based on the results of the study the researchers concluded that although students at both schools displayed moderately good ecological awareness and environmental responsibility, students attending eco-schools show higher ecological awareness and environmentally responsibility than students attending healthy schools.
Previous research studies showed that eco-schools are effective on improving students’ environmental knowledge and awareness. However, as the readers of this study will realize, related literature consists of very few studies with a limited sample sizes. For this reason, research studies questioning effectiveness of eco-schools on different variables are needed. This study aims to fill this gap in the literature. With this respect, the study aimed to determine the effectiveness of eco-school application on elementary school students’ environmental literacy levels. Based on this purpose, the main problem of this study is: “What is the effect of eco-school applications on the improvement of elementary school students’ environmental literacy compared to
Copyright (C) 2012 HKIEd APFSLT. Volume 13, Issue 2, Article 3 (Dec., 2012). All Rights Reserved. traditional school applications?” With this main problem the study also focuses on following sub-problems:
1. Is there a significant mean difference between the effects of eco-school application and traditional school application on elementary school students’ knowledge about environment?
2. Is there a significant mean difference between the effects of eco-school application and traditional school application on elementary school students’ attitudes toward environment?
3. Is there a significant mean difference between the effects of eco-school application and traditional school application on elementary school students’ environmental uses?
4. Is there a significant mean difference between the effects of eco-school application and traditional school application on elementary school students’ environmental concerns?
Method
Research Design
This study is adopted a quasi-experimental design. The participants were distributed into experimental and control groups. Experimental group (EG) received eco-school application and control group (CG) received traditional school application through spring semester of 2008-2009 academic year.
Participants:
Participants of the study consisted of 316 students’ enrolling to 6th, 7th and 8th grades of two private schools in an urban area of Turkey. For each grade level, there are one EG and one CG. The EG included totally 156 students (84 boys and 72 girls), and the CG included 160 students (92 boys and 68 girls). The distribution of the sample according to gender and grade level is given in Table 1.
Copyright (C) 2012 HKIEd APFSLT. Volume 13, Issue 2, Article 3 (Dec., 2012). All Rights Reserved. Table1. Demographic Characteristics of Participants
EG CG Total
Boys Girls Boys Girls
6th grade 40 30 28 19 117
7th grade 27 18 38 35 118
8th grade 17 24 26 14 81
Total 84 72 92 68 316
Data Collection Instruments
Elementary school students’ environmental literacy was measured by administering the Environmental Literacy Questionnaire (ELQ) developed by Kaplowitz and Levine (2005) and translated and adapted into Turkish by Tuncer, Tekkaya, Sungur, Çakıroğlu, Ertepınar and Kaplowitz (2009). The questionnaire includes 45 closed-ended questions which make it easy to use, score and code for statistical analysis. The questionnaire includes questions covering four components of environmental literacy; environmental knowledge, attitudes, uses and concerns. The knowledge component of the instrument includes questions about the understanding of the basic ecological principles that are related with the environment. The environmental attitude items targeted respondents’ feelings related to the environment and environmental problems, while the environmental use items measured respondents’ intention to take part in environmentally responsible behaviours. Environmental use statements, aim to determine the ways in which human beings make use of and manage land, trees, animals, plants and water. The concern items focus on participants’ sensitivity toward environmental problems and issues. Tuncer et al. found internal consistency of the environmental knowledge, attitudes, uses, and concern item sets to be .88, .64, .80 and .88, respectively, using Cronbach alpha. In the present study, the internal consistency values for each subscale were calculated as .78, .60, .86 and .90 respectively.
Data Collection
The ELQ was applied as the pre-test and post-test to both EGs and CGs. Eco-school and traditional school teachers’ administered the instrument as a regular process of lessons. Before administration, on a meeting with teachers, the researcher explained the purpose of the study and how the instrument should be applied in classrooms. To
Copyright (C) 2012 HKIEd APFSLT. Volume 13, Issue 2, Article 3 (Dec., 2012). All Rights Reserved. ensure confidentiality of the data, students were told not to write their names on the papers. Students were assured that there will be no grading involved for this or any of the activities in this study and their participation would in no way influence their grades.
Procedure:
Applications in Experimental Group: Eco-School Applications
Step 1- Forming the Eco-School Committee: At the very beginning of the
application, a meeting was conducted with all teachers and administrators of the school. In this meeting a detailed description of the study was made with a presentation, handbooks prepared for the teachers were distributed, five eco-teams (Healthy Living, Energy, Waste and Recycle, Water, School Building and School Ground) were formed and two volunteer teachers were assigned for each group. Co-director of the school who is also physical education teacher was chosen as the leader of eco-school committee. After this meeting, the study was announced to all students. All the teachers informed students in their classrooms and volunteer students (10-15 students) were assigned for each team. After that, each team made meetings separately and determined how they are going to conduct the environmental review.
Step 2- Carrying Out an Environmental Review: Students in eco-teams carried out
an environmental review with their leader teachers to form a realistic picture of school’s current situation. For a detailed and organized environmental review, the leader teachers prepared a set of questions that should guide the review and students and the leader teachers determined the places they have to examine. For example; Healthy Living Eco-team decided to examine the restrooms, canteen, refectory and all classrooms. During the environmental review students took notes and determined the existing problems. Each eco-team tried to find out answers to several questions during the environmental review. Each environmental review took approximately 4-5 hours totally and conducted in 3-5 days. Since students were from different classrooms and grade levels, the environmental review held in free hours of students.
Step 3- Developing an Action Plan: After carrying out the environmental review
and determining the needs of the school, teachers and students from each eco-team came together and determined an action plan for each team. These plans were
Copyright (C) 2012 HKIEd APFSLT. Volume 13, Issue 2, Article 3 (Dec., 2012). All Rights Reserved. developed using the results of environmental review. In these plans, actions the teams are going to take to improve environmental performance were listed. The teams examined the environmental review, decided which ones they can improve then determined a deadline to complete the task. In the action plan the teams also decided timetable for each action ranging from a few weeks to a few months. The action plans the teams developed were announced to whole school community by eco-school board. After completing the action plan they started the tasks they determined.
Step 4- Monitoring and Evaluating: After some time passed in the application,
eco-teams assessed their progress towards the targets that have been established. In a meeting they checked their action plans, their timing and the actions they were able to take. During these meetings several modifications were made in the timescales and targets. Monitoring the process was a very effective strategy for teachers; by this way they were able to include environmental activities into their lessons at the same time with the actions that eco-team members took. To evaluate the process there are several steps suggested by FEE such as; measuring the school’s ecological footprint, meter readings and calculation of energy bill savings, before, during and after photographs, using questionnaires and surveys to canvass opinions. Eco-teams preferred to take before, during and after photographs. All the teams presented their progress with photographs and shared with whole school by eco-school board.
Step 5- Linking to the Curriculum: In this step classroom activities about energy,
waste and water are conducted by students. This step ensures integration of the whole school to the environmentally related activities. In this step, most of the work was done mostly by teachers; they planned and integrated several activities to their lessons. This may seem easy especially for science teachers but the most important part of this step was to integrate environmentally related activities to all disciplines.
Step 6- Involving the Whole School and Wider Community: One of the key aims
of eco-schools is to success the whole school participation in environmental activities. Throughout the process whole school kept updated about the progress of the project by using eco-school board. Besides, to enable all students to participate in the project, teachers and the researcher designed several activities.
Copyright (C) 2012 HKIEd APFSLT. Volume 13, Issue 2, Article 3 (Dec., 2012). All Rights Reserved.
Step 7- Producing the Eco-Code: To state values and objectives what each
eco-team striving to achieve, students determined their eco-codes and presented their eco-codes in eco-school board.
Applications in Control Group: Traditional School Applications
Students in control group were exposed to a learning environment wherein learning proceeded primarily through a traditional approach. Control group teachers generally used lecturing and questioning method during their instruction. Throughout the semester, the teachers in the control group explained the topic and asked several questions during the instruction. After explaining the topic, teachers mainly focus on solving multiple choice questions related with the topic. Except several issues related with environment and environmental problems teachers did not emphasis any related topic in courses. No additional environmental activities were done during the semester. All the courses were completed in the classrooms. Students did not plan and participate in any kind of environmental activities. Science teachers did not spend much time on topics related with environment, because they thought that environmental topics are really easy to learn for students. In the control group, environmental lessons are restricted to the classroom at the discretion of teachers.
Analysis of Data
The participants’ responses to the ELQ comprise the data set used for the analysis. Environmental knowledge part includes multiple choice questions. Scores for the knowledge part ranged from 0 (investigates no correct responses) to 11 (all correct responses). Environmental attitude and uses part include items with Likert-type responses. For positive statements 5 points were assigned to ‘strongly agree’, 4 to ‘agree’, 3 to ‘undecided’, 2 to ‘disagree’ and 1 to ‘strongly disagree. For the representation of the data strongly agree’ and ‘agree’ responses and ‘disagree’ and ‘strongly disagree’ responses were combined to give proportions of students who affirmed the data. Environmental concern part included nine environmental problems and Likert-type responses ranging from ‘very concerned’ to ‘not all concerned’. Similar with the attitudes and uses part, 5 points were assigned to ‘very concerned’, 4 to ‘concerned, 3 to ‘undecided’, 2 to ‘a little concerned’ and 1 to ‘not at all concerned’.
Copyright (C) 2012 HKIEd APFSLT. Volume 13, Issue 2, Article 3 (Dec., 2012). All Rights Reserved. Responses to the different parts of the instrument were scored and recorded in Statistical Package for the Social Sciences (SPSS) version 15.0. To analyze the data obtained from ELQ both descriptive statistics and inferential statistics were used. Descriptive statistics were used to identify students’ demographic characteristics, students’ self evaluation about their environmental concerns and knowledge, distribution of students’ pre- and post- responses for environmental knowledge, attitude, use and concern subscales. Inferential statistics were used to find out the relationship between independent variables (treatments, grade level and gender) and scores obtained subscales of environmental literacy. Independent samples t-test and one-way analysis of covariance (one-way ANCOVA) were used for inferential statistics. The results of the study reported to be significant at the p < .05 level statistical significance and medium effect size.
Results
Descriptive Statistics of the Pre-test and the Post-test Results of Knowledge Subscale of ELQ
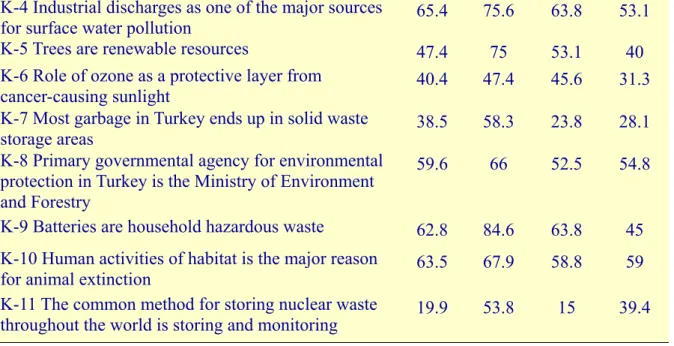
Students’ environmental knowledge was evaluated by their correct responses to the 11 knowledge items. When the results are examined (Table 2 and Figure 1) it can be observed that in the EG for each knowledge questions the number of students who gave correct answers increased in the post-test. However, this situation cannot be observed in the CG. In the CG, although the number of students who gave correct answers increased in some of the questions; such as, K2, K7, K8, K10, K11, there were also decreases in correct responses for some knowledge questions; such as, K1, K3, K4, K5, K6 and K9.
Table 2 Percentages (P) of Students who Gave Correct Answers to Knowledge Questions
Environmental Knowledge Statements
Correct Response (P) EG Correct Response (P) CG Pre Post Pre Post
K-1 Definition of biodiversity 51.9 55.8 57.5 50
K-2 Motor vehicles as the largest contributor of
carbon monoxide 21.2 55.8 13.8 20
K-3 Electricity generation in Turkey by hydroelectric
Copyright (C) 2012 HKIEd APFSLT. Volume 13, Issue 2, Article 3 (Dec., 2012). All Rights Reserved. K-4 Industrial discharges as one of the major sources
for surface water pollution 65.4 75.6 63.8 53.1
K-5 Trees are renewable resources 47.4 75 53.1 40
K-6 Role of ozone as a protective layer from
cancer-causing sunlight 40.4 47.4 45.6 31.3
K-7 Most garbage in Turkey ends up in solid waste
storage areas 38.5 58.3 23.8 28.1
K-8 Primary governmental agency for environmental protection in Turkey is the Ministry of Environment and Forestry
59.6 66 52.5 54.8 K-9 Batteries are household hazardous waste 62.8 84.6 63.8 45 K-10 Human activities of habitat is the major reason
for animal extinction 63.5 67.9 58.8 59
K-11 The common method for storing nuclear waste
throughout the world is storing and monitoring 19.9 53.8 15 39.4
Figure 1. Bar chart representing the frequency and percentages of students who gave correct answers to knowledge questions
In EG, the biggest change in the percentages occurred in K2, K3, K5, K9 and K11. K2 is about the contribution of motor vehicles to the carbon monoxide level. The descriptive statistics for this item revealed that 21.2% of experimental group students answered this item correctly in the pre-test. In the post-test the percentages of students answering this item correctly increased to 55.8%. The third knowledge
Copyright (C) 2012 HKIEd APFSLT. Volume 13, Issue 2, Article 3 (Dec., 2012). All Rights Reserved. item, K3, was about the way of electricity generation in Turkey. As the percentages displayed, there is a 26.2% of increase in experimental group students’ answers between the pre-test and the post-test. One of the biggest changes in the pre-test and the post-test percentages occurred in K5. In the pre-test 47.4% of EG students answered this item correctly and in the post-test the percentages increased to 75.0%. K9 was about the most hazardous household waste and 84.6% of experimental group students answered this item correctly in the post-test. The change of percentages between the pre-test and the post-test was found as 21.8%. K11 was about the common method used for storing nuclear waste throughout the world. In EG, 19.9% of students gave correct answers to this question in the pre-test and 53.8% in the post-test. In other questions, there are small increases in the percentages of experimental group students answering the knowledge questions correctly.
In CG, the number of students answering the knowledge items correctly increased only in few questions; K2, K7, K8, K10, K11. The dramatic increase occurred in K11. In the pre-test 15% of CG students answered this question which is about the common method used for storing nuclear waste throughout the world correctly. In the post-test the percentage of students increased to 39.4. Besides increases, there are also decreases in the correct answers in the post-test. The most dramatic decrease occurred in K9. This item was about the most hazardaous household waste. With 18.8% of change, the percentages of students answering correctly decreased from 63.8% to 45%.
Descriptive Statistics of the Pre-test and the Post-test Results of Attitude Subscale of ELQ
Environmental attitude is the second subscale of ELQ. When the results are examined it can be observed that after the application experimental group students’ agreement with positive statements and their disagreement with negative statements increased for all the statements except for the statement A6. The striking differences occurred for A1, A2, A5 and A7. A1 was about the carrying capacity of the earth. In the pre-test 35.9%, in the post-test 65.3% of experimental group students agreed that we are approaching the limit of the number of people the earth can support. Also, in the pre-test 52.6%, in the post-test 78.2% of experimental group students expressed that they agree with the statement A2, “When humans interfere with the nature it often produces disastrous consequences.” For A5, “The balance of nature is strong enough to cope with the impacts of modern industrial
Copyright (C) 2012 HKIEd APFSLT. Volume 13, Issue 2, Article 3 (Dec., 2012). All Rights Reserved. notions”, before the application 31.4%, after the application 70.5% of students expressed their disagreement with the statement. In A7, it was stated that “The so-called ‘ecological crisis’ facing humankind has been greatly exaggerated.”. Although in the pre-test 22.4% of experimental group students expressed their disagreement about the statement this number increased to 71.8 after the application. In EG, the percentages of students decreased only for one statement A6. In this statement it was expressed that “Despite our special abilities humans are still subjects to the laws of nature.” In the pre-test 62.8%, in the post-test 56.4% of EG students expre
The situation is not the same in CG. When the results are examined it is observed that there is an increase in the percentages of students for only two statements: A5 and A7. In the pre-test 41.9%, in the post-test 51.3% of CG students expressed that they disagree with the statement A5. For the statement A7, although the percentages of students disagree with this statement was 26.3 in the pre-test, this number increased to 42.5 in the post-test. Besides, these two statements, there was a decrease in the percentages for all other statements. The most striking decreases occurred in A4 and A10. In A4, students were asked their agreement about the statement “Plants and animals have as much right as humans to exist”. Before the application 75%, after the application 53.2% of control group students stated that they agree with this statement. For A10, “If things continue on their present course, we will soon experience a major ecological catastrophe.”, although the percentage of students was 65.6% in the pre-test, the percentage decreased to 48.2% in the post-test.
Descriptive Statistics of the Pre-test and the Post-test Results of Environmental Use Subscale of ELQ
Students participating the study were also asked for their agreement about a series of statements about their views on environmental uses. This part consists of 19 five-point Likert-type statements. When the percentages are examined, it can be observed that for positive statements, EG students’ agreement increased for all statements after the application except for U11. The striking differences between the pre-test and the post-test results occurred in U9, U15 and U16. In U9, students were asked whether they agree with the statement, “Government should regulate the use of private land to protect wildlife habitat.” Before the application 60.9%, after the application 80.1% of experimental group students stated that they agree with this statement. The second striking result occurred in U15. In this statement it
Copyright (C) 2012 HKIEd APFSLT. Volume 13, Issue 2, Article 3 (Dec., 2012). All Rights Reserved. is expressed that science and technology will be very important in solving our environmental problems. In the pre-test 53.8%, in the post-test 81.4% of EG students agreed with this statement. Statement U16 was about the importance of cultural changes in solving environmental problems. The percentages of students agreed with this statement increased from 56.4% to 77.0%. Among positive statements besides these increases there was a decrease in percentages for the statement U11. Although the decrease was small, in the pre-test 76.9% in the post-test 75.0% of experimental group students stated that all plants and animals play an important role in the environment.
For CG students, an increase was observed for only U6 and U17. In U6 it was stated that “It is important that everyone be aware of environmental problems”. In the pre-test 58.1%, in the post-test 70.0% of control group students expressed their agreement with the statement. Another increase occured in U17, which is focusing on the importance of changes in people’s values to solve environmental problems. For this statement in the pre-test 45.2%, in the post-test 60.5% of control group students stated that they agree with this statement.
Descriptive Statistics of the Pre-test and the Post-test Results of Environmental Concern Subscale of ELQ
Environmental concern is the fourth subscale of ELQ. In this subscale participants were asked to share their level of concern about current environmental issues. Table 3 shows the percentages of EG and CG students’ pre-test and post-test answers to the environmental concern subscale of ELQ.
Results revealed that EG students’ concern levels increased for ‘smoke pollution’, ‘automobile emissions’, ‘industrial pollutions’, ‘hazardous wastes’, ‘poor water quality’, ‘ozone depletion’ and ‘global warming’ after the treatment. The most drastic change occurred in ‘global warming’. In the pre-test 56.5%, in the post-test 73.1% of EG students stated that they are concerned about global warming. Striking differences occurred for also ‘smoke pollution’, ‘hazardous wastes’ and ‘poor water quality’. Besides, although the change is small, EG students’ environmental concern levels decreased for ‘noise pollution’ ‘indoor air pollution’.
Copyright (C) 2012 HKIEd APFSLT. Volume 13, Issue 2, Article 3 (Dec., 2012). All Rights Reserved. Table 3 Percentages of Students’ Concern Levels for Environmental Problems
Environmental
Problems Concerned Undecided Not Concerned
EG CG EG CG EG CG
Pre Post Pre Post Pre Post Pre Post Pre Post Pre Post
C1-Smoke Pollution 58.3 69.9 73.3 50 10.9 9.6 11.2 24.3 30.8 20.5 15.5 25.7 C2- Noise Pollution 66.1 60.3 60 46.8 12.1 9 11.4 17.5 21.8 30.7 28.6 35.7 C3- Automobile Emissions 52 58.3 55.8 45 15.4 5.8 19.9 21.9 32.6 35.9 24.3 33.1 C4- Industrial Pollution 63.5 64.1 59.6 51.3 7.7 12.2 14.3 18.1 28.8 23.7 26.1 30.6 C5- Hazardous Wastes 63.5 75 48.7 63.4 14.1 7.7 21.9 6.8 22.4 17.3 29.4 29.8 C6- Poor Water Quality 66.1 75 64.5 52.4 15.9 7.1 5.6 16.9 18 17.9 29.9 30.7 C7- Indoor Air Pollution 71.7 67.9 71.4 54.9 7.1 10.9 8.1 14.4 21.2 21.2 20.5 30.7 C8- Ozone Layer Depletion 74.4 80.1 50.6 62.8 6.4 2.6 10.6 4.3 19.2 17,3 38.8 32.9 C9- Global Warming 56.5 73.1 69.6 59.3 18 5.1 3.7 8.8 25.5 21.8 26.7 31.9
Results also showed that CG students’ concern levels increased for only ‘hazardous wastes’ and ‘ozone layer depletion’. In the pre-test 48.7%, in the post-test 63.4% of CG students expressed their concern level for hazardous wastes as high. Also, although the change is small, in the pre-test 50.6%, in the post-test 62.8% of CG students stated that they are concerned for ozone layer depletion. For all other issues; ‘smoke pollution’, ‘noise pollution’, ‘automobile emissions’, ‘industrial pollution’, ‘poor water quality’, ‘indoor air pollution’ and ‘global warming’, CG students’ concern levels decreased after the application.
The lecturers and students from the universities were invited to have interviews with researchers in order to investigate which ICT applications were used by lecturers and the pedagogy underpinning the applications. Eight lecturers and twelve students accepted the invitations and were interviewed. The lecturer interviews included four main questions, and based on the answers further discussions were stimulated. There were five main questions for the student interviews which sought to understand the student perspectives of the use of ICT and the pedagogy underpinning its use.
Data from the students’ interviews triangulated the data from lecturers’ interviews and survey. In addition, data from lecturers’ interviews not only enriched but also triangulated the data from the survey with the lecturers.
Copyright (C) 2012 HKIEd APFSLT. Volume 13, Issue 2, Article 3 (Dec., 2012). All Rights Reserved.
Inferential Statistics
Research Question 1: Are there significant mean differences between experimental and control group students with respect to their environmental knowledge?
To determine whether EG and CG students differ with respect to their environmental knowledge, independent samples t-tests are conducted for each grade level. The results showed that there is a significant mean difference between mean scores of 6th grade (t (115) = 7.059, p = .000, η2 = .30) 7th grade (t(116) = 3.041, p = .003, η2 = .07) and 8th grade (t(79) = 9.443, p = .000, η2 = .53) students enrolling eco-school and traditional school on their knowledge about environment. Results also revealed that means of EG students are higher than means of CG students for all grade levels. Table 4 represents the results of t-tests run for students’ environmental knowledge scores.
Table 4 Results of t-tests run for students’ environmental knowledge scores.
Grade Level Group N M SD t p η2
6th Grade EG 70 6.585 2.095 7.059 .000 .30 CG 47 3.638 2.381 7th Grade EG 45 5.577 2.544 3.041 .003 .07 CG 73 4.205 2.088 8th Grade EG 41 7.853 1.236 9.443 .000 .53 CG 40 4.100 2.216
Research Question 2: Are there significant mean differences between experimental and control group students with respect to their environmental attitudes?
To answer the second research question, for 6th and 7th grades analysis of covariance (ANCOVA), for 8th grade independent sample t-test were run. The ANCOVA results revealed that there is a significant mean difference between 6th grade EG and CG students with respect to their attitudes toward environment subscale (F(1,114) = 13.597, p = .000) with a large effect size (partial η2 = .107). For this subscale, EG students got higher scores (M = 32.614, SD = 4.79) than CG (M = 27.148, SD = 8.88). ANCOVA results also showed that there is no significant mean difference between 7th grade treatment groups with respect to their attitudes toward environment (F(1,115) = 34.023, p = .344). The analysis run for 8th grade students
Copyright (C) 2012 HKIEd APFSLT. Volume 13, Issue 2, Article 3 (Dec., 2012). All Rights Reserved. showed that there is a significant mean difference between groups in favor of EG (t(79) = 8.096, p = .000) with large effect size (η2 = .45). After the application, eco-school students (M = 36.585, SD = 3.701) had higher attitudes toward environment than traditional school students (M = 26.700, SD = 6.801).
Research Question 3: Are there significant mean differences between experimental and control group students with respect to their environmental uses?
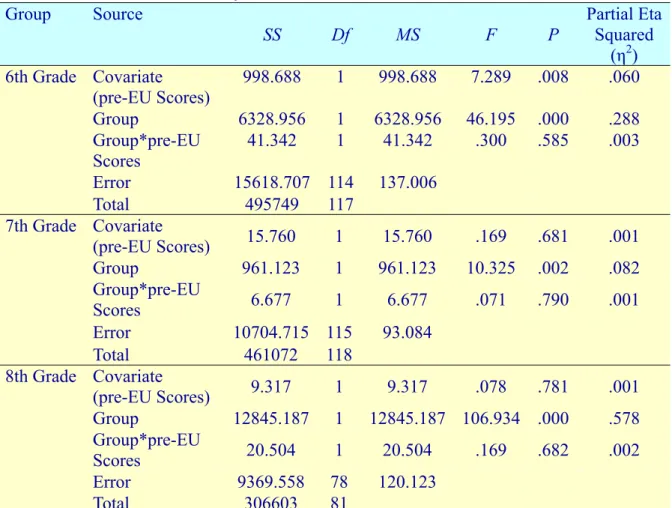
Table 5 ANCOVA Summary for 8th Grade Students’ Environmental Use Scores Group Source
SS Df MS F P Partial Eta Squared (η2) 6th Grade Covariate (pre-EU Scores) 998.688 1 998.688 7.289 .008 .060 Group 6328.956 1 6328.956 46.195 .000 .288 Group*pre-EU Scores 41.342 1 41.342 .300 .585 .003 Error 15618.707 114 137.006 Total 495749 117 7th Grade Covariate (pre-EU Scores) 15.760 1 15.760 .169 .681 .001 Group 961.123 1 961.123 10.325 .002 .082 Group*pre-EU Scores 6.677 1 6.677 .071 .790 .001 Error 10704.715 115 93.084 Total 461072 118 8th Grade Covariate (pre-EU Scores) 9.317 1 9.317 .078 .781 .001 Group 12845.187 1 12845.187 106.934 .000 .578 Group*pre-EU Scores 20.504 1 20.504 .169 .682 .002 Error 9369.558 78 120.123 Total 306603 81
To analyze whether there is a significant mean difference between students enrolling at two different treatment groups, with respect to their environmental use scores, ANCOVAs were run for each grade level (see Table 5). Results revealed that there is a significant mean difference between 6th grade (F(1,114) = 46.195, p = .000, η2 = .28), 7th grade (F(1,115) = 10.325, p = .002, η2 = .082) and 8th grade (F(1,78) = 106.934, p = .000, η2 = .578), treatment groups with respect to their environmental use scores. For all the three grade levels eco-school students (for 6th grade M = 70.385, SD = 9.507, for 7th grade M = 63.355, SD = 7.997; for 8th grade M = 71.975, SD = 3.778) got higher scores than traditional school students
Copyright (C) 2012 HKIEd APFSLT. Volume 13, Issue 2, Article 3 (Dec., 2012). All Rights Reserved. (for 6th grade M = 53.063, SD = 15.022; for 7th grade M = 59.465, SD = 10.478; for 8th grade M = 46.050, SD = 15.028).
Research Question: Are there significant mean differences between experimental and control group students with respect to their environmental concerns?
To test this hypothesis for 6th and 8th grade students, independent samples t-tests were conducted. The results of t-test analyses run for students’ environmental concerns are summarized in Table 6. The results of the analysis revealed that there are significant mean differences between mean scores of 6th grade students (t(115) = 2.189, p = .031, η2 = .04) and 8th grade students (t(79) = 6.026, p = .000, η2 = .31) enrolling eco-school application and students enrolling traditional school. For both of the grade levels, eco-school students got higher scores than control group students.
Table 6 Results of t-test Analysis Run for 6th Grade Students’ Environmental Concerns Group Group N M SD t p 6th grade EG 70 32.257 9.690 2.189 .031 CG 47 27.914 11.648 8th grade EG 41 38.170 5.444 6.026 .000 CG 40 29.275 7.632
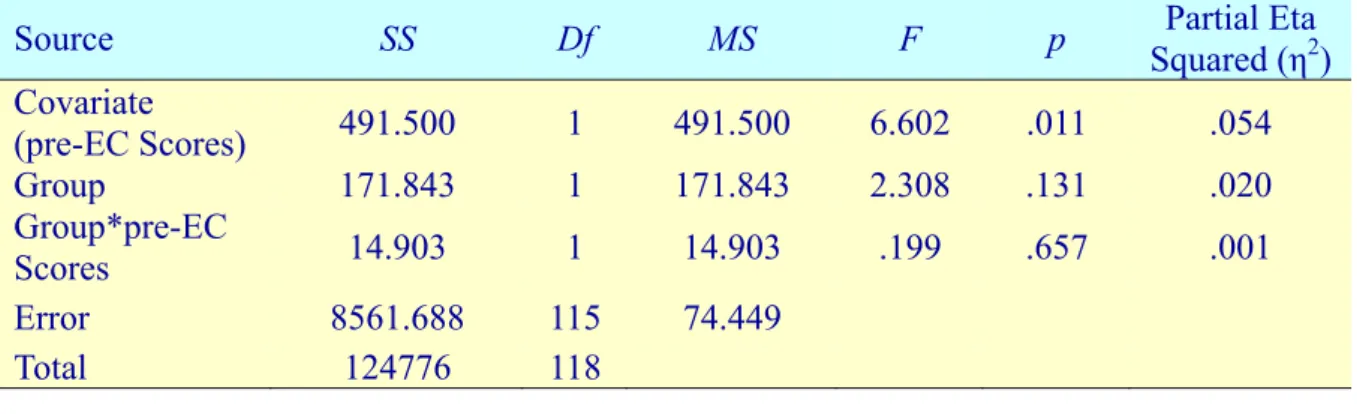
A one-way analysis of covariance is conducted to compare the effectiveness of treatments on 7th grade students’ environmental concerns. Results of analysis revealed that there are no significant differences between treatment groups with respect to their environmental concern scores (F(1,115) = 2.308, p = .131). Table 7 summarizes the ANCOVA results run for the effects of treatments on 7th grade students’ environmental concerns.
Table 7 ANCOVA Summary for 7th Grade Students’ Environmental Concern Scores
Source SS Df MS F p Squared (ηPartial Eta 2)
Covariate (pre-EC Scores) 491.500 1 491.500 6.602 .011 .054 Group 171.843 1 171.843 2.308 .131 .020 Group*pre-EC Scores 14.903 1 14.903 .199 .657 .001 Error 8561.688 115 74.449 Total 124776 118
Copyright (C) 2012 HKIEd APFSLT. Volume 13, Issue 2, Article 3 (Dec., 2012). All Rights Reserved.
Conclusion
To live in a healthy environment and to sustain the natural resources for next generations, citizens in all ages should be aware of their influences on the environment and in accordance with their responsibilities, take the necessary precautions to solve environmental problems. To achieve this, environmental education should provide the necessary knowledge to interpret the natural events, to be aware of environmental problems, thus should improve children’s environmental literacy levels. The eco-school program emerged with a purpose to promote a medium for improving students’ environmental literacy thus, improving the quality of environmental education. Although the program is implemented in a wide area, there is little research to indicate the effectiveness of eco-schools on elementary school students’ environmental knowledge, attitude, uses and concerns; that is measures of environmental literacy. Thus, in this study, effects of eco-school applications on elementary school students’ environmental literacy were investigated.
ELQ consists of questions to assess elementary school students’ environmental knowledge, attitudes, uses and concerns. The pre-test percentages for environmental knowledge questions of both experimental and control group showed that students are not fully knowledgeable about environment. The analysis of the data obtained from post-test applications revealed that, after the application, both statistically and practically significant mean differences exist between elementary school students enrolling eco-school and traditional school in the favour of eco-school students. This result is relevant for all grade levels which are concerned in the present study. These results are expected because during the study, experimental group students conducted many environmental activities as part of the eco-school application. In eco-school, experimental group students conducted environmental review and as a result of this review they conducted several environmental activities to improve the situation of the school. Besides, in experimental group environmental issues were explained not only in science lessons but also in other courses such as social sciences, English, visual arts, music etc.
While the situation in the experimental group was in this way, it was very different in the control group. Although there were many environmental issues in science and technology curriculum, teachers in the control group thought that these issues
Copyright (C) 2012 HKIEd APFSLT. Volume 13, Issue 2, Article 3 (Dec., 2012). All Rights Reserved. are easy for students to learn. For this reason, science teachers did not mainly emphasize environmental topics in science lessons. Besides, the teachers of the other courses did not perform any environmental activities. Even, some courses were not performed regularly such as computer classes, visual art classes etc, during the whole semester. During these class hours, control group students preferred to solve several multiple choice questions and to administer several multiple choice tests for the preparation of students to the SBS examination. But, this approach seems to be ineffective for students to learn environmental issues appropriately.
The second subscale of ELQ was ‘environmental attitudes’. The analysis of the related data exposed that experimental group students’ agreement for attitude items increased at post-tests. Additionally, considering the post-test results, statistically and practically significant differences exist between 6th grade and 8th grade experimental and control group students. Besides, no significant difference was found for 7th grade treatment groups with respect to their environmental attitudes. Based on these results, it can be concluded that eco-school program made a measurable difference in 6th and 8th grade elementary school students’ environmental attitudes. Related literature shows that traditional courses about environment do not affect one’s attitudes toward environmental issues. Various kinds of life experiences are needed in shaping children’s environmental attitudes (Kinsey & Weatley, 1984). Eco-school application differs from traditional school application in many aspects. First of all, eco-school students were actively participated in all steps of the application through eco-teams. They carried out environmental review to determine environmental problems, developed an action plan to improve the environmental situation of their school, monitored and evaluated their progress. Second, eco-school activities provided elementary school students’ life experiences both in school and outside school. During eco-school applications, students planted trees in their school garden and in the campus of Aksaray University, planned one-week spring festival, recycled cans, papers, glass, increased the number and kinds of plants inside the school. With all these activities, eco-school students found chance to involve in environmental activities actively. This active involvement is the possible cause for an increase in eco-school students’ environmental attitudes. Another reason for the significant difference in environmental attitudes may be due to the increase in environmental knowledge. According to Arcury (1990) increased environmental knowledge would foster positive environmental attitudes. In the present study, the increase in 6th and 8th
Copyright (C) 2012 HKIEd APFSLT. Volume 13, Issue 2, Article 3 (Dec., 2012). All Rights Reserved. grade eco-school students’ environmental attitudes may be due to their increased levels of environmental knowledge.
The third subscale of ELQ was ‘environmental use’. When the post-test results are examined, it can be observed that experimental group students’ agreement about the statements increased after the treatment. Results of the present study also revealed that a significant difference exists between 7th grade and 8th grade treatment groups with respect to their environmental use scores. Besides, no significant difference was found for 6th grade treatment groups. Involving in many environmental activities may be the possible explanation of the findings. During the study, experimental group students discussed the advantages and disadvantages of using technology to solve environmental problems, studied the relationship between human and the environment, focused on global and local environmental problems and the ways to solve them, dealed with the roles of nongovernmental foundations and our personal responsibilities to solve the environmental problems and considered the future of environmental problems.
The fourth and the last subscale of ELQ was ‘environmental concerns’. After the treatment, experimental group students’ concern levels increased for ‘smoke pollution’, ‘automobile emissions’, ‘industrial pollutions’, ‘hazardous wastes’, ‘poor water quality’, ‘ozone layer depletion’ and ‘global warming’. Besides, control group students’ concern levels increased for only ‘hazardous wastes’ and ‘ozone layer depletion’. Results of the study revealed that although practically small, statistically significant mean difference exists for 6th grade treatment groups. Results also showed that both statistically and practically significant mean differences exist for 8th grade treatment groups. Studies have shown that experiences in nature increase students’ environmental concern (Palmberg & Kuru, 2000). An increased number of activities conducted in nature may be the cause of increasing environmental concern. Besides, Malkus and Musser (1997) as cited in Yılmaz et al. (2004) expressed that if students have enough environmental knowledge and positive attitudes toward environment then they would be more sensitive to environmental problems. Being consistently with this research, experimental group students’ increased levels of environmental concerns may be due to their increasing levels of environmental knowledge and attitudes.
Overall, the results of the study present a very favorable situation: eco-school applications improve elementary school students’ environmental knowledge, attitudes, uses and concerns. The results of this study are consistent with the results
Copyright (C) 2012 HKIEd APFSLT. Volume 13, Issue 2, Article 3 (Dec., 2012). All Rights Reserved. of previous research (Aktepe & Girgin, 2009; Bajd & Leščanec, 2011; Krnel & Naglic, 2009). Research findings showed that eco-schools are effective to improve students’ environmental knowledge and environmental awareness. With this study, it is proved that eco-school application foster elementary school students’ environmental literacy. Eco-schools provide a learning environment both in and out school in which to explore what a sustainable lifestyle means. With eco-school application, students found rich learning settings in which they can participate environmental activities actively. Importance of active participation is emphasized by several researchers. Orr (1992) states that “ecological literacy is becoming more difficult, I believe, not because there are fewer books about nature, but because there is less opportunity for direct experience of it” (p. 88). It is clear that simply providing more knowledge to people does not necessarily lead to an increase in their environmental literacy. This study addresses an alternative way to educate environmentally literate children.
On the basis of the findings of the present study, there are some recommendations for further researches. First of all, the results presented in this study are valid only for the schools participated and are not generalized. A similar study can be conducted to urban and rural schools having students with different backgrounds. By this way, it will be possible to generalize the effects of eco-school applications on students’ environmental literacy. It would be also interesting to replicate this study with students from different locations and cultures. Perhaps, this kind of research could be conducted internationally to look for similarities and variations. Additional studies may be conducted to investigate the effectiveness of eco-schools on primary school and high school students’ environmental literacy. Although eco-schools are widespread there are not enough studies questioning eco-schools’ effectiveness. Another area for future study would be to conduct the same research by using other variables. A limited number of variables could be considered in the present study. It is worth to study investigating the effects of eco-schools on different variables other than environmental literacy such as environmental values, beliefs etc. Besides, gender and grade level seem to be effective on improving elementary school students’ environmental literacy through eco-schools. Further investigations of other factors that may influence the environmental literacy are required. Increasing the time frame may be another focus point for future studies. The time frame for this study was not sufficient to study the long term retention of environmental literacy, and the extent of its continued impact on environmental attitudes and behaviors. While the initial results are favorable, there is no certainty
Copyright (C) 2012 HKIEd APFSLT. Volume 13, Issue 2, Article 3 (Dec., 2012). All Rights Reserved. that the acquired literacy will be retained. It is worth to conduct a longitudinal study and assess its effects.
Reference
Aktepe, S. & Girgin, S. (2009). İlköğretimde eko-okullar ve klasik okulların çevre eğitimi açısından karşılaştırılması. İlköğretim Online, 8(2), 401-414.
Arcury, T. A. (1990). Environmental attitude and environmental knowledge. Human
Organization, 49(4), 300-304.
Bajd, B. & Leščanec, T. (2011). The influence of the eco-school and healthy school projects on environmentally responsible behavior of primary school pupils. Education and
Health Care, 21, 79-85.
Bybee, R. W., & DeBoer, G. E. (1994). Research on goals for the science curriculum. In: Dorothy Gabel (Ed.), Handbook of Research on Science Teaching and Learning. National Science Teachers Association. New York: Macmillan.
Cutter, A. (2002). The value of teachers’ knowledge: Environmental education is a case study.
Annual Meeting of the American Educational Research Association. New Orleans,
LA.
Daudi, S. S. (2008). Environmental literacy: A system of best-fit for promoting environmental awareness in low literate communities. Applied Environmental Education &
Communication, 7(3), 76-82.
Hungerford, H.R., & Peyton, R.B. (1977). A paradigm of environmental action. (ERIC Documentation Service ED137116).
Hungerford, H., & Volk, T. (1990). Changing learner behavior through environmental education. Journal of Environmental Education, 21(3), 8–22.
Kaplowitz, M. D. & Levine, R. (2005). How environmental knowledge measures up at a big ten university. Environmental Education Research, 11(2), 143-160.
Kinsey, T. G. & Weatley, J. H. (1984). The effects of environmental studies course on the defensibility of environmental attitudes. Journal of Research in Science Teaching, 21, 675-683.
Krnel, D. & Naglic, S. (2009). Environmental literacy comparison between eco-schools and ordinary schools in Slovenia. Science Education International, 20(1), 5-24.
Michail, S., Stamou, A. G., & Stamou, G. P. (2007). Greek primary school teachers’ understanding of current environmental issues: An exploration of their environmental knowledge and images of nature. Education, 91(2), 244-259.
Orr, David W. (1992). Ecological literacy: Education and transition to a postmodern world. New York: State University of New York Press.
Palmberg, I. E. & Kuru, J. (2000). Outdoor activities as a basis for environmental responsibility. The Journal of Environmental Education, 31(4), 32-36.
Palmer, J. A. (2003). Environmental education in the 21st century: theory, practice, progress
and promise. Taylor & Francis e-Library.
Roth, C. E. (1968). On the road to conservation. Massachusetts Audubon, June 1968, pp.38-41.
Roth, C. E. (1996). Benchmarks on the way to environmental literacy K-12. Massachusetts
Secretary’s Advisory Group on Environmental Education, Littleton. January, 1996.
Rothkrug, P. & Olson, R. L., (1991). Mending the Earth: A World for our Grandchildren. Io Series, Issue # 43. North Atlantic Books: California.
Copyright (C) 2012 HKIEd APFSLT. Volume 13, Issue 2, Article 3 (Dec., 2012). All Rights Reserved. Tuncer, G., Tekkaya, C., Sungur S., Çakıroğlu, J., Ertepınar, H. & Kaplowitz, M. (2009).
Assessing pre-service teachers’ environmental literacy in Turkey as a mean to develop teacher education programs. International Journal of Educational Development. doi:10.1016/j.ijedudev.2008.10.003.
Vaske, J.J., & Kobrin, K.C. (2001). Place attachment and environmentally responsible behavior. Journal of Environmental Education, 32(4), 16-21.
Wilke, R. (1995). Environmental literacy and the college curriculum. EPA Journal, 21(2), 28-30.
Yılmaz, Ö., Boone, W.J., Andersen, H.O. (2004). Views of elementary and middle school Turkish students toward environmental issues. International Journal of Science
Education, 27(12), 1527-1546.
Websites:
http://www.eco-schools.org
http://www.eco-schools.org.uk