T.C.
ISTANBUL AYDIN UNIVERSITY INSTITUTE OF GRADUATE STUDIES
ASSESSMENT OF LIBYAN ECONOMY THROUGH KEY ECONOMIC PERFORMANCE INDICATORS USING TOPSIS METHOD
THESIS
RIM H MOHAMED ELDINALI
Department of Business Business Administration Program
T.C.
ISTANBUL AYDIN UNIVERSITY INSTITUTE OF GRADUATE STUDIES
ASSESSMENT OF LIBYAN ECONOMY THROUGH KEY ECONOMIC PERFORMANCE INDICATORS USING TOPSIS METHOD
THESIS
RIM H MOHAMED ELDINALI (Y1612.130015)
Department of Business Business Administration Program
Thesis Advisor: Asst.Prof. Dr. Çiğdem ÖZARI
DECLARATION
I hereby declare that all information in this thesis document has been obtained and presented in accordance with academic rules and ethical conduct. I also declare that, as required by these rules and conduct, I have fully cited and referenced all material and results, which are not original to this thesis.
FOREWORD
The Libyan economy has suffered for a long time from an undemocratic political regime, followed by instabilities after the revolution in 2012. Therefore, it is important to understand the factors that are hindering the development and identify the key factors that could assist in the development and growth process. As an oil-rich country, there are a huge potential for Libya to build and expand its economy. The strategic geographic location and the availability of financial means form a great recipe for a successful pursuit. The current research enhanced my understanding for my country’s economy and allowed to develop experience in machine-learning techniques that are beneficial in economic planning and management. The outcomes of this research can be the corner stone or a push for a great Libya with a bright future for its citizens.
I would like to thank my thesis advisor Dr. Çiğdem Özarı for support and advice to develop and complete this research. Many thanks to my family for their patience and support.
TABLE OF CONTENT
Page
FOREWORD ... iv
TABLE OF CONTENT ... v
ABBREVIATIONS ... vi
LIST OF FIGURES ... vii
LIST OF TABLES ... viii
ABSTRACT ... ix
ÖZET ... x
1. INTRODUCTION ... 1
1.1 Research Overview and Significance ... 1
1.2 Aim of Study ... 3
1.3 Research Scope and Thesis Structure ... 3
2. LITERATURE REVIEW ... 5
2.1 Economic Key Performance Indicators (KPIs) ... 5
2.1.1 Exportation and importation of goods ... 5
2.1.2 Foreign direct investment (FDI) ... 6
2.1.3 Inflation and foreign currency exchange rate ... 7
2.1.4 Labor force and unemployment ... 9
2.1.5 Oil production and energy imports ... 10
2.1.6 GDP ... 11
2.2 Multi-Criteria Decision-Making Methods and their Applications ... 11
2.3 TOPSIS Technique and its Applications ... 16
2.4 Libyan Economy and Economic Performance Studies ... 22
3. METHODOLOGY AND APPLICATION ... 28
3.1 Methodology Design and Data for Libyan Economy ... 28
3.2 TOPSIS Application and Discussion ... 31
4. CONCLUSIONS ... 38
REFERENCES ... 41
ABBREVIATIONS
AHP : Analytic Hierarchy Process ANP : Analytic Network Process
CFNAI : Chicago Fed National Activity Index
DEMATEL : Decision making trial and evaluation laboratory ELECTRE : Elimination and Choice Expressing Reality EPI : Economic Performance Index
FDI : Foreign Direct Investment GDP : Gross Domestic Product HC : Human Capital
MAUT : Multi-Attribute Utility Theory
MCDM : Multi-Criteria Decision-Making technique MENA : Middle East and North Africa
MRW : Mankiw, Romer and Weil model
OECD : The Organization for Economic Cooperation and Development PROMETHEE: Preference Ranking Organization Method for Enrichment
Evaluation
SAW : Simple Additive Weighting ServQual : Service Quality
SMART : Simple multi-Attribute Rating Technique
TOPSIS : Technique for Order Preferences by Similarity to Ideal Solutions US : United States
LIST OF FIGURES
Page
Figure 2.1: The Relationship between Unemployment Rate and Inflation... 8
Figure 2.2: General MCDM Technique Selection and Application Process ... 12
Figure 2.3: Classification of MCDM Techniques Based On Their Data Usage ... 15
Figure 2.4: Contribution of Oil and Non-Oil Production in Libyan Public Budget . 22 Figure 2.5: Per Capita GDP in Libyan Dinars ... 23
Figure 2.6: Log Graph Presenting Human Capital per Labor Force (H/L) In Libya 24 Figure 2.7: The Interrelation between Oil Exportation and GDP in Libya... 24
Figure 2.8: Best-Fit Graph for Inflation Rate Changes With The Increase Of Oil Prices ... 26
Figure 2.9: The similarity in change profile between the Libyan real GDP and effective exchange rate index ... 26
Figure 2.10: Behavior of GDP, FDI and human capital (HC) in Libya between 2000 and 2015 ... 27
Figure 3.1: Comparison between Export and Import Volumes of Libya from 2009 to 2017 ... 29
Figure 3.2: Foreign Direct Invest in Libya from 2009 to 2017... 30
Figure 3.3: Labor force and unemployment in Libya from 2009 to 2017 ... 30
LIST OF TABLES
Page Table 2.1: A comparison between several MCDM methods (Velasquez & Hester,
2013) ... 13
Table 2.2: A compiled literature survey of business administration and management studies that used the TOPSIS techniques ... 18
Table 3.1: Economic Indicators Used For the Evaluation ... 31
Table 3.2: Libyan Economy Data Used For TOPSIS Application (Decision Matrix) ... 31
Table 3.4: Normalized Decision Matrix ... 33
Table 3.5: Weighted Decision Matrix ... 33
Table 3.6: Calculation of Positive and Negative Solutions ... 34
Table 3.7: Separation Measurement from Positive Ideal Solution... 34
Table 3.8: Separation measurement from negative ideal solution ... 34
Table 3.9: Relative closeness coefficient and order of year from best to worst based on data of the Libyan economy ... 35
ASSESSMENT OF LIBYAN ECONOMY THROUGH KEY ECONOMIC PERFORMANCE INDICATORS USING TOPSIS METHOD
ABSTRACT
The need for economic development and growth gave the research through economic performance indicators a great significance. Considering the limitations of the current equations and models, there is a need for a more complex machine-learning approach to assess economic performance over several years for comparison and precise outcomes. Multi-criteria decision-making techniques (MCDMs) are widely used to compare attributes and select alternative in complex decision-making problems. While the main source of data is often the input of experts from the field, adopting actual economic data can eliminate the uncertainty factor of the MCDM and provide more accurate results. The current study aims to assess the performance of the Libyan economy between the years of 2009 and 2017 using the TOPSIS method in order to understand the factors that contributed into enhancing the economy in the best years. The TOPSIS method is widely used in economic and management applications, as it is helpful in determining the alternative that is the closest to the ideal solution. Through studying the economic factors affecting the Libyan economy between 2009 and 2017, the findings of the research show that 2017 was the best year for economic performance. Prior the late political instability in the country, 2010 is indicated as the second-best year for economic performance with 20.18% enhanced performance from the year before. The worst years for economic performance in Libya were between 2012 and 2014 due to the civil war between the different political and militant powers in the country. However, from 2015 to 2017 a substantial enhancement in the economic performance is observed during a stability period. The current crisis in the country highlighted the impact of oil-dependency on the Libyan economy. Thus, it is understood that adopting oil as the main income of the country increase the vulnerability of the economy and has impacts on the other economic factors, including foreign currency exchange rates. Keywords: economic performance indicators; Libya; TOPSIS
LĠBYA’NIN EKONOMĠK PERFORMANSININ TOPSIS YÖNTEMĠYLE DEĞERLENDĠRĠLMESĠ
ÖZET
Ekonomik gelişme ve büyüme ihtiyacı, ekonomik performans göstergeleriyle araştırmaya büyük önem verdi. Mevcut denklem ve modellerin sınırlarını göz önünde bulundurarak, karşılaştırma ve kesin sonuçlar için ekonomik performansı birkaç yıl boyunca değerlendirmek için daha karmaşık bir makine öğrenme yaklaşımına ihtiyaç vardır. Çok kriterli karar verme teknikleri (MCDM'ler), nitelikleri karşılaştırmak ve karmaşık karar verme problemlerinde alternatif seçmek için yaygın olarak kullanılmaktadır. Temel veri kaynağı çoğu zaman alandaki uzmanların girdisi olsa da, gerçek ekonomik verilerin benimsenmesi MCDM'nin belirsizlik faktörünü ortadan kaldırabilir ve daha doğru sonuçlar sağlayabilir. Mevcut çalışma, ekonomiyi en iyi yıllarda arttırmaya katkıda bulunan faktörleri anlamak için 2009-2017 yılları arasında TOPSIS yöntemini kullanarak Libya ekonomisinin performansını değerlendirmeyi amaçlamaktadır. TOPSIS yöntemi, ekonomik ve yönetim uygulamalarında yaygın olarak kullanılır, çünkü ideal çözüme en yakın olan alternatifi belirlemede yardımcı olur. 2009-2017 yılları arasında Libya ekonomisini etkileyen ekonomik faktörleri inceleyerek yapılan araştırmanın bulguları, 2017'nin ekonomik performans için en iyi yıl olduğunu göstermektedir. Ülkedeki geç siyasi istikrarsızlıktan önce, 2010, bir önceki yıla göre% 20,18 artırılmış performansla ekonomik performans için en iyi ikinci yıl olarak gösterilmektedir. Libya'daki ekonomik performans için en kötü yıl, ülkedeki farklı siyasi ve militan güçler arasındaki iç savaş nedeniyle 2012 ile 2014 arasındaydı. Ancak, 2015 ile 2017 arasında bir istikrar döneminde ekonomik performansta önemli bir artış gözlenmektedir. Ülkedeki mevcut kriz, petrole bağımlılığın Libya ekonomisine etkisini vurguladı. Dolayısıyla, petrolü ülkenin ana geliri olarak kabul etmenin ekonominin kırılganlığını arttırdığı ve döviz kurları dahil olmak üzere diğer ekonomik faktörler üzerinde etkisi olduğu anlaşılmaktadır.
1. INTRODUCTION
1.1 Research Overview and Significance
Key performance indicators are used in economic studies to investigate or test a certain phenomenon and suggest the suitable recommendations for development. Several methods have been suggested to provide an indication of the performance of a specific economy, such as the economic performance index EPI (Khramov and Lee, 2013) and Chicago Fed National Activity Index (CFNAI) (Evans, Liu, & Pham-Kanter, 2002). Different studies have considered several performance indicators; however, the majority of research had a consensus on indicators like the GDP, FDI, inflation and unemployment (Tampakoudis, et al., 2014; Alzaidy, et al., 2017; Gungor and Ringim, 2017; Kargi, 2014), while other studies included economy-specific indicators, such as oil production, expatriate population and foreign exchange rates (Radda, et al., 2015; Barguellil, et al., 2018; Lowell & Findlay, 2001). Therefore, it is important to include the common economic indicators in the performance assessment, while ensuring that the economy-specific indicators are considered and highlighted.
Furthermore, the method of assessment is one of the important factors that determines the accuracy of the final results, response and economic measures. Equations were widely invented and used for that purpose (Wilson & Briscoe, 2004). Nonetheless, machine learning solutions and algorithms have not been utilized for that purpose, despite their proven success in solving complex decisions in different domains, including economy and management. Multi-criteria decision making (MCDM) methods are a group of solutions that can be used in order to determine the most influential factors, the interrelations between these factors and/ or the measures that can be implement ed for best and desired outcomes (Jayant & Sharma, 2018). The logical sequence of MCDMs allows for breaking down the problem into parts and steps; simplifying the
problem and providing a mathematical model that can be implement ed to reach precise conclusions (Singh & Malik, 2014).
Each MCDM method have been applied in several studies that investigated their strengths, weaknesses, possible applications and the accuracy of their results. While some MCDMs are known for their ability to determine the relative importance of attributes versus each other, such as AHP, MCDMs like TOPSIS are known for an approach that calculates the most ideal solution, the worst solutions and compare the available alternatives to them. Therefore, the utilization of TOPSIS in economic and management studies allowed researchers and practitioners to handle decision-making in human resources, supply chain management, marketing, business processes and strategy management (Velasquez & Hester, 2013). The conventional form of MCDMs depend on input from experts to evaluate attributes and alternatives based on their experience. Several models have been created to enhance the accuracy and precision of the results, such as stochastic and fuzzy models (Tri antaphyllou, et al., 1998). However, a few studies have considered attributes that are based on actual data, such as economic indicators that are presented in the current study. Following acquiring the necessary data and constructing the initial decision matrix between the attributes and the alternatives for the TOPSIS method, a normalized decision matrix is calculated. Weights are incorporated into the normalized decision matrix to consider the difference in effect amongst the attributes and to produce the weighted decision matrix. Ideal positive and negative solutions are calculated, as well as the separation measures between the weighted decision matrix elements and the ideal solutions. Finally, a relative closeness coefficient for each alternative is calculated indicating its closeness from the ideal solutions (Hwang & Yoon, 1981).
The case study in the current research is performed on the performance of the Libyan economy. Concerned literature observed the high dependency of the Libyan economy on oil production as the main product and source of income (Ali, 2011) , which hindered development besides lack of national development plans, processes and systems (Triki, 2017). The fluctuating oil market affected the Libyan economy with instability and influenced other factors, such as exchange rates, GDP and employment, as well as growth and development
(Yahia & Metwally, 2007). In the late years of instability on the political and security levels, the high dependency on oil exports had severe impacts on the country, especially during the civil was between 2012 and 2014 (Bhattarai & Taloba, 2017). Foreign currency exchange rates were also one of the most instable economic factors in the selected years of the current study. Thus, oil production and exchange rates are emphasized in the application of the TOPSIS method.
1.2 Aim of Study
The main aim of this research is to assess the performance of the Lib yan economy between the years of 2009 and 2017 using the TOPSIS method in order to understand the factors that contributed into enhancing the economy in the best years. A good understanding of the key economic indicators, the status of the Libyan economy during the study period and the TOPSIS method is necessary in order to achieve the main aim. Therefore, the following objectives are set for the research:
Study the key economic indicators that are used for the assessment of the performance a country’s economy.
Understand the factors affecting the Libyan economy performance and the drawbacks that are hindering growth and development.
Study the TOPSIS method in terms of its mathematical model, as well as its applications and developments in the literature.
Apply the TOPSIS method for the evaluation of the performance of the Libyan economy between the years of 2009 to 2017.
Determine the best and worst years for the economic performance in Libya, in addition to the factors that can affect it.
Provide recommendations for policy and economy strategic planning for the enhancement of the development and growth pace for Libya.
1.3 Research Scope and Thesis Structure
The current research is mainly concerned with the economic performance of Libya in the years of instability between 2009 and 2017. The TOPSIS method is
used as an MCDM mathematical model that can assist the researcher to determine the best and worst economic conditions experienced by the country. Nine key economic performance indicators are considered in the research, which are exportation, importation, labor force, unemployment rate, inflation (GDP deflator), net secondary income, exchange rates and oil production. The thesis report presents the outcomes of the research and it is divided into four chapters:
Introduction: a highlight of the significance of the study, the aim of the research and the scope of the investigation.
Literature review: a survey from literature sources for the most important economy performance indicators, the MCDM methods with emphasis on TOPSIS, and the status and performance of the Libyan economy.
Methodology and Application: An explanation of the used method and an application on the data from the Libyan economy, in addition to a discussion to the research outcomes.
Conclusions: a summary of the research outcomes and recommendations for policy and planning for the Libyan economy.
2. LITERATURE REVIEW
2.1 Economic Key Performance Indicators (KPIs)
There is no single economic performance indicator that can measure the economic status and development in a country, despite the different attempts to create equations that can provide an insight using input factors, such as G ross Domestic Product (GDP) and budget deficit. Khramov and Lee (2013) proposed a model called the economic performance index (EPI) that is based on four main economic inputs; inflation rate, unemployment rate, budget deficit and GDP. Other more comprehensive systems were used, such as the Chicago Fed National Activity Index (CFNAI) that considers eighty-five indicators. It includes measurement of different sectors within the economy and studies have shown the probability of its benefit in predicting recessions through changes in the economic indicators (Evans, Liu, & Pham-Kanter, 2002). This section explores several economic indicators that are used as inputs to evaluate the economic performance of a country.
2.1.1 Exportation and importation of goods
Exportation and importation activities are defined as goods that produced within or outside the country and removed or entered into the custom area of the country, respectively (Kartikasari, 2017). The volume of exports and imports have been correlated to economic growth in several case studies in different countries. The main economic growth indicator that was used in these studies is the country’s GDP (Bakari & Mabrouki, 2017). The correlation and impact between these indicators is expected, since the total exports and total imports of a country are key determinants of the gross domestic product (GDP) (Uddin & Khanam, 2017).
Khan, et al. (2012) and Hye (2012) found correlations between the change in GDP and the change in the exportation and importation volumes in the Pakistani and Chinese economies, respectively. Albiman and Suleiman (2016) found that
exportations and importation volumes have impacts on determining the country’s GDP in Malaysia. Nonetheless, Ajmi, et al. (2013) and Abugamea (2015) showed results that did not imply any correlation or impact between GDP and the volumes of exports and imports in the South African and Palestinian economies. The aforementioned studies have based their conclusions on data of several years; ranging between 37 to 100 years.
2.1.2 Foreign direct investment (FDI)
The International Monetary Fund (IMF) and the Organization for Economic Cooperation and Development (OECD) define foreign direct investment as the initial and long-lasting business relationship between a direct investor and an investment enterprise, where capital transactions occur by transferring funds from overseas to the local economy. The IMF restricts its definition to the condition of the foreign investor owning a minimum of 10% of the enterprise’s capital and a maximum of 50% to become an associate. Moreover, the enterprise is considered a subsidiary of a foreign investment if the foreign investment exceeds 50% (Duce & de Espana, 2004).
FDI is stated if the foreign investor acquires a controlling stake at the holding company at the host economy. The choice of the investment is based on market demands and feasibility for the industry and the product at the host market, which then determines the type of FDI to be horizontal: establishing an affiliated company in the new market to produce a final product in it, vertical: establishing an affiliated company in the new market to produce an intermediate product in it driven by production costs, or complex: a mixture between the horizontal and the vertical types. The types of FDI clarify the motivations of the investors to create affiliations in foreign countries, which is mainly driven by cost, market investment opportunities and market consumptio n demands (Alfaro & Chauvin, 2020).
The positive impacts of increasing FDI in an economy are suggested to enhance economic growth, GDP, and regenerate confidence in the market by other investors to enter the local economy (Alfaro & Chauvin, 2020). Owusu-Antwi, et al. (2013) studied the Ghanaian economy twenty-three years for the effects of FDI on macroeconomic indicators. The results of the study show that the
impacts on all factors were significant with a total R square value of 0.947 at the regression analysis. The macroeconomic factors studied included exchange rates, inflation, trade openness, GDP, while the availability of natural resources, open attitude towards investment and infrastructure contributed into simulating more FDI into the country’s economy (Owusu-Antwi, et al., 2013).
Alzaidy, et al. (2017) studied the impact of the financial development on the economic growth for thirty-nine years, with the mediating effect of FDI on their relationship. The authors found that FDI increased the positive effect of financial development, especially with FDI spill overs. Ibrahim, et al. (2019) researched 46 African economies over thirty-six years and found that FDI is simulated into the economy if the country financial sector is developed and adequate information, communication and technology infrastructures are implemented. Djordjevic, et al. (2015) studied the relationship between FDI and each of unemployment rates, GDP and export volume in Croatia over fifteen years and found that a 1% increase in FDI would reduce unemployment in the country by 31%, while FDI was positively correlated to increasing GDP and export volume. Gungor and Ringim (2017) confirmed that FDI is considered one of the main drivers and predictors of economic growth.
2.1.3 Inflation and foreign currency exchange rate
Inflation is identified in the economy through either the continuous rise in the price levels of goods or services, or the reduced value of a currency against worldwide currencies. Monitoring inflation is performed over an extended period of time over several months. The usual cause of inflation is the increase in the quantity of money printed in comparison with the national output, which is a measurement taken by central banks to close government budget deficits, to resist high exchange rates against influential exchange currencies, such as the American dollar, or according to the economic theory, when unemployment is reduced (Labonte, 2011).
Despite the conceptual understanding of inflation in relation with other financial variables, some research showed that inflation rates did not increase significantly with the increase of money supply. Such as case is shown through the case study of Tabi and Ondoa (2011), who studied the Cameroonian
economy using a VAR model for more than forty years. Islam, et al. (2017) attributed this behavior to the actual demand on money in the market and confirmed that the relationship is proven to be positive through studi es over long time periods. The authors investigated the relationship between inflation and each of unemployment and US dollar exchange rates in Malaysia. The regression model showed that exchange rates had the highest impact on inflation, followed by unemployment rate and money supply.
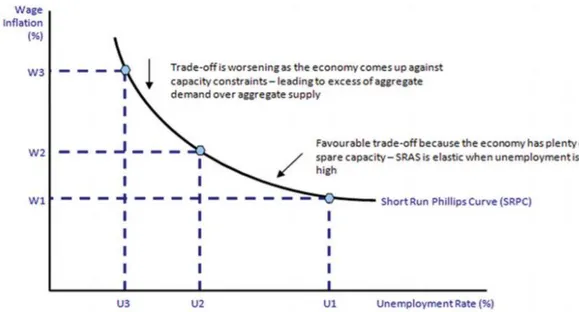
The negative relationship between exchange and unemployment rates with inflation are explained through economic theories. The Phillips curve, shown in Figure 2.1, illustrate the relationship between the increase in wage infl ation with the reduction of the unemployment rate. Full employment in the market causes shortages in money supply that needed for wage increases, which leads to the increase in prices in the market to cover this shortage (Islam, et al., 2017). The quantity of money theory by Friedman (1969) establishes the relationship between money supply and other macroeconomic factors, as shown in equation 1:
(1)
where,
M = quantity of money (money supply), V = the velocity of money circulation, P = price level, Y = national income
Figure 2.1: The Relationship between Unemployment Rate and Inflation
Exchange rates have also their significant influence on the economy and vice versa. It was established earlier that financial development has positive effects on economic growth; however, this volatility in exchange rates can lessen these positive effects. Therefore, stability in exchange rates are considered key in empowering the effects of financial development (Ehigiamusoe & lean, 2019). An analysis of eighteen economies confirmed the significance of exchange rate fluctuations on reducing the growth in the economy as a result of financial development (Basirat, et al., 2014). Instability of exchange rates alone has negative impacts on economic growth, especially if the country adopts financial openness and a flexible exchange rate strategy (Barguellil, et al., 2018). Ramasamy and Abar (2015) performed an empirical research in the macroeconomic factors that influence exchange rates and found that stable interest rates, lessened inflation rates and lessened unemployment has positiv e and influential impacts on enhancing exchange rates.
2.1.4 Labor force and unemployment
The participation level of the labor force and unemployment are two of the most intercorrelated macroeconomic factors in the literature (Ozerkek, 2013). Moreover, it is important to understand the definitions of both concepts in order to know their inclusions and exclusions of the work force population. Unemployment is a rate that includes people within the work force that are without jobs, available for work and actively seeking employment (Byrne & Strobl, 2009). Labor force participation rate is the percentage of the labor force that is currently employed through dividing the population into unemployed, employed and out of the labor force (Bullard, 2014). Data from the literature and theoretical studies show that unemployment affects labor force participation, while unemployment is influenced by several factors, including wage levels, prices and money supply (Kanapathy & Baharom, 2013). The working population according to US statistics consists of all population between the ages of 24 and 54. Therefore, labor force participation, employment rate and unemployment rates are calculated using equations 2, 3 and 4, respectively (Bown & Freund, 2019):
(2) (3) (4) Kargi (2014) correlated labor force participation with the economic growth in Turkey a positive correlation between labor force and employment rates and a negative correlation between the labor participation rate and the unemployment rate. Through a sixth-degree polynomial consisting of six employment variables, the author concluded that the growth in the economy c an be not reflected into employment and labor force variables. In countries that include significant numbers of immigrants, data analyses showed that the challenge is higher for an immigrant to find employment in the new community, which extends to the second generation of immigrants (Gorodzeisky & Semyonov, 2017). Andrei, et al. (2016) found that age, education levels, gender and ethnicity are all determinants of work force participation and affect, subsequently, unemployment rates.
2.1.5 Oil production and energy imports
Despite all the attempt to find energy substitutions, oil and gas remain the main source of energy worldwide and they are considered part of the national security of all countries. The complex processes that accompany oil production and consumption make the issue complicated and tied to many factors, including availability, costs, energy losses and technological developments. Costs that are associated with exploration are the main obstacle in front of a lot of count ries due to the high costs of the required technology. (Seljom & Rosenberg, 2011). Moreover, the oil and gas sectors provide employment for 40% of the labor force in the Alberta region in Canada (Mansell, et al., 2012) and 44% of the employment in the MENA region in 2010 (Radda, et al., 2015).
Samawi, et al. (2017) performed a study on energy importing countries and found that oil and gas imports are highly correlated to debt levels, inflation, cost of production, spending, sales tax and economic growth. Mardiana, et al. (2013) investigated the factors that affect oil imports in Indonesia and found that
transportation consumption is more influential that the economic growth of the country. The measures recommended for the study to decrease the dependence on oil importation were mainly addressed to utilization of natural gas and increase of oil production. Countries that lack oil and gas resources have several options in order to reduce the risks that are associated with energy im ports, including the development of renewable energy, increase oil and gas exploration activities, utilization of engineering to increase energy efficiency and diversification of their energy portfolio (Esen, 2016).
2.1.6 GDP
The calculation of GDP is dependent on population consumption volume, investment, the volume of expenditure by the government and the difference between the total exports and imports (Uddin & Khanam, 2017). Furthermore, GDP has its influence on political instabilities, power shortages and fluctuating and high oil prices in developing countries (Kira, 2013). GDP is also considered the main economic indicator for the wellbeing of the economy as it reflects the actual consumptions and expenditures of the country (Dynan & Sheiner, 2018). Tampakoudis, et al. (2014) investigated the European economies following the financial crisis and found that there are opportunities for sustainable economic development indicated by the GDP growth that were shown in the Eurozone in the past years. Therefore, the country’s GDP is an indication of the economic wellbeing, as well as a prediction factor for economic and politic al issues.
2.2 Multi-Criteria Decision-Making Methods and their Applications
Multi-Criteria Decision-Making (MCDM) methods are an essential part of research and application of several domains, including business, science and engineering. The popularity of MCDMs emerge from their ability to rationalize complex decision-making problems and make their components more explicit, as well as provide efficient solutions. Problems that are treated through MCDM techniques are usually complex and require taking decisions based on several criteria and have several alternatives as solution. Moreover, advances in technology and computational techniques allowed the utilization of these methods in timely manners (Jayant & Sharma, 2018).
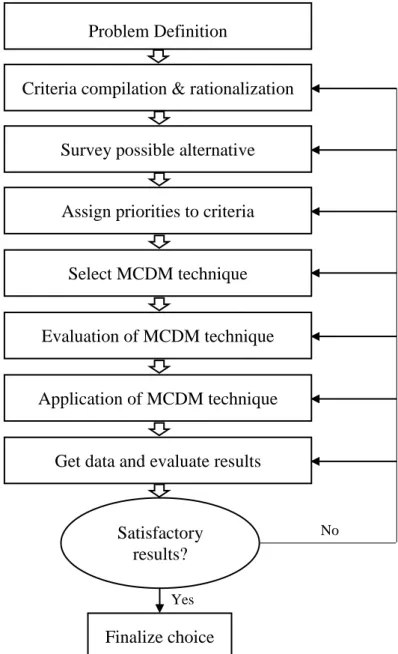
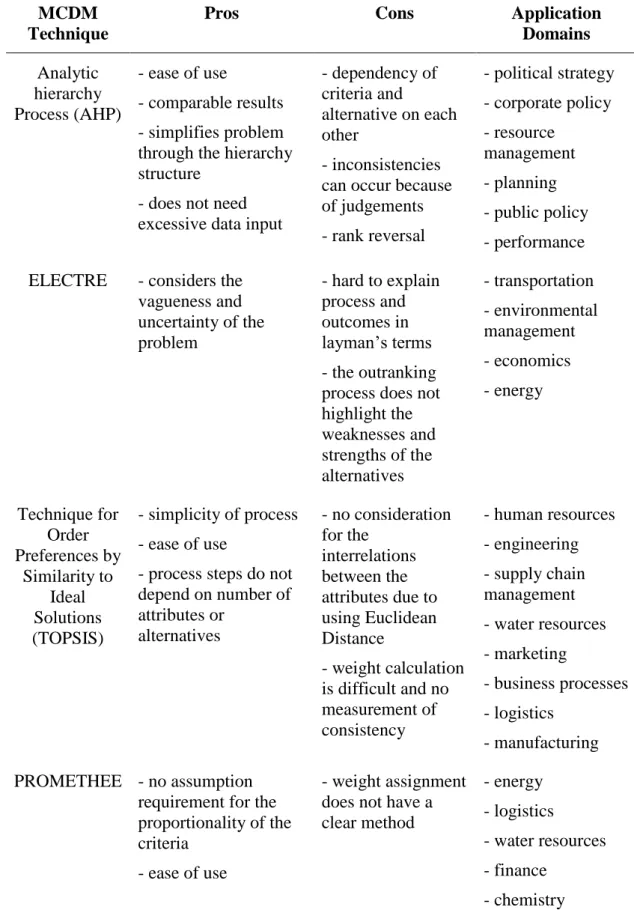
The general steps of choosing and applying an MCDM technique are shown in Figure 2.2. There are many MCDM methods that were developed based on different mathematical models and processes. The methods differ in their objective and focus. While some methods focus on criteria ranking, other can emphasize alternative selection or reiterating inputs for more accurate results (Velasquez & Hester, 2013). Table 2.1 shows a comparison between some of the MCDM techniques, along with their advantages, disadvantages and application domains.
Figure 2.2: General MCDM Technique Selection and Application Process
Source: (Singh & Malik, 2014).
Problem Definition
Criteria compilation & rationalization
Survey possible alternative
Assign priorities to criteria
Select MCDM technique
Evaluation of MCDM technique
Application of MCDM technique
Get data and evaluate results
Satisfactory results?
Finalize choice Yes
Table 2.1: A comparison between several MCDM methods (Velasquez & Hester, 2013)
MCDM Technique
Pros Cons Application
Domains Analytic hierarchy Process (AHP) - ease of use - comparable results - simplifies problem through the hierarchy structure
- does not need excessive data input
- dependency of criteria and
alternative on each other
- inconsistencies can occur because of judgements - rank reversal - political strategy - corporate policy - resource management - planning - public policy - performance ELECTRE - considers the
vagueness and uncertainty of the problem - hard to explain process and outcomes in layman’s terms - the outranking process does not highlight the weaknesses and strengths of the alternatives - transportation - environmental management - economics - energy Technique for Order Preferences by Similarity to Ideal Solutions (TOPSIS) - simplicity of process - ease of use
- process steps do not depend on number of attributes or alternatives - no consideration for the interrelations between the attributes due to using Euclidean Distance - weight calculation is difficult and no measurement of consistency - human resources - engineering - supply chain management - water resources - marketing - business processes - logistics - manufacturing PROMETHEE - no assumption
requirement for the proportionality of the criteria
- ease of use
- weight assignment does not have a clear method - energy - logistics - water resources - finance - chemistry - hydrology
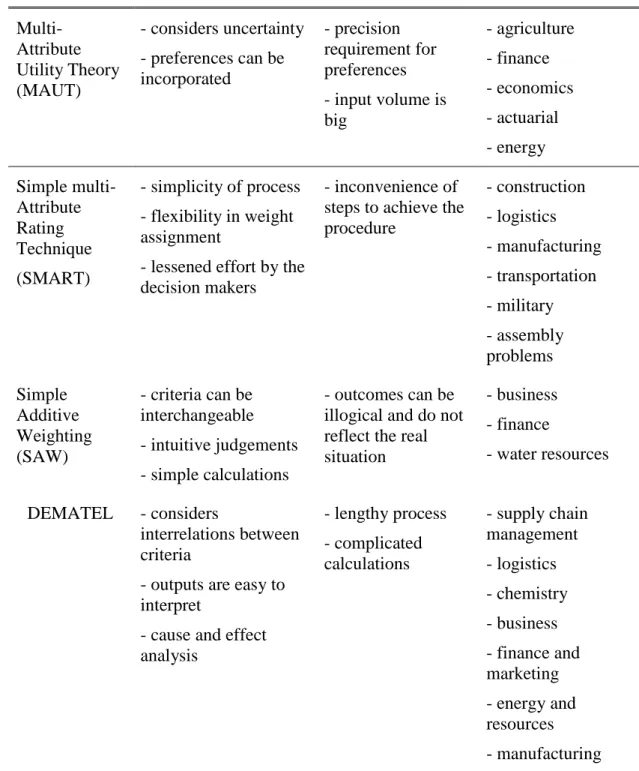
Table 2.1: (More) A comparison between several MCDM methods (Velasquez & Hester, 2013) Multi-Attribute Utility Theory (MAUT) - considers uncertainty - preferences can be incorporated - precision requirement for preferences - input volume is big - agriculture - finance - economics - actuarial - energy Simple multi-Attribute Rating Technique (SMART) - simplicity of process - flexibility in weight assignment
- lessened effort by the decision makers
- inconvenience of steps to achieve the procedure - construction - logistics - manufacturing - transportation - military - assembly problems Simple Additive Weighting (SAW) - criteria can be interchangeable - intuitive judgements - simple calculations - outcomes can be illogical and do not reflect the real situation - business - finance - water resources DEMATEL - considers interrelations between criteria
- outputs are easy to interpret
- cause and effect analysis - lengthy process - complicated calculations - supply chain management - logistics - chemistry - business - finance and marketing - energy and resources - manufacturing It is evident that a single MCDM technique can be used in several domains; however, the main criteria in selecting one MCDM technique for a specific application depends on the desired outputs that the researcher seeks. Some MCDM techniques, such as ANP, can have lengthy computational process with little contribution to the accuracy of the results. Nonetheless, researchers can prefer lengthy process MCDMs in order to achieve a specific objective from the
machine-learning approach. In comparing the results of the same problems by using different MCDM methods, a study have shown that correlational coefficients between outcomes were all positive and ranged between mo derate to strong relationship, which increase the reliability of the results that can be provided by most of the MCDM methods (Zamani-Sabzi, et al., 2016).
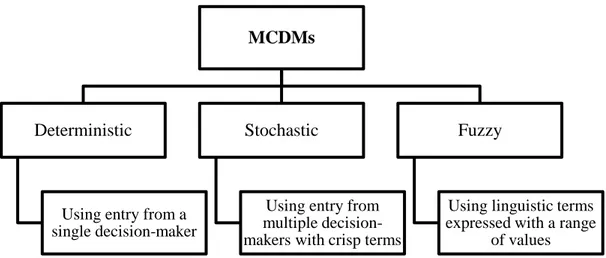
MCDMs are classified according to the type of data they use, as shown in Figure 2.3. Deterministic MCDMs use a single decision-maker to input the data, while stochastic MCDMs use multiple decision-makers. Deterministic and stochastic are called so because a single person would provide a firm one -time judgement and input from multiple persons would require approximating their answers. Furthemore, fuzzy MCDMs are the one that use linguistic terms to express judgements. Therefore, each decision-maker expresses the judgement within a range, rather than a single solid judgement. Accuracy of MCDMs is one of the most important subjects, which determines the confidence in taking its results seriously. For this purpose, sensitivity analysis is recommended after the study to understand the way changing a few judgements would impact the end results (Triantaphyllou, et al., 1998).
Figure 2.3: Classification of MCDM Techniques Based On Their Data Usage
Source: (Triantaphyllou, et al., 1998)
Since their inception in the 1960s, MCDMs have been built and developed to enhance their outputs and increase their efficiency. Thus, discrete and continuous MCDMs have been used depending on the application and the certainty of the input data. In surveying 393 MCDM studies over fourteen years (2000 to 2014), Mardani, et al. (2015) showed that 109 studies (27.74%) that
MCDMs
Deterministic
Using entry from a single decision-maker
Stochastic
Using entry from multiple decision-makers with crisp terms
Fuzzy
Using linguistic terms expressed with a range
used MCDM techniques were in the field of operation research and soft computing, followed by energy, environment and sustainability (13.49%) and manufacturing systems (8.14%). The use of MCDMs in research has increased almost 400% over the same period of time, while AHP was the most used single MCDM, followed by TOPSIS and ELECTRE, respectively. MCDMs can also be used in hybrid models, where more than one MCDM technique is used for a single application, which formed 11.70% of the research (Mardani, et al., 2015).
2.3 TOPSIS Technique and its Applications
The TOPSIS technique is performed through calculating hypothetic al ideal and worst solutions based on the maximum and the minimum weights yielded from judgements with the criteria. The Euclidean distance is calculated from both solutions and the most ideal alternative is the one that achieves the shortest distance from the positive solution and the furthest distance from the negative solution. The main advantage of the TOPSIS technique is its ability to contain any number of criteria for judgement and its ability to provide an intuitive solution based on distances from ideal solutions. Nonetheless, the disadvantages of the method is the possibility of giving unreliable results and dependency on deterministic judgements in its standard form, which does not take into consideration uncertainty (Gavade, 2014).
Hwang and Yoon (1981) established the first form of TOPSIS technique, which was mainly used as a hypothetical alternative ranking method. The basic steps of TOPSIS are presented by the authors, as follows:
Step 1: Construction of normalized decision matrix.
√ ∑ (5)
Where is the original score and is the normalized score from the decision matrix.
Step 2: Construction of the weighted decision matrix from the normalized matrix.
(6)
Step 3: Determination of positive ideal solution.
{ } (7)
Where { ( ) ( ) } Step 4: Determination of negative ideal solution.
{ } (8)
Where { ( ) ( ) }
Step 5: Calculation of separation measurement from positive ideal solution for every alternative.
√∑ (9)
Step 6: Calculation of separation measurement from negative ideal solution for every alternative.
√∑ (10)
Step 7: Calculation of relative closeness to ideal solution.
(11)
Where
Step 8: Selection of alternative that has its closest relative closeness to 1.
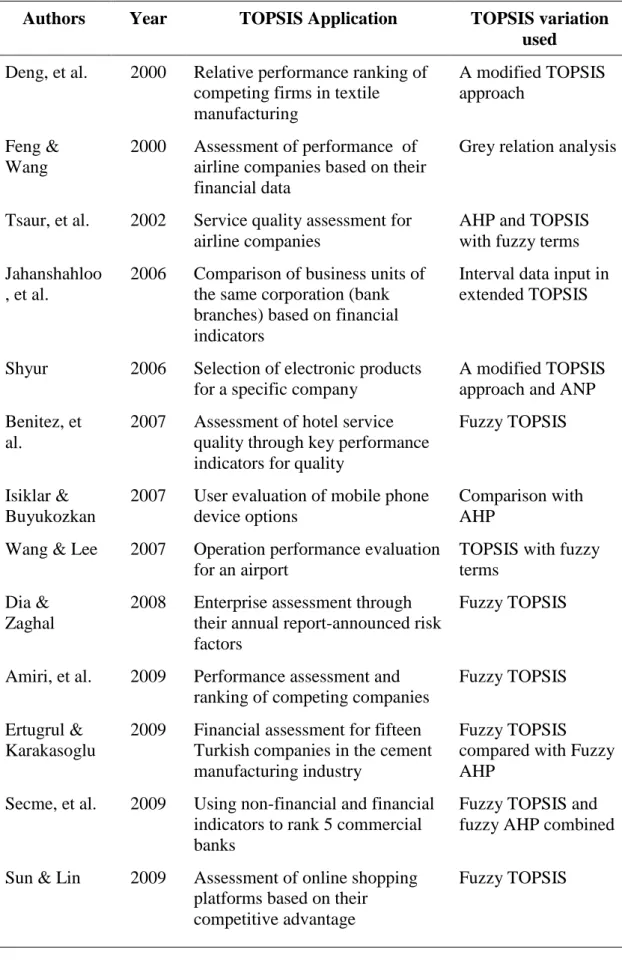
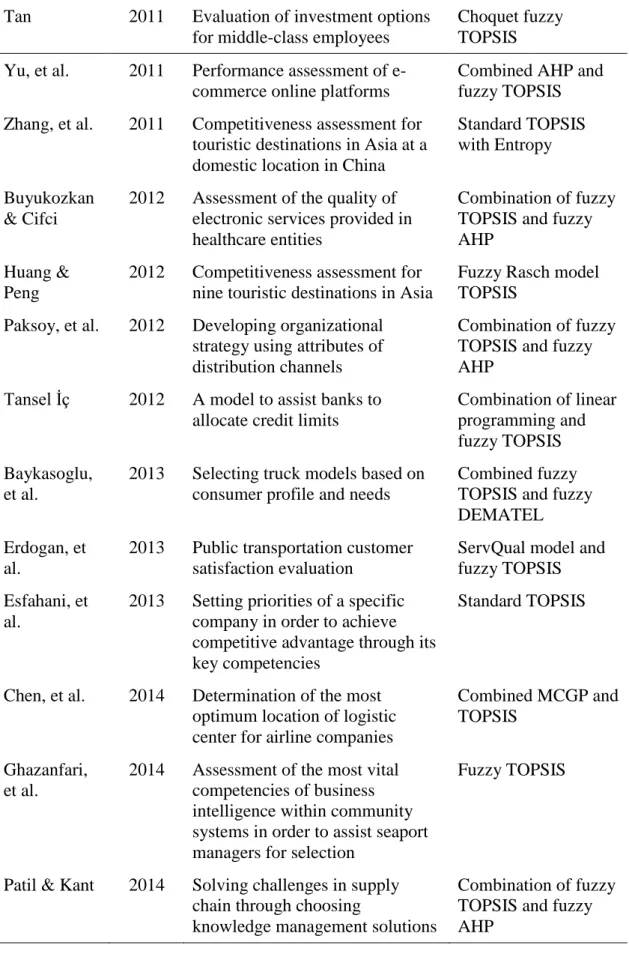
In business administration and management research, the TOPSIS technique have been used widely in the literature. The application of the method extended for many case studies, such as performance evaluations, corporation performance, financial assessments, comparison of business units, risk assessment, forecasting success and failure factors, investment options, determining business alliances, and evaluating business platforms. Table 2.2 shows a literature survey of the TOPSIS method utilization for business administration studies, along with variations, comparisons and combinations that were carried out in each study.
Table 2.2: A compiled literature survey of business administration and management studies that used the TOPSIS techniques
Authors Year TOPSIS Application TOPSIS variation
used Deng, et al. 2000 Relative performance ranking of
competing firms in textile manufacturing A modified TOPSIS approach Feng & Wang 2000 Assessment of performance of airline companies based on their financial data
Grey relation analysis
Tsaur, et al. 2002 Service quality assessment for airline companies
AHP and TOPSIS with fuzzy terms Jahanshahloo
, et al.
2006 Comparison of business units of the same corporation (bank branches) based on financial indicators
Interval data input in extended TOPSIS
Shyur 2006 Selection of electronic products for a specific company
A modified TOPSIS approach and ANP Benitez, et
al.
2007 Assessment of hotel service quality through key performance indicators for quality
Fuzzy TOPSIS
Isiklar & Buyukozkan
2007 User evaluation of mobile phone device options
Comparison with AHP
Wang & Lee 2007 Operation performance evaluation for an airport
TOPSIS with fuzzy terms
Dia & Zaghal
2008 Enterprise assessment through their annual report-announced risk factors
Fuzzy TOPSIS
Amiri, et al. 2009 Performance assessment and ranking of competing companies
Fuzzy TOPSIS Ertugrul &
Karakasoglu
2009 Financial assessment for fifteen Turkish companies in the cement manufacturing industry
Fuzzy TOPSIS compared with Fuzzy AHP
Secme, et al. 2009 Using non-financial and financial indicators to rank 5 commercial banks
Fuzzy TOPSIS and fuzzy AHP combined Sun & Lin 2009 Assessment of online shopping
platforms based on their competitive advantage
Table 2.2: (More) A compiled literature survey of business administration and management studies that used the TOPSIS techniques
Wu, et al. 2009 Soling the finance alliance challenge through preferences of bancassurance alliance
Compared with AHP
Chang, et al. 2010 Assessment of mutual funds in Taiwan over a three-year period
Extended TOPSIS with different distancing approach Garcia, et al. 2010 Performance assessment for
several firms
Fuzzy compared with goal programming
Khademi-Zare, et al.
2010 Evaluation of cellular companies in Iran based on strategic action
Fuzzy TOPSIS compared with AHP Li 2010 Using criteria of growth, risk and
environmental impact, TOPSIS used to select investment companies
Fuzzy TOPSIS with interval evaluation
Lin, et al. 2010 Customer application for the selection of the most suitable vehicle
TOPSIS combined with ANP and DEMATEL Sun 2010 Assessment of computer
manufacturing companies based on their performance
Combined fuzzy TOPSIS and fuzzy AHP
Vahdani, et al.
2010 Evaluation of insurance firms based on property responsibility performance
Combined fuzzy TOPSIS, fuzzy ANP and fuzzy VIKOR Ye 2010 Selection of partners for
establishing a virtual company
Extended fuzzy TOPSIS
Aydogan 2011 Performance evaluation of Turkish airline companies based on key indicators
Combined rough TOPSIS and AHP KarimiAzari,
et al.
2011 A model for construction companies to perform risk assessment
Fuzzy TOPSIS
Li, et al. 2011 Business failure forecast using performance data
Standard TOPSIS Peng, et al. 2011 Choosing between different
algorithm systems that compute financial risk
Combined with VIKOR and PROMETHEE
Table 2.2: (More) A compiled literature survey of business administration and management studies that used the TOPSIS techniques
Tan 2011 Evaluation of investment options for middle-class employees
Choquet fuzzy TOPSIS Yu, et al. 2011 Performance assessment of
e-commerce online platforms
Combined AHP and fuzzy TOPSIS Zhang, et al. 2011 Competitiveness assessment for
touristic destinations in Asia at a domestic location in China
Standard TOPSIS with Entropy Buyukozkan
& Cifci
2012 Assessment of the quality of electronic services provided in healthcare entities
Combination of fuzzy TOPSIS and fuzzy AHP
Huang & Peng
2012 Competitiveness assessment for nine touristic destinations in Asia
Fuzzy Rasch model TOPSIS
Paksoy, et al. 2012 Developing organizational strategy using attributes of distribution channels
Combination of fuzzy TOPSIS and fuzzy AHP
Tansel İç 2012 A model to assist banks to allocate credit limits
Combination of linear programming and fuzzy TOPSIS Baykasoglu,
et al.
2013 Selecting truck models based on consumer profile and needs
Combined fuzzy TOPSIS and fuzzy DEMATEL Erdogan, et
al.
2013 Public transportation customer satisfaction evaluation
ServQual model and fuzzy TOPSIS Esfahani, et
al.
2013 Setting priorities of a specific company in order to achieve competitive advantage through its key competencies
Standard TOPSIS
Chen, et al. 2014 Determination of the most optimum location of logistic center for airline companies
Combined MCGP and TOPSIS
Ghazanfari, et al.
2014 Assessment of the most vital competencies of business intelligence within community systems in order to assist seaport managers for selection
Fuzzy TOPSIS
Patil & Kant 2014 Solving challenges in supply chain through choosing
knowledge management solutions
Combination of fuzzy TOPSIS and fuzzy AHP
Table 2.2: (More) A compiled literature survey of business administration and management studies that used the TOPSIS techniques
Wang & Wang
2014 Assessment of high-tech firms in China based on competitiveness
TOPSIS with improved process
Tavana, et al.
2015 Investment portfolio selection Integer programming and fuzzy TOPSIS Trstenjak,
et al.
2015 Assessment of economic development strategies for Croatia through prioritizing key performance indicators
Fuzzy TOPSIS combined with a SWOT analysis and K-means methods
Shafii, et al. 2016 Human resource performance analysis in healthcare entities in Iran performed for hospital managers
Combination of fuzzy TOPSIS and fuzzy AHP
Zyoud, et al.
2016 Assessing resource loss prevention strategies for developing countries
Combination of fuzzy TOPSIS and fuzzy AHP
Anyaeche, et al.
2017 Banking services selection based on project portfolio
Combination of fuzzy TOPSIS and COPRAS Dooki, et
al.
2017 Selection of banking inspectors based on qualifications and costs
Combined fuzzy TOPSIS and fuzzy AHP
Radenovic &
Veselinovic
2017 Evaluation of the efficiency of health management systems
Combined AHP and TOPSIS
Han & Trimi
2018 Assessment of the performance of reverse logistics management strategies of social media platforms
Fuzzy TOPSIS
Rahim, et al.
2018 Selection of best employee as part of human resource control and management
Standard TOPSIS
Rashidi & Cullinane
2019 Sourcing management
alternatives for the sustainability of supplier selection
Comparison between fuzzy TOPSIS and fuzzy DEA
Tang, et al. 2019 Knowledge management evaluation with specific
emphasis on blockchain access for the public
TOPSIS and entropy
Yilmaz 2019 Assessment of real estate investment firms based on their financial performance
2.4 Libyan Economy and Economic Performance Studies
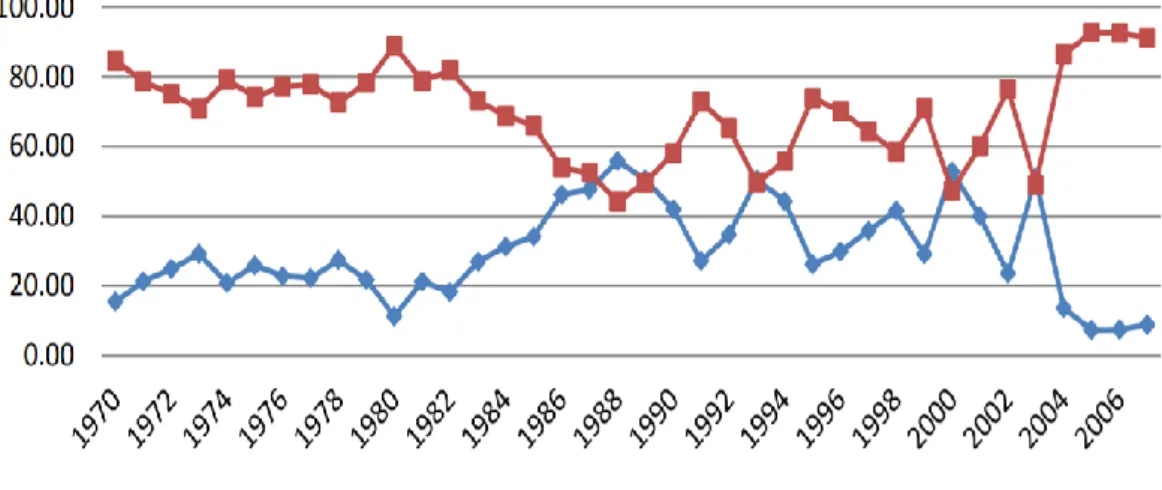
The reliance of Libyan economy on oil production and income is evident since early studies and as shown in the comparison between oil and non -oil revenues contribution to public budget in Figure 2.4, which is based on data from the central bank of Libya (Ali, 2011). evident Despite being amongst the richest countries with oil reserves, the government failed in establishing an encouraging investment and development environment for decades. Investment in agriculture is limited to specific regions, while manufacturing had its limitation due to the lack of knowledge, technology and development interests (heitmann, 1969). Nonetheless, the wave of globalization and the rapid advancements in technologies have simulated an apparent development in the country. The effects of these factors can be observed on the quality of manufactured goods and provided services. The impact of globalization and technology remained limited due to the lack of national development plans, systems and processes (Triki, 2017).
Figure 2.4: Contribution of Oil and Non-Oil Production in Libyan Public Budget
Source: (Ali, 2011)
Bhattarai and Taloba (2017) investigated the oil-dependent economy of Libya through an application of the Mankiw, Romer and Weil (MRW) model. The research commenced by reviewing the key macroeconomic performance indicators. The per Capita GDP graph for data from 1965 to 2015, as shown in Figure 2.5 (GDP in Libyan Dinars), shows steep declination between the years of 1981 and 1988, followed by a mild decrease pattern until the late 1990s.
Libya had a challenging period due to the American and International sanctions that were imposed on it. The GDP started to improve in the early 2000s with continuous fluctuations due to the high dependency on oil as the main product of the country and political instability.
Figure 2.5: Per Capita GDP in Libyan Dinars
Source: (Bhattarai & Taloba, 2017)
The human capital increased at the same declination period and the ratio between human capital and labor force (H/L) increased due to the decrease in labor force. With the start of development in the early 2000s, th e H/L ratio declined gradually, indicating more utilization of the human capital into the different development schemes that were set by the government, as shown in Figure 2.6. The fluctuation in human capital versus labor force is attributed to the problems that were faced in allocation within the economy. The findings of the study show that capital in the oil sector in Libya is the main driver for economic growth, while labor has less importance in influencing development (Bhattarai & Taloba, 2017). Moreover, the dependency relationship between the Libyan GDP and oil exportations is evident through data (Etelawi, et al., 2017), which hindered economic growth and development in the country’s modern history (Yahia & Metwally, 2007), as presented in Figure 2.7.
Figure 2.6: Log Graph Presenting Human Capital per Labor Force (H/L) In Libya
Source: (Bhattarai & Taloba, 2017)
Figure 2.7: The Interrelation between Oil Exportation and GDP in Libya
Source: (Yahia & Metwally, 2007)
The influence of oil exports based on their fluctuating prices does not only affect the income of Libya, but also the different economic sectors that are operating in the country. While the increase in oil prices did not have any positive effects on the manufacturing and agriculture sectors, the decrease in oil income slowed down their development, which requires a strong development policy that reduce the oil-dependency of the Libyan economy (Aimer, 2016). In spite of the economic reforms that were proposed and implemented prior the rising in 2012 and the noticeable changes on macroeconomic performance indicators, the presence of a real development plan remains vague under the
current instability in Libya. The reforms that led to that growth are (Alafi & de Bruijn, 2010):
Distribution of wealth on the people, which simulated the establishment of new businesses.
Establishment of a national joint-stock corporation, following the left of the economic sanctions, that held the foreign currency wealth of the country and allowed the importation of modern equipment and technology.
The establishment of a privatization program, which attracted foreign investments and development of publicly owned companies.
A study on the Libyan economy from 1980 to 2011 showed different impact of several factors in pressuring inflation in the country. The factor that had the most influence on inflation is foreign currency exchange rate followed by the domestic price level. Money supply and real income had their effects by their results were less significant (Alkoum & Agil, 2013). However, a research on African economies, including Libya, showed that oil prices has significant impact on inflation. The increase in oil prices increased inflation to a certain point, while inflation rates began to reduce at higher prices showing an asymmetric profile (Bala & Chin, 2018), as shown in Figure 2.8. Furthermore, Bazina (2017) carried out a research in order to identify the influential determinants that affect exchange rates in Libya. The author identified three drivers that change the exchange rates of the Libyan Dinar:
Political events and challenges
The reduced oil prices internationally
Figure 2.8: Best-Fit Graph for Inflation Rate Changes With The Increase Of Oil Prices
Source: (Bala & Chin, 2018)
The study showed also the change in profiles that is interrelated between real GDP and effective exchange rate of the Libyan Dinar, as shown in Figure 2.9. The results of the research showed that there are three main factors that affected exchange rates in Libya; terms of trade, oil prices and consumer price index (Bazina, 2017).
Figure 2.9: The similarity in change profile between the Libyan real GDP and effective exchange rate index
While research emphasized the importance of adopting information, communication and technological advances in order to drive economic development and growth in the MENA region and specifically Libya (Lusta & Aimer, 2017; Sassi & Goaied, 2013), other macroeconomic factors had substabtial effect on the Libyan economy, such as Foreign Direct Investment (FDI). Hamoudi and Aimer (2017) showed that FDI had significant impact on Libyan GDP, especially during its growth between the years of 2006 to 2008. The regression analysis showed an adjusted R square value of 0.549, indicating the positive relationship and its extent. Nevertheless, human capital did not show any significant effect on GDP and was not affected by the increase of foreign investments. The behavior of the three variables is illustrated in Figure 2.10. Moreover, a questionnaire taken by foreign investors and coreporations in Libya showed the high level of satisfaction from the oil, mining and non -mining resources of the country; however, a high level of dissatisfaction was expressed towards human resources, legal environment, administrative procedures and basic infrastructure, which could indicate the main issues that are suffered by Libya in attracting FDIs (Abushhewa & Zarook, 2016).
Figure 2.10: Behavior of GDP, FDI and human capital (HC) in Libya between 2000 and 2015
3. METHODOLOGY AND APPLICATION
3.1 Methodology Design and Data for Libyan Economy
As shown in the literature review performed in the last chapter and presented through several studies in Table 2.2, the TOPSIS method has been used widely in order to determine the closest alternative to the ideal solution. Like other MCDM methods, TOPSIS requires a set of criteria for judgement another set of alternatives as possible final solutions. In economic performance research, understanding the behavior of the key indicators that influence the performance of an economy could provide an understanding of the possible measures and priorities in developing economic strategies for the country. Therefore, it is possible to acquire data of these indicators over several years and treat them as criteria, while the years that are corresponding to data can be used as the alternatives. Specifying the closest year to the ideal solution provides the most desired combination of the indicators that could achieve the best economic performance. Moreover, studying the behavior of the indicators separately and collectively allows researchers and specialists to diagnose the economic issues that requires immediate intervention and provides a cause and effect analysis for the economic indicators.
Turan, et al. (2016) presented an application of the TOPSIS methodology on data for the Russian economy twenty-three years from 1992 to 2014. The authors started by presenting the available data in numeric and graphical forms in order to show the independent changes over the specified period. Thereafter, the TOPSIS method was applied in order to determine the best and worst economic years in order in comparison with the calculated ideal solution. Nine key performance indicators were used as criteria for each year, including inflation rate, interest rate, GDP in different forms, exportation volume, employment rate and unemployment rate. The TOPSIS method allowed the authors to arrange the years from best to worst based on equal and unequal weights, which were used for comparison. The results showed the year 1995 as
the best and the year 1992 as the worst based on equal weights, while unequal weights showed 1995 and 2009 as the best and worst years, respectively. Furthermore, ideal solutions in the equal and unequal weight assignment were plotted for a clearer comparison between the different years.
Nine criteria are considered for the case study of the Libyan economy, which are export volume, import volume, foreign direct investment (FDI), labor force, inflation (GDP deflator), net secondary income, unemployment, US dollars exchange rate, and oil production. The criteria are studied over a nine -year period from 2009 to 2017. Figure 3.1 shows the exportation and importation volumes of Libya in million US dollars. The highest export volume was in 2012, while the lowest was in 2016. In import volumes, the highest and the lowest values were in 2013 and 2017, respectively. The export volumes were higher than import volumes from 2009 to 2013; however, this trend changed with imports exceeding exports from 2014 to 2017. A sudden in export and import volumes is observed in 2011 due to severe political and security instabilities.
Figure 3.1: Comparison between Export and Import Volumes of Libya from 2009 to 2017
A similar trend is observed with foreign direct investment, with a sudden drop in 2011 and a negative value in 2014, as shown in Figure 3.2. The highest values for FDI were in 2010, followed by 2012. Nonetheless, FDIs relatively dropped from 2013 onwards to less than 1 million US dollars.
M 10M 20M 30M 40M 50M 60M 70M 2008 2009 2010 2011 2012 2013 2014 2015 2016 2017 2018 Year
Figure 3.2: Foreign Direct Invest in Libya from 2009 to 2017
As shown in Figure 3.3, the total labor force in Libya was stable over the specified period from 2009 to 2017 at around 2.35 million, while the unemployment rate is very high at 45%. Unemployment dropped to 38.4% in 2011, which can be mainly driven by the slight drop in labor force population.
Figure 3.3: Labor force and unemployment in Libya from 2009 to 2017 2,72M 0,13M 2,51M 0,11M -0,50M 0,00M 0,50M 1,00M 1,50M 2,00M 2,50M 3,00M 2008 2009 2010 2011 2012 2013 2014 2015 2016 2017 2018 2,40 M 0,89 M 0,00 M 0,50 M 1,00 M 1,50 M 2,00 M 2,50 M 3,00 M 2008 2009 2010 2011 2012 2013 2014 2015 2016 2017 2018
3.2 TOPSIS Application and Discussion
As mentioned earlier the period considered in the research to study the Libyan economy is the years between 2009 and 2017, with nine criteria presented in Table 3.1. Weights are assigned to each criterion to give oil production and exchange rate the highest weights with 0.25, while the remaining weight is distributed on other criteria equally.
Table 3.1: Economic Indicators Used For the Evaluation
Notation Criterion/ Economic indicator Weight
(wij)
C1 Exports of goods and services (volume in USD) 0.071429
C2 Imports of goods and services (volume in USD) 0.071429
C3 Foreign direct investment (FDI), net outflows (BoP, USD) 0.071429
C4 Labor force, total 0.071429
C5 Inflation, GDP deflator (annual %) 0.071429
C6 Net secondary income (BoP, USD) 0.071429
C7 Unemployment, youth total (% of total labor force ages
15-24) (modeled ILO estimate)
0.071429
C8 Exchange rate of US dollars 0.25
C9 Oil production (thousand barrels per day) 0.25
Table 3.2 presents the data that are used in the assessment of the Libyan economy using the TOPSIS method according to the selected economic indicators from 2009 to 2017.
Table 3.2: Libyan Economy Data Used For TOPSIS Application (Decision Matrix) C1 C2 C3 C4 C5 C6 C7 C8 C9 2009 37.335.46 0.710 26.990.027.9 22 1.165.000.0 00 2.334.7 99 -25,3 1 -1.572.000.0 00 44,1 1 1,25 3 1.556, 46 2010 49.055.09 9.463 31.477.739.1 85 2.722.000.0 00 2.375.3 76 14,1 6 -1.828.000.0 00 45,3 3 1,26 7 1.564, 91
Table 3.2: (More) Libyan Economy Data Used For TOPSIS Application (Decision Matrix) 2011 19.025.48 6.032 15.542.395.0 33 131.000.00 0 2.328.7 81 18,2 5 -377.000.000 38,4 0 1,22 0 368,36 2012 61.096.14 0.128 32.541.808.6 71 2.508.800.0 00 2.372.5 30 8,98 -2.824.200.0 00 45,1 2 1,25 1 1.424, 09 2013 46.136.11 7.009 42.464.181.8 04 707.700.00 0 2.346.0 67 -6,67 -3.252.200.0 00 44,8 5 1,25 8 930,75 2014 19.342.97 3.908 37.803.285.1 30 -77.600.000 2.325.9 88 -17,3 1 -1.120.900.0 00 44,6 1 1,64 0 464,00 2015 11.127.57 0.229 20.680.929.6 26 394.900.00 0 2.332.6 98 -19,4 0 -839.800.000 44,5 7 2,75 0 403,75 2016 6.853.934. 202 11.557.411.2 73 439.500.00 0 2.363.3 36 -2,56 -755.800.000 45,7 1 5,00 5 438,58 2017 14.457.19 6.478 13.212.068.7 17 110.000.00 0 2.403.1 25 14,4 2 -1.571.237.5 00 45,9 4 8,87 8 896,08
In order to construct the normalized decision matrix according to equation (5), presented below, the square roots of the matrix values are calculated and the square root of the sum of the column xij values are calculated, as shown in Table
3.3. Finally, the first step of the TOPSIS analysis is completed by producing the normalized decision matrix in Table 3.4.
√ ∑ (5)
Table 3.3: Calculation of the Square Roots of the Column Square Values
Year C1 C2 C3 C4 C5 C6 C7 C8 C9
2009 1,39394E+21 7,28E+20 1,36E+18 5,45E+12 640,7376 2,47E+18 1945,427 1,569854 2422552 2010 2,4064E+21 9,91E+20 7,41E+18 5,64E+12 200,5358 3,34E+18 2054,99 1,605781 2448940 2011 3,61969E+20 2,42E+20 1,72E+16 5,42E+12 333,0887 1,42E+17 1474,867 1,488449 135691,7 2012 3,73274E+21 1,06E+21 6,29E+18 5,63E+12 80,65244 7,98E+18 2035,724 1,564751 2028035 2013 2,12854E+21 1,8E+21 5,01E+17 5,5E+12 44,46118 1,06E+19 2011,881 1,583362 866295,6 2014 3,74151E+20 1,43E+21 6,02E+15 5,41E+12 299,6025 1,26E+18 1990,052 2,6896 215296 2015 1,23823E+20 4,28E+20 1,56E+17 5,44E+12 376,3023 7,05E+17 1986,842 7,5625 163014,1 2016 4,69764E+19 1,34E+20 1,93E+17 5,59E+12 6,541131 5,71E+17 2089,13 25,05003 192355,3 2017 2,09011E+20 1,75E+20 1,21E+16 5,78E+12 207,9266 2,47E+18 2110,943 78,81001 802965,3 √ ∑