International Journal of
Intelligent Systems and
Applications in Engineering
Advanced Technology and ScienceISSN:2147-67992147-6799www.atscience.org/IJISAE Original Research Paper
This journal is © Advanced Technology & Science IJISAE, 2017, 5(3), 154-157 |154 IJISAE, 2013, 1(4), 60–67 | 154
MLP and KNN Algorithm Model Applications for Determining the
Operating Frequency of A-Shaped Patch Antennas
Ahmet Kayabasi
*1Accepted : 05/07/2017 Published: 30/09/2017 DOI: 10.1039/b000000x 1
Abstract:In this study, two machine learning methods, namely multilayer perceptron (MLP) and K-nearest neighbours (KNN) algorithm models are used for determining the operating frequency of A-shaped patch antennas (APAs) at UHF band applications. Firstly, data set is obtained from the 144 antenna simulations using the method of moment (MoM) technique with the aid of the HyperLynx® 3D EM electromagnetic simulator.Weka (Waikato Environment for Knowledge Analysis) program was then used to build models by considering 144 simulation data. The models input with the parameters of 124 APAs are trained and their accuracies are tested via 20 APAs. The mean absolute error (MAE) values are calculated for different number of hidden layer neurons and different neighborhood values in MLP and KNN models, respectively. The performance of the MLP and KNN models are compared in the training and testing process. The lowest MAEs are obtained with 6 hidden layer neurons for MLP and 2 neighborhood values for KNN. These results point out that this models can be successfully applied to computation operating frequencies of APAs.
Keywords:A-shaped patch antenna, operating frequency, multilayer perceptron, K-nearest neighbours algorithm.
1. Introduction
Patch antennas (PAs) have become important for antenna designer because of it is attractive and popular due to their natural advantages such as small size, low weight, low cost of production, mechanically strong and compatibility with integrated circuits [1].Present portable communication and handheld devices are moving towards the miniaturization very rapidly and they inherently need miniaturized PAs [2].Miniaturization of antennas has a great role in the design and manufacture of electromagnetic systems. Present-day mobile communication systems usually require smaller antennas in order to meet the miniaturization requirements of mobile units. Therefore, size reduction and compatibility with integrated circuits has become the more importance in antenna design for miniature and compact wireless communication systems. Higher dielectric constant substrate materials can be used to design smaller antennas, but this reduces efficiency and bandwidth performance [1-2]. Many techniques have been proposed to effectively reduce the size of PAs. Slot loading technique are widely used to form small and comfortable PAs suitable for modern wireless technologies, since it yields a miniaturization in size of antenna and tuning the operating frequency and band [1-2].The A-shaped patch antennas (APAs) are miniaturized antenna constructed to physically reduce the antenna size by loading a slots in the rectangular patch.
Note that the analysis of such as APAs needs great effort because of having irregular shapes. To explore PAs many techniques have been suggested by researchers. There exist several analytic techniques for regular shapes like cavity model [3] and transmission line model [4] inspired from waveguide and transmission line theory. Nevertheless the analysis of slot
antennas may be facilitated by using computer-based software incorporated with computational electromagnetic (CEM) [5]. The CEMs generally employ complicated numerical method such as finite difference time domain (FDTD) method [6] and method of moment (MoM) [7]. CEMs numerically solve the rigorous Maxwell equations in integral or differential forms by discretizing the simulated model. On the other hand, the ownership cost of the CEM-based simulation tools are very expensive and one requires deep background knowledge to model and simulate an antenna. Therefore, finding alternative ways for simply analyzing the antennas, especially determining the operating frequency is promising research.Determining the operating frequency is precisely important because of small bandwidth of PAs. Owing to significant advantages of PAs, their analysis requires the use of simple methods. Antenna designers prefer easy approaches that does not require much knowledge and time.
Due to the rapid development of computer technology in recent years, robust and alternative methods were taken over for the antenna analysis. Alternative methods depend on computer technologies using artificial intelligent such as multilayer perceptron (MLP) and K-nearest neighbours (KNN) algorithm can be utilized for analysis and design the PAs.Over a last decade MLP [8-10] and KNN algorithm [11] which is fast and accurate models are remarkable importance in field of wireless communication.In MLP and KNN models, we can use measured, simulated, and calculated data for training and testing.
In this study, MLP and KNN models have been applied to determine the operating frequencies of APAs. The operating frequency values of 144 APAs corresponding most of UHF band applications are determined by the MoM technique with the aid of the HyperLynx® 3D EM electromagnetic simulator [12]. Weka (Waikato Environment for Knowledge Analysis) [13-14] program is then used to build models by considering 144 simulation data. The simulation data of 124 APAs representing
_______________________________________________________________________________________________________________________________________________________________
1Engineering Faculty, Department of Electrical-Electronics Engineering,
Karamanoglu Mehmetbey University 70100, Karaman, Turkey *Email: [email protected]
This journal is © Advanced Technology & Science IJISAE, 2017, 5(3), 154-157 |155 IJISAE, 2013, 1(4), 60–67 | 155
the overall problem space are used to training and the remaining 20 are then employed to test the accuracy. The number of hidden layer neurons in MLP and neighborhood values in KNN are changed for obtain appropriate models. The most proper models have been obtained with 6 hidden layer neurons for MLP and 2 neighborhood values for KNN. Additionally, the results obtained from this models are compared with each other in the training and testing process.
2. A-Shaped Patch Antenna and Simulation
Process
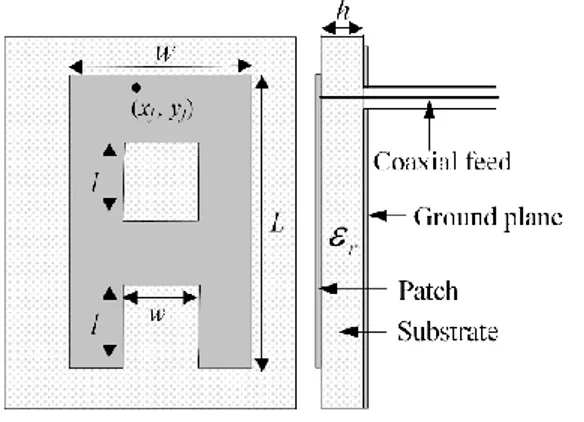
The geometry of the APA are given in (Figure.1) and the APA which is L x W dimension consists two identical slots in size of l x
w on a dielectric substrate with h height.Slot loading is increase
the resonant length and thus antenna size can be miniaturized.
Figure 1.Geometry of APA
As illustrated in (Figure.2), in order to obtain the operating frequencies, simulations by the agency of the packaged software called the HyperLynx® 3D EM have been performed for 144 APAs having different patch dimensions and various substrate dielectric constant values tabulated in Table 1. fsim is the operating
frequencies simulated by the HyperLynx® 3D EM.
Figure 2.Simulation process by HyperLynx® 3D EM
Table 1. Dimensions and dielectric constants of simulated APAs Sim. # Antenna dimensions (mm)
L W l w h εr
3 x 48
30 25 3, 6, 9, 12 3, 6, 9, 12 1.57 2.33, 4.5, 6.15 40 30 4, 8, 12, 16 4, 8, 12, 16 2.5 2.33, 4.5, 6.15 50 35 5, 10, 15, 20 5, 10, 15, 20 3.17 2.33, 4.5, 6.15
In the simulation process, antenna was feed with 50 ohm probe and cell/wavelength and maximum frequency were taken as 40 and 4 GHz, respectively. Optimization module based on genetic
algorithm was used to best return loss value in the HyperLynx® 3D EM electromagnetic simulator.
3. Modelling of The MLP and KNN Algorithm for
the Determination the Operating Frequency of
APAs
The MLP is one of the most widely applied artificial neural network (ANN) model. MLP networks are normally applied to performing supervised learning tasks, which involve iterative training methods to adjust the connection weights within the network. This is commonly formulated as a multivariate non-linear optimization problem over a very high-dimensional space of possible weight configurations [15-16]. An MLP is a network of simple processing units arranged into a hierarchical model of layers.
KNN is the simplest controlled learning algorithm among the whole machine learning algorithms [17]. It doesn’t use the training data points to do any generalization so it is also called a lazy algorithm. In order to apply KNN algorithm, feature vectors in a multidimensional feature space have to be created. Thus, the desired test object can be defined according to distance to the nearest neighbour feature. A commonly used distance metric for variables is Euclidean distance [18] and the number of the neighbor objects is defined by k coefficient. In the chosen k-nearest neighborhood, the query object is appointed to class of the most uncategorized data. The appropriate k coefficient was determined by trial and Euclidean calculation method [18]:
(1)
xi and xj are two different points, and need distance calculation
process in between.
In the study, WEKA software was used in order to determine the operating frequency of APAs. WEKA was developed at the University of Waikato, New Zealand and java program was used for software.WEKA software can be utilized for feature selection, clustering, classification and regression etc. [14].
The topology of the training process and computation of the mean absolute error (MAE) are illustrated for MLP and KNN models in (Figure.3). The simulated data of 124 APA representing the overall problem space is used to train the MLP and KNN models and the remainders 20 are utilized to test the accuracy. After several trials, neuron numbers in a hidden layer for MLP and neighborhood value for KNN are tried to determine. In the MLP model, learning rate, momentum parameter and epoch number are used 0.3, 0.2 and 500, respectively.For the MLP model, the performance of the model was observed by changing the neuron numbers from 1 to 15 at these network parameters. It has been shown that the best result is obtained with a hidden layer with 6 neurons for MLP model.Experiments for different neighborhood values were also made for the KNN model.For the KNN model, the neighborhood values were changed from 1 to 10 and the best result was obtained at 2 neighborhood values.
MAE values were obtained as 0.025 by the MLP and as 0.067 by the KNN model for the 124 APAs’ training data. The best performance was achieved by MLP, however, it should be noted that KNN model also was obtained remarkable results in the training process.
2
2
(
)
(
)
,
1
p
d x x
x
x
i j
is
js
s
This journal is © Advanced Technology & Science IJISAE, 2017, 5(3), 154-157 |156 IJISAE, 2013, 1(4), 60–67 | 156 Figure 3. The topology of the calculating MPE for MLP and KNN
models
4. Results and Discussion
The accuracy the MLP and KNN models is tested through 20 APA data that is not utilized in training the model. The electrical and psychical parameters of 20 used antenna are given in Table 2 for testing. The number of hidden layer neurons in MLP and neighborhood values in KNN were changed for obtain appropriate models. Calculated MAE values are given in Table 3 for different number of hidden layer neurons and neighborhood values. The lowest MAE values have been obtained with 6 hidden layer neurons for MLP and 2 neighborhood values for KNN.
Table 2. Electrical and psychical parameters of 20 simulated APAs for test process
APA Patch dimensions (mm) εr
L W l w h 1 30 25 3 6 1.57 2.33 2 30 25 3 12 1.57 2.33 3 30 25 6 9 1.57 2.33 4 30 25 9 6 1.57 2.33 5 30 25 9 12 1.57 4.5 6 30 25 12 12 1.57 4.5 7 30 25 9 6 1.57 6.15 8 30 25 12 3 1.57 6.15 9 40 30 4 12 2.5 2.33 10 40 30 16 12 2.5 2.33 11 40 30 4 16 2.5 4.5 12 40 30 16 4 2.5 4.5 13 40 30 8 16 2.5 6.15 14 40 30 16 8 2.5 6.15 15 50 35 5 10 3.17 2.33 16 50 35 15 20 3.17 2.33 17 50 35 5 15 3.17 4.5 18 50 35 20 15 3.17 4.5 19 50 35 10 5 3.17 6.15 20 50 35 20 15 3.17 6.15 The operating frequency values together calculated MAEs are given in Table 4. The proposed models successfully computes the operating frequencies with the MAEs of 0.038 and 0.072, respectively. The computed operating frequencies for 20 APAs well matches with the results of simulation.
The MLP is the model that gives the best result according to the results obtained during the training and testing process. However, it should be noted that KNN model also was obtained remarkable results. From these results it can be understood that MLP and KNN models can be used successfully in determining the operating frequencies of the APAs. The proposed models for determining the operating frequencies of the APAs compute
quickly and accurately without using complex mathematical expressions and long simulation processes. Once the appropriate model has been determined with the correct network parameters within the training process, the operating frequencies can be easily computed in microseconds. In this way, the antenna designers can reach the result quickly and easily. The main advantage of this model for nonlinear engineering problems can deliver high accuracy and faster results.
Table 3. MAE values for different number of neurons and neighborhood values MODELS MLP KNN Number of neurons MAE k neighborhood values MAE 1 0.137 1 0.136 2 0.123 2 0.072 3 0.104 3 0.074 4 0.043 4 0.076 5 0.043 5 0.098 6 0.038 6 0.122 7 0.042 7 0.109 8 0.043 8 0.115 9 0.048 9 0.144 10 0.039 10 0.143 11 0.046 ─ ─ 12 0.040 ─ ─ 13 0.049 ─ ─ 14 0.041 ─ ─ 15 0.041 ─ ─
Table 4. The operating frequencies and MAE values for testing process
APA Operating frequencies
Absolute errors (AE) fsim. MLP KNN EMLP EKNN 1 3.182 3.158 3.142 0.024 0.040 2 2.955 3.047 3.007 0.093 0.053 3 3.070 3.015 2.964 0.055 0.106 4 2.744 2.831 2.755 0.087 0.011 5 2.004 1.975 2.088 0.029 0.084 6 1.609 1.540 1.806 0.069 0.197 7 1.751 1.808 1.752 0.057 0.001 8 1.557 1.493 1.646 0.064 0.089 9 2.345 2.315 2.320 0.030 0.025 10 1.809 1.819 2.014 0.010 0.205 11 1.641 1.642 1.673 0.001 0.032 12 1.457 1.413 1.552 0.044 0.095 13 1.412 1.433 1.426 0.021 0.014 14 1.180 1.203 1.280 0.023 0.100 15 1.907 1.874 1.904 0.033 0.003 16 1.769 1.806 1.647 0.037 0.122 17 1.367 1.367 1.339 0.000 0.028 18 1.114 1.147 1.241 0.033 0.127 19 1.200 1.219 1.201 0.019 0.001 20 0.958 0.997 1.068 0.039 0.110 MAE 0.038 0.072
This journal is © Advanced Technology & Science IJISAE, 2017, 5(3), 154-157 |157 IJISAE, 2013, 1(4), 60–67 | 157
5. Conclusions
In this paper, an applications of MLP and KNN models successfully performed for the determination of fast and accurate operating frequency of APAs. HyperLynx® 3D EM electromagnetic simulator software based on MoM was used to define operating frequency of 144 APAs. The electrical and physically parameters of 124 APAs are utilized for training the MLP and KNN models, remainder 20 APAs were also utilized for the test. The obtained results with proposed models are in good harmony with the HyperLynx® 3D EM results.Among the MLP and KNN models, the best performance is obtained by MLP model for training and testing process. MAE regarding the determined operating frequencies for training of the MLP and KNN were obtained as 0.025 and 0.067, respectively. The proposed models were then tested and MAE values as 0.038 for MLP and 0.072 for KNN were achieved. It is seen from the results that the MLP and KNN model approaches are fast and easy modelling which produces more accurate results for the operating frequency of the APAs without using complex mathematical expressions and long simulation processes.
References
[1] K. Wong (2002). Compact and broadband microstrip antennas. John Wiley & Sons, Inc.
[2] G. Kumar and K. P. Ray (2003). Broadband microstrip antennas, Norwood: Artech House.
[3] W. F. Richards, Y. T. Lo and D. D. Harrisson (1981). An improved theory for microstrip antennas and applications. IEEE T. Antenna Propagation. 29 38─46.
[4] K. Bhattacharyya and R. Garg (1985). A generalized transmission line model for microstrip patches. IEE PROC-H.13293─98.
[5] D. B. Davidson (2005). Computational electromagnetics for RF and microwave engineering, Cambridge University Press, Cambridge, United Kingdom.
[6] A. Taflove (1995). Computational electrodynamics: The finite-difference time domain method, Artech House, Boston.
[7] R. F. Harrington (1993). Field computation by moment methods. Piscataway, NJ, IEEE Press.
[8] J. Singh, G. Singh, S. Kaur and B.S. Sohi (2015). Performance analysis of different neural network models for parameters estimation of coaxial fed 2.4 GHz E-shaped Microstrip patch antenna. In Recent Advances in Engineering & Computational Sciences (RAECS), 2nd International Conference on. IEEE. 1─5.
[9] N. Gunavathi and D. Sriramkumar (2015). Analysis and synthesis of coplanar waveguide-feed using Multilayer Perceptron Feed Forward Neural Networks. Signal Processing, Communication and Networking (ICSCN), 3rd International Conference on. IEEE.
[10] A. Ashrf, M. Simsek and Z. Aydin (2015). Development of knowledge based response correction for a reconfigurable N-shaped microstrip antenna design. Numerical Electromagnetic and Multiphysics Modeling and Optimization (NEMO), 2015 IEEE MTT-S International Conference on. IEEE.
[11] J. Jingon (2016). Machine Learning-Based Antenna Selection in Wireless Communications. IEEE Communications Letters. 20 (11) 2241─2244.
[12] HyperLynx® 3D EM, Version 15, Mentor Graphics Corporation, 8005 SW Boeckman Road, Wilsonville, OR
97070.
[13] M. Hall, E. Frank, G. Holmes, B. Pfahringer, P. Reutemann and I. H. Witten (2009). The WEKA Data Mining Software: An Update. SIGKDD Explorations. 11 (1) 10─18.
[14] R. Arora (2012). Comparative analysis of classification algorithms on different datasets using WEKA. International Journal of Computer Applications. 54 (13).
[15] V. Mai, I. Khalil and C. Meli (2011). ECG biometric using multilayer perceptron and radial basis function neural networks. Engineering in Medicine and Biology Society, EMBC, Annual International Conference of the IEEE. [16] M. Kantardzic (2003). Data Mining: Concepts, Models,
Methods, and Algorithms. John Wiley & Sons Publishing. [17] J. Wang, P. Neskovic and L. N. Cooper (2007). Improving
nearest neighbor rule with a simple adaptive distance measure. Pattern Recognition Letters. 28 (2) 207─213. [18] Y. Zhou, Y. Li and S. Xia (2009). An improved KNN text
classification algorithm based on clustering. Journal of computers. 4 (3) 230─237.