Selçuk J. Appl. Math. Selçuk Journal of Vol. 10. No. 1. pp. 141-146, 2009 Applied Mathematics
Konno-Yamazaki Portfolio Optimization Model and an Application to Istanbul Stock Exchange
Asır Genç, Nuri Çelik
Department of Statistics, The University of Selcuk, Konya, Turkey e-mail: agenc@ selcuk.edu.tr,ncelik@ selcuk.edu.tr
Received: May 11, 2009
Abstract. The portfolio selection problem deals with how to form a satisfying portfolio. It is difficult to decide which assets should be selected because of the uncertainty on their returns. On the other hand, the increased volatility of financial markets during the last decade has induced researchers, practitioners and regulators to design and develop more sophisticated risk management tools. Value at Risk (VaR) has become the standard measure that financial analysts use to quantify market risk. VaR is defined as the maximum potential loss in value of a portfolio due to adverse market movements, for a given probability. In this work we considered Konno-Yamazaki model to optimize our portfolio and we compare this optimal portfolio with other possible portfolios with respect to VaR values.
Key words: Portfolio optimization, Konno-Yamazaki model, Value at Risk. 2000 Mathematics Subject Classification: 90C05, 91B28, 62G32.
1.Introduction
The selection of assets or equities is not just a problem of finding attractive investments. Designing the correct portfolio of assets cannot be done by hu-man intuition alone and requires modern, powerful and reliable mathematical programs called optimizers. Any investor would like to have the highest re-turn possible from an investment. However, this has to be counterbalanced by the amount of risk the investor is able or desires to take. The expected re-turn and the risk measured by the variance (or the standard deviation, which is the square-root of the variance) are the two main characteristics of a portfolio. Unfortunately, equities with high returns usually correlate with high risk.
Economics in 1990. Later, modification of this portfolio optimization such as Konno-Yamazaki model is used for this purpose.
On the other hand, while choosing the optimal portfolio one must think about the risk aspect of the events. Measuring risk is the other problem which in-vestments must be faced with. Value at risk theory has been designed for this reason.
In financial mathematics and financial risk management, Value at Risk (VaR) is a widely used measure of the risk of loss on a specific portfolio of financial assets. For a given portfolio, probability and time horizon, VaR is defined as a threshold value such that the probability that the mark-to-market loss on the portfolio over the given time horizon exceeds this value (assuming normal markets and no trading in the portfolio) is the given probability level. There are three basic approaches that are used to compute Value at Risk, though there are numerous variations within each approach. The measure can be computed analytically by making assumptions about return distributions for market risks, and by using the variances in and covariances across these risks. Variance-Covariance method, historical simulation method and Monte Carlo Simulation method are widely used to meusure Value at risk.
2. Konno-Yamazaki Optimization Model
According to Konno and Yamazaki MAD portfolio optimization model’s advan-tages over the Markowitz’s model are: this model does not use the covariance matrix and so it does not need it to be calculated, solving this linear model is much easier than solving a quadratic model, the maximum number of assets that are invested in is 2 + 2 (if = ∞) where Markowitz’s model may con-tain as many as n assets and T can be used as a control variable to restrict the number over the assets. Konno and Yamazaki (1991) introduced risk function (mean absolute deviation-MAD) instead of the risk (variance) function where Rj is a random variable representing the rate of return per period of the asset j. They proved that these two measures are the same if (R1. . . Rn) are multivari-ate normally distributed. So the Konno-Yamazaki MAD portfolio optimization model becomes as follows; [4]
= X =1 subject to
(1) + P =1 ≥ 0 = 1 2 − P =1 ≥ 0 = 1 2 P =1 ≥ 0 P =1 = 0 0 ≤ ≤ = 1 2 ≥ 0
The aim of the model is minimizing risk of the portfolio, and the variables in this model is defined as,
(2) = − = 1 2 = 1 2
=number of period = period =expected income
=expected return of asset.
=real return of asset at period
=share of each assets.
0=total investment
=assistant variable
3. Value at Risk
The most prominent of these risks in trading is market risk, since it reflects the potential economic loss caused by the decrease in the market value of a portfolio. Value at Risk (VaR) has become the standard measure that financial analysts use to quantify this risk. It is defined as the maximum potential loss in value of a portfolio of financial instruments with a given probability over a certain horizon. In simpler words, it is a number that indicates how much a financial institution can lose with probability over a given time horizon. The great popularity that this instrument has achieved among financial practitioners is essentially due to its conceptual simplicity: VaR reduces the (market) risk associated with any portfolio to just one number, that is the loss associated with a given probability. VaR measures can have many applications, such as in risk management, to evaluate the performance of risk takers and for regulatory requirements. In particular, the Basel Committee on Banking Supervision (1996) at the Bank
not properly estimated, this may lead to a sub-optimal capital allocation with consequences on the profitability or the financial stability of the institutions. [1] While VaR is a very easy and intuitive concept, its measurement is a very chal-lenging statistical problem. Although the existing models for calculating VaR employ different methodologies, they all follow a common general structure, which can be summarised in three points: 1) Mark-to-market the portfolio, 2) Estimate the distribution of portfolio returns, 3) Compute the VaR of the port-folio. The main differences among VaR methods are related to point 2, that is the way they address the problem of how to estimate the possible changes in the value of the portfolio. [5] CAViaR models skip the estimation of the distribution issue, as they allow computing directly the quantile of the distribution. We will classify the existing models into three broad categories:
1. Parametric (RiskMetrics and GARCH)
2. Nonparametric (Historical Simulation and the Hybrid model)
3. Semiparametric (Extreme Value Theory, CAViaR and quasi-maximum likelihood GARCH)
4. Application
In application, Istanbul Stock Market real datas are used to get optimal portfo-lio with Konno-Yamazaki optimization model and to calculate VaR values of the optimal portfolio. To solve the linear program for portfolio optimization WIN-QSB programming are used. The solution of portfolio optimization is shown in Table 1. 13 different assets closing prices between 01.01.2006 and 01.01.2009 are used. Konno-Yamazaki portfolio optimization model is calculated as,
min = µ 1 361+ 1 362+ 1 363+ + 1 3636 ¶ subject to
1+2632ULKE + 6774VESTEL+2066TUKAS−1922MUTLU+ + 7810VKFBNK
2+732ULKER+3379VESTEL+7312TUKAS+3816MUTLU+ + 0443VKFBNK
.. .
36−1430ULKER−1186VESTEL−1092TUKAS−1106MUTLU+ − 2693VKFBNK
≥ 0 = 1 2 336
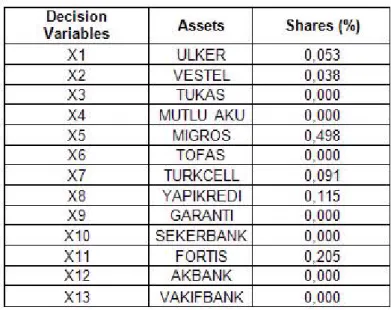
Table 1. Solution of the portfolio optimization model
Accordig to the table 1 the investors should invest their money to %0.53 Ulker, %0.38 Vestel, %49.8 Migros, %9 Turkcell, %11.5 YapKredi and %20.5 Fortis. Then, with optimal portfolio VaR value are calculated. VaR value of the optimal portfolio with a given probability %95 with ten day period is %0.089, on the other hand with a given probability %95 and one-month period VaR of the optimal portfolio is %0.13. VaR is calculated with variance and covariance method.
5.Conclusion
For most investors, the risk they take when they buy a stock is that the return will be lower than expected. In other words, it is the deviation from the aver-age return. Each stock has its own standard deviation from the mean, which Markowitz calls "risk".
The risk in a portfolio of diverse individual stocks will be less than the risk inherent in holding any single one of the individual stocks (provided the risks of the various stocks are not directly related). Consider a portfolio that holds two risky stocks: one that pays off when it rains and another that pays off when it doesn’t rain. A portfolio that contains both assets will always pay off, regardless of whether it rains or shines. Adding one risky asset to another can reduce the overall risk of an all-weather portfolio.
obtaining optimal portfolio we calculated VaR value of the optimal portfolio with a given weighted matrix and we concluded that Konno-Yamazaki portfolio optimization model gives the minimum risk value comparing with other possible weighted portfolios.
References
1. S. Benninga, and Z. Wiener (1998), “Value-at-Risk (VaR) “, Mathematica in Edu-cation and Research ,Vol 7 .
2. A.Genç, M. Bekta¸s, N. Çelik, (2008), Finansal Risk Analizine Giri¸s, Ders Notlar, Cilt Dizgi Ofset, Konya.
3. G.A. Holton, (2003), Value at Risk-Theory and Practice, Academic Press, Inc, London.
4. H. Konno, H. Yamazaki, (1991), Mean-AbsoluteDeviation Portfolio Optimization Model And Its Applications to Tokyo Stock Market, Management Science, Vol.37, No.5, 519-531.
5. S. Manganelli, and R.F. Engle, “Value at Risk Models in Finance”, European Central Bank Working Paper Series, 2001.