Contents lists available atScienceDirect
Talanta
journal homepage:www.elsevier.com/locate/talanta
On-site and low-cost detection of cyanide by simple colorimetric and
fluorogenic sensors: Smartphone and test strip applications
Serkan Erdemir
a,⁎, Sait Malkondu
baSelcuk University, Science Faculty, Department of Chemistry, Konya, 42031, Turkey
bGiresun University, Faculty of Engineering, Department of Environmental Engineering, Giresun, 28200, Turkey
A R T I C L E I N F O Keywords: Cyanide Dual sensing Fluorescent Colorimetric A B S T R A C T
Cyanide is potentially hazardous and quickly acting chemical used in many fields of industry. Therefore, de-tection of cyanide is of main health concern due to its serious impacts on living organisms. In this context, we have developed rapid, low-cost and on-site sensory two molecules for the colorimetric and fluorogenic sensing of cyanide ion in aqueous samples and food samples. The prepared probes undergo distinct visual color change and exhibits selective fluorogenic turn-on or turn-off response towards cyanide. Competing anions have little or negligible effect on the detection of cyanide. The limit of detection for cyanide ion was calculated as low as 0.45 μM. Free receptors could be successfully regenerated by treating them with Ag+ion. Moreover, a new visual colorimetric strip based on paper was fabricated with the pale yellow-to-pink color change signal. The fabricated test strips also demonstrated excellent selectivity towards cyanide ion without interfering possible fluoride and acetate ions. The smartphone-based technique which could directly read out the color value using a smartphone revealed an excellent potential for the cyanide detection without additional device.
1. Introduction
The sensing and recognition of environmentally and biologically important anions have attracted much attention due to their important roles [1–3]. Cyanide (CN−) is one such anion that has attracted the
interest of researchers in recent years. It is a chemical reagent produced in large quantities for many fields such as metal, dye, drug, leather, textile and mining industries [4]. Approximately half of the annually produced cyanide is used in gold and silver mining. However, its small dose is known to be very hazardous for humans [5,6]. Cyanide ion induces the accumulation of chemicals in the bloodstream by forming complexes in the cell mitochondrion and interfering with the capacity of a cell to produce energy [7,8]. A limit of cyanide ion in drinking water was determined to be 2 ppm (76 μM) by the U.S. Environmental Protection Agency (EPA) [7].
Possible sources of cyanide are pharmaceuticals, industrial acci-dents, tobacco and fire smoke and even some common foods [9]. The lethal effect of cyanide is determined to be 0.5–3.5 mg per body weight [10]. Subacute cyanide poisoning is caused by the long-term use of sodium nitropurusside as a drug as well as chronic poisonings by factors such as smoking habit. The worst of environmental disasters in Europe was Baia Mare cyanide spill in 2000. Drinking water supplies for almost 3 million people in Romania and neighboring Hungary and Serbia were
cut off, and hundreds of tons of fish were killed nearby rivers [11]. Plants like almonds, flax seed, bamboo shoots, and cassava are con-sidered toxic if they contain HCN at 200 ppm in the form of cyanogenic glycosides [12]. The cyanide ion passing through bloodstream inhibit the electron transport by connecting the ferri-iron of the cytochrome oxidase enzyme and block the molecular oxygen. Death occurs as a result of brain hypoxia [13]. Therefore, an efficient and reliable mon-itoring of a permitted residual concentration of cyanide is highly es-sential due to extreme toxicity of cyanide and environmental concerns. Various methods such as titrimetric, voltammetry, chromatography and electrochemistry have been developed for cyanide determination [14–21]. Unfortunately, most of these techniques require expensive and bulky equipment and are complicated for real-time analyses and time-consuming. Among the methods so far, colorimetric and fluorescent sensors have shown promising many superiorities including remote control, high sensitivity, easy detection, low cost, and especially con-venient biological diagnosis [8,22].
Recently, some fluorescent sensors based on Schiff base moieties including OH/NH groups as recognition site are widely used to detect anions undergoing deprotonation process or hydrogen bonding inter-action [23–25]. However, the design of suitable receptor for dis-crimination of cyanide ion from acetate and fluoride ions has been re-cognized as a remarkably challenging task since there is a strong
https://doi.org/10.1016/j.talanta.2019.120278
Received 7 May 2019; Received in revised form 12 August 2019; Accepted 16 August 2019 ⁎Corresponding author.
E-mail address:[email protected](S. Erdemir).
Available online 17 August 2019
0039-9140/ © 2019 Elsevier B.V. All rights reserved.
competition between them via strong hydrogen bonds [26,27]. There-fore, development of selective cyanide sensor is still required to meet the demands of colorimetric or fluorogenic detection.
Herein we report the design of two diaminomalonitrile-based re-ceptors for cyanide detection. Both rere-ceptors showed high selectivity and sensitivity towards cyanide ion in MeCN/H2O (v/v, 9/1). Phenolic
hydroxyl and diaminomalonitrile amino groups were the anion receptor via ICT. Deprotonation of hydroxyl and amino groups induced a dra-matic color change. Moreover, the present receptors C1 and C2 are simple-to-use, low-cost and provide results by a clear color change.
2. Experimental section
2.1. Materials
All chemicals were purchased from commercial suppliers and used without purification. NMR spectra were recorded on Varian 400 MR in DMSO‑d6and CDCl3as solvents. Absorption spectra were measured by
using a Shimadzu 1280 ultraviolet–visible spectrophotometer at room temperature. A PerkinElmer LS 55 instrument was used for fluorescence studies. The fluorescence spectra were recorded with the excitation wavelength of 365 nm by 5 nm slit.
2.2. Synthesis
The synthetic routes for C1 and C2 are shown inScheme 1. The compounds 1 and 2 were prepared according to the method reported in the previous work [28].
2.2.1. Synthesis of 3
A mixture of 5-bromosalicylaldehyde (1.0 g, 4.97 mmol), 9,10-phenanthrenequinone (1.03 g, 4.97 mmol) and ammonium acetate (7.65 g, 99,4 mmol) in glacial acetic acid (50 mL) was refluxed for 2 h. Then, the mixture was allowed to cool to room temperature and pre-cipitated by pouring into ice-water. The obtained precipitate was fil-tered, washed with acetic acid and water, and dried in air. Yield: 85%; mp: 253–255 °C;1H NMR (400 MHz, DMSO‑d
6): δ 13.80 (s, 1H, NH),
13.29 (s, 1H, OH), 8.91 (t, 2H, J = 9.68 Hz), 8.48–8.56 (m, 3H, ArH), 7.70–7.82 (m, 4H, ArH), 7.53 (d, 1H, J = 9.05 Hz), 7.08 (d, 1H,
J = 9.05 Hz); Anal. Calcd for C21H13BrN2O (388.02): C, 64.80; H, 3.37;
N, 7.20. Found: C, 64.92; H, 3.42; N, 7.28. 2.2.2. Synthesis of 4
Hexamethylenetetramine (HMTA, 1.08 g, 7.63 mmol) was added to a mixture of compound 3 (0.5 g, 1.28 mmol) in trifluoroacetic acid (TFA, 60 mL). Then the mixture was allowed to reflux for 24 h. It was poured into water (100 mL) after the completion of the reaction. The precipitated product was filtered and then washed with water. The raw product was purificated by recrystallization from ethanol. Yield: 72%; Mp: 240–241 °C;1H NMR (400 MHz, DMSO‑d
6): δ 13.88 (br s, 2H, NH
and OH), 10.36 (s, 1H, CHO), 8.83 (d, 2H, J = 7.31 Hz, ArH), 8.56 (s, 1H, ArH), 8.50 (d, 2H, J = 7.31 Hz, ArH), 7.69–7.78 (m, 5H, ArH); Anal. Calcd for C22H13BrN2O2 (416.02): C, 63.33; H, 3.14; N, 6.71.
Found: C, 63.38; H, 3.21; N, 6.80. 2.2.3. General synthesis of C1 and C2
Compound 2 (0.2 g, 0.60 mmol) or 4 (0.2 g, 0.48 mmol) was dis-solved in dry EtOH (10 mL) in a round bottomed flask. Then, a suitable amount of diaminomaleonitrile (1.0 equiv) was added to the above mixture. It was allowed to stir for 2 h at rt. The formed yellow pre-cipitate was filtered and washed with ethanol.
C1: yield 71%; mp:272–273 °C; FTIR: 1649 cm−1(C]N);1H NMR (400 MHz, DMSO‑d6): δ 12.88 (s, 1H, OH), 8.38 (s, 1H, CHN), 8.32 (d, 1H, J = 2.32 Hz), 8.12 (s, 2H, NH2), 8.08 (d, 1H, J = 7.93 Hz), 7.98 (d, 1H, J = 7.93 Hz), 7.91 (d, 1H, J = 2.32 Hz), 7.51 (t, 1H, J = 7.29 Hz), 7.43 (t, 1H, J = 7.29 Hz);13C NMR (100 MHz, DMSO‑d 6); δ 165.36, 156.18, 151.19, 149.87, 133.88, 133.69, 133.29, 127.94, 127.55, 126.57, 125.81, 122.83, 120.91, 114.74, 114.13, 112.25, 103.01; Anal. Calcd for C18H10BrN5OS (422.98): C, 50.96; H, 2.38; N, 16.51. Found:
C, 51.03; H, 2.41; N, 16.59.
C2: yield 73%; mp:260–262 °C; FTIR: 1618 cm−1(C]N);1H NMR
(400 MHz, DMSO‑d6): δ 14.14 (br s, 2H, NH and OH), 8.87 (d, 2H, J = 8.21 Hz), 8.68 (s, 1H, CHN), 8.45–8.50 (m, 4H, ArH), 8.11 (br s, 2H, NH2), 7.77 (t, 1H, J = 7.46 Hz), 7.68 (s, 1H, J = 7.46 Hz);13C NMR
(100 MHz, DMSO‑d6); δ 149.02, 147.91, 130.55, 130.49, 128.38,
127.81, 127.36, 126.33, 125.68, 124.43, 122.39, 116.37, 114.93, 114.28, 110.97, 103.72; Anal. Calcd for C26H15BrN6O (506.05): C,
61.55; H, 2.98; N, 16.56. Found: C, 61.58; H, 3.02; N, 16.65.
Scheme 1. The synthetic routes for C1 and C2: (I) 2-aminothiophenol, sulfamic acid, ethanol, rt, 2 h; (II) 9,10-phenanthrenequinone, ammonium acetate, acetic acid, reflux, 2 h; (III) HMTA, TFA; (IV) diaminomaleonitrile, ethanol, rt, 2 h.
2.2.4. UV–vis/fluorescence and1H NMR studies
Colorimetric and fluorometric measurements of C1 and C2 were performed in concentrations of 20.0 μM and 5.0 μM in MeCN/H2O (v/v,
9/1), respectively. Anion solutions (0.01 M) were prepared from cor-responding tetrabutylammonium salts in H2O. The fluorescence
mea-surements were realized at room temperature (λex= 365 nm, slit
5 nm). For the fluorescence and UV–vis titrations, the different amounts (0–5.0 equiv) of the anions were added to 3.0 mL of the solutions of C1 and C2 in MeCN/H2O (v/v, 9/1). In1H NMR experiments, the chemical
shifts resulting from the interaction of C1 and C2 with cyanide (CN−)
were monitored by addition of the known quantity of CN−ion to the
solutions of C1 (0.094 M) and C2 (0.079 M) in DMSO‑d6. 2.2.5. pH study
Buffer solution (20.0 mM) was prepared from dissolving HEPES in water, then using HCl. and NaOH solution to adjust pH 7. The receptors
C1 and C2 (in a mixture of MeCN/H2O, 9/1, v/v) and cyanide (in
water) were prepared in cuvette, then adjust pH value (3.0–14.0) with HCl and NaOH solutions.
3. Results and discussion
3.1. Fabrication of sensors C1 and C2
As depicted inScheme 1, 5-bromosalicyaldehyde as starting mate-rial was converted to benzothiazole (1) and phenanthroimidazole (3) derivatives via ring closure reaction through Schiff base, then they were converted to the aldehyde derivatives (2 and 4) by Duff reaction in TFA media. Finally, C1 and C2 were produced via a condensation reaction between 2 or 4 with diaminomaleonitrile. The characterization of C1 and C2 have been made by1H NMR,13C NMR, COSY, APT, FTIR and
elemental analysis (Supplementary materials, Figs. S1–S10). The ap-pearance of newly bands at 1649 and 1618 cm−1indicated the
for-mation of CH]N group in C1 and C2. The appearance of the signals belong to imine protons (HCN) at δ 8.38 ppm and 8.68 ppm in1H NMR
spectra also confirmed the formation of C1 and C2 respectively. 3.2. Colorimetric sensing of CN−by C1 and C2
The colorimetric behavior of C1 and C2 was investigated in com-pany with various anions (CN−, HSO
4−, I−, Br−, Cl−, F−, AcO−,
SO42−, H2PO4−, HPO4−, NO2−, NO3−, ClO4−) by naked-eye detection
and UV–visible spectroscopy in a mixture of MeCN/H2O (9/1, v/v). In
the absence of any anions, C1 and C2 solutions in MeCN/H2O were
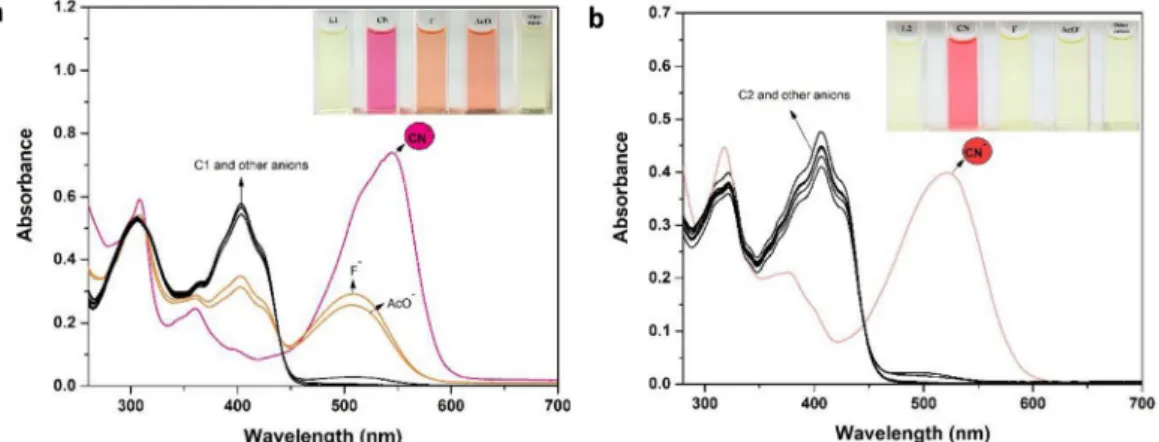
yellow and showed two bands at 310 and 405 nm for C1 and at 320 and 407 nm for C2 which were ascribed to n-π * and π -π⁎ transitions (Fig. 1a and b). Only CN−, AcO−and F−ions among the tested anions
(5.0 equiv) to a solution of C1 led to the progress of two bands at 548 and 510 nm, while other anions produced slight spectral responses, respectively. In the absorption spectra of C1, unusually large bath-ochromic shift (Δλmax) of 143 nm was monitored in the presence of
CN−. A fascinating color conversion of pale-yellow solution of C1 to the
dark pink solution of C1–CN was monitored with the ratiometric UV–visible response (Fig. 1a, inset). Besides, the addition of only CN−
ion (5.0 equiv.) among the tested anions to a solution of C2 led to significant spectral change whereas other anions have negligible effects on the absorption spectra of C2 (Fig. 1b). After the interaction of CN−
ion with C2, it was observed a new absorption band at 522 nm by a red shift (Δλmax) of 115 nm. Also, instant pale yellow color was converted
to somon pink (Fig. 1b, inset). The bathochromic shifts in the absorp-tion bands of C1 and C2 can be explained by intramolecular charge transfer (ICT) transition arising the formation deprotonated form via hydrogen bonded complex between C1 and C2 with CN−ion.
Elec-tronic properties of deprotonated forms are quite different from that of the C1 and C2, which induced a visible color change with a new intra-ligand or internal charge transfer (ICT) band. The sensing ability of C1 and C2 towards only CN−among the tested anions in aqueous media
can be also explained by anions’ basic strength and hydrogen bonding abilities. Compared with another anions AcO− (ΔH
hyd= −375 kj
mol−1) and F− (ΔH
hyd= −505 kj mol−1), the hydration energy of
CN−(ΔH
hyd= −67 kj mol−1) is less [29]. Also, the pKa value (9.21) of
HCN is greater than that of other anions, which shows that CN−is a
strong base in aqueous solution. Since F− and AcO− have high
hy-dration energies, their basicity decrease in water. On the contrary, CN−
acts a strong base due to its low hydration energy, which explains the selectivity of CN−in MeCN/H
2O (v/v, 9/1). Also, the competition
ex-periments indicated that other competitive ions had negligible effects on the CN−detection by C1 and C2 (Fig. S11). These results manifested
that C1 and C2 have good chromogenic selectivity toward CN−ion in
aqueous solution.
The UV–vis titrations of C1 and C2 (20.0 μM) were performed with addition of increasing amount of CN−in MeCN/H
2O (v/v, 9/1) (Fig. 2a
and b). Upon addition of CN−ion to the solution of C1 or C2, two red
shifted absorption bands centered at 548 and 522 nm were developed respectively. Meanwhile the original absorption bands at 405 and 407 nm gradually reduced. The clear isosbestic points were appeared at 447 for C1 and 445 nm for C2, indicating the presence of two distinct species, neutral molecules (C1 and C2) and their anion species at equilibrium. As seen inFig. 2c and d, the concentration of these species gradually increased and decreased by the increase in amount of CN−.
The stoichiometric ratios between C1 and C2 with CN− were
de-termined by UV–vis measurements by using Job's plot. The results in-dicated that C1 form a 1:1 complex with CN−(Fig. S12a), while C2
form a 1:2 complex with CN− (Fig. S12b). Based on these
Fig. 1. Absorbance spectra of C1 (a) (20.0 μM) and C2 (b) (20.0 μM) in MeCN/H2O (v/v, 9/1) in the presence of various anions (inset; the corresponding color changes of C1 and C2)
stoichiometric ratios, the binding constants (logK) of C1 and C2 for CN−was calculated from the Bind Fit v0.5 modules [30], and
calcu-lated to be 4.30 and 8.39. In addition, the detection limit values of C1 and C2 on the basis of DL = 3s/k are 0.92 and 0.68 μM for CN−(Fig. S13), which are admirably lower than the suggested maximum value (1.9 μM CN−) by World Health Organization (WHO), respectively. 3.3. Reversibility and practical applications of C1 and C2
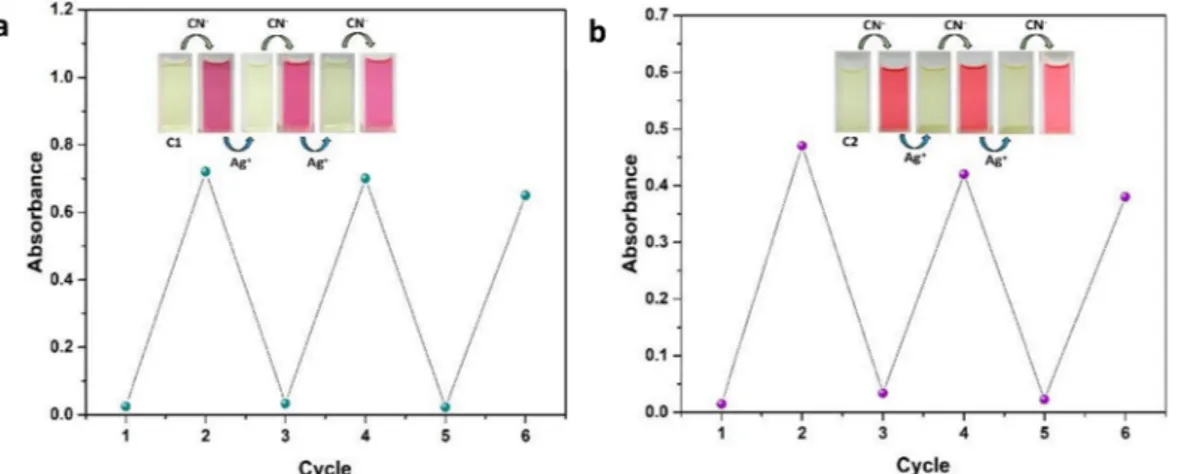
To reveal the reversibility of the receptors, Ag+ion with a strong
affinity for CN−was used as the reagent [31]. When a solution of Ag+
(1.0 equiv. for C1 and 2.0 equiv. for C2) was introduced into the so-lution containing C1 or C2 and CN−, the dark pink color of C1 and
somon pink color of C2 was disappeared due to the decomposition of
C1–CN and C2–CN complexes. Upon repetitive addition of cyanide, the
expected absorption bands at 548 nm for C1 and 522 nm for C2 were increased, showing the reversible interaction of C1 and C2 with cyanide ions (Fig. 3). The repetition of reversibility process could be success-fully employed at several times without large sensitivity loss (Fig. 3, insets).
The practical applications of C1 and C2 were performed on the test papers. For this, a solution of C1 or C2 in MeCN/H2O (v/v, 9/1) was
dripped on a test paper, then dried in air. The test paper coated with C1 or C2 was interacted by different anion solutions in H2O for 2s. As seen
inFig. 4, the yellow color of receptor solutions was converted to dark pink for C1 and somon pink color for C2 only in company with CN−in
aqueous media, respectively, while other tested anions, especially F−
and AcO−could not change color, which showed that C1 and C2 can be
utilized to roughly detect CN−. Moreover, for the cost-effective and
on-site monitoring of CN−, the dark pink and somon pink RGB (red, green,
blue) values of C1 and C2 with interaction of CN−were readout by a
smartphone (model: Apple iPhone 6s Plus). We used to a mobile app
(color assist) to observe the changes in RGB values of the vials involving
C1 or C2 solutions with interaction of increasing amount of CN−. As
depicted inFig. 5, the R/G (red/green) ratios for C1 and C2 solutions were plotted against the CN−concentration. The obtained curves for
C1 and C2 showed good linearity ranges (R2= 0.9867 and 0.9916)
with the detection limits down to 4.12 and 3.25 μM, respectively. These smartphone and test paper applications provided a low cost and on-site approach for qualitative and quantitative detection of CN−. We also
examined applicability of present receptors to our lives. For this pur-pose, the apricot seeds as food sample (30 g) were selected. The crushed seed was suspended in a solution of NaOH (0.5%). The obtained sus-pension was filtered after vigorously stirring for 15 min. Then, pH of suspension was adjusted to 9.0. After the addition of the seed extracts to each receptor solution, pale yellow color of both receptor solutions was remarkably transformed to dark pink or somon pink which can be easily detected by the naked eye. The new absorption bands were enhanced at about 546 and 520 nm by red shifts, respectively (Fig. S14). These re-sults showed that detection of CN−in seed samples could be
success-fully performed using the present receptors.
Selectivity performance of C1 and C2 towards CN−was also
com-pared with some reported colorimetric and fluorescent sensors for CN−
through deprotonation mechanism [29,32–37]. As seen inTable 1, C1 and C2 have many standout advantages in terms of sensing method (colorimetric and fluorometric turn on/off), detection limit and prac-tical applications.
3.4. Fluorometric sensing of CN−by C1 and C2
The fluorogenic recognition abilities of the newly prepared re-ceptors were examined towards a series of anion (CN−, AcO−, I−, Br−,
Cl−, F−, HSO
4−, SO42−, ClO4−, H2PO4−, HPO4−, NO2−, NO3−) in
MeCN/H2O (9/1, v/v). Emission spectra of C1 was characterized by
Fig. 2. UV–vis spectrum of C1 (a) and C2 (b) during the titration with CN−ion, and plot of absorbance at 405 and 548 nm for C1 (c) and at 407 and 522 nm for C2 (d) vs the concentration of CN−added.
weak emission intensity centered at 597 nm for (Fig. 6a) while a strong emission intensity at 477 nm with a shoulder at 565 nm for C2 (Fig. 6b). The addition of cyanide induced the increase in the emission intensity of C1, remarkably. On the contrary, emission of C2 was quenched with the interaction of cyanide. Other anions have a negligible effect on emissions of both C1 and C2. Only, fluoride and acetate ions showed very little interference on emission spectra, but they could not provide a distinct visual response through the naked eye under the UV lamp. It was assumed that deprotonation of phenol and amino groups in both receptors by cyanide increased the electron density. The emerging ne-gative charge on the amino nitrogen and phenolate oxygen might be responsible for a restriction of the intramolecular charge transfer (ICT) transition of the push-pull effect [38,39]. Therefore, the existing changes in emission intensity are mainly due to the restriction of ICT transition from benzothiazole or phenanthroimidazole group as donor to diaminomaleonitrile group as acceptor. The diaminomaleonitrile group, one of the cyanide detecting groups, functions as an ICT me-chanism for cyanide probes [40,41]. Deprotonation of both OH and NH groups in receptors led to corresponding negatively charged forms and thus strongly modulation of ICT. The selectivity of the present receptors towards cyanide ion is ascribed to weak hydration enthalpy and strong basicity of cyanide [42,43].
In order to further characterize the cyanide recognition behavior of the receptors C1 and C2, a emission titration study was carried out in
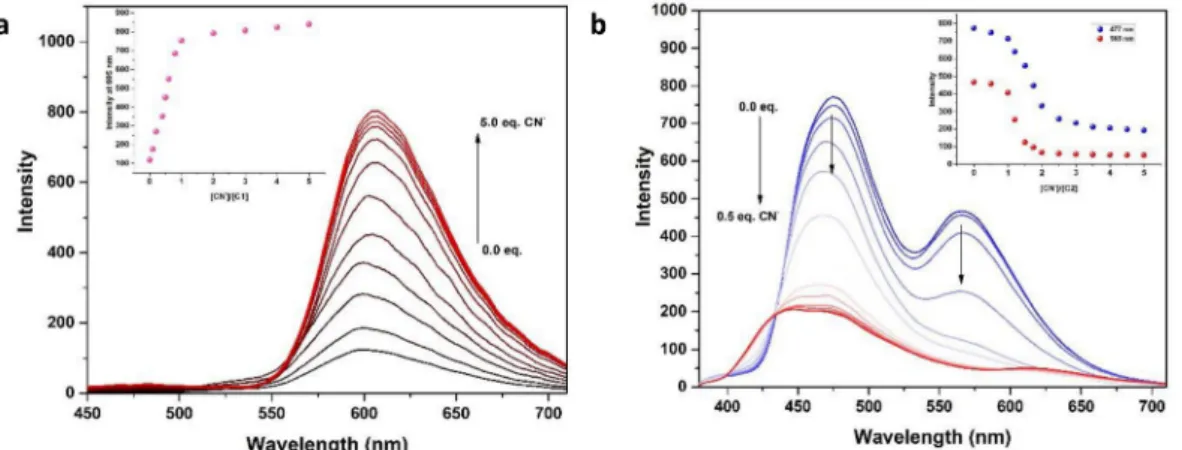
MeCN/H2O (v/v, 9/1). Upon excitation at 365 nm, C1 displayed a weak
emission band centered at 597 nm (Fig. 7a). Gradual addition up to 5.0 equiv. of cyanide resulted in the about 7-fold fluorescence enhancement factor for C1 with a small red shift to 605 nm. Emission intensity has reached a maximum up to 1.0 equiv. of cyanide. Further cyanide ad-dition could not cause a significant enhancement in emission intensity. Therefore, the titration profile clearly showed a stoichiometric ratio of 1:1 between C1 and cyanide. The obtained turn on response was ac-companied by a distinct color enhancement from dark to magenta which is clearly distinguishable. The limit of detection (LOD) for C1–CN is calculated as 0.45 μM from the emission titration data. Fluorescence response of C2 towards cyanide was turn-off mode. Free receptor C2 showed a strong emission intensity at 477 nm with the presence of a shoulder at 565 nm for C2 (Fig. 7b). Titration of a solution of C2 with cyanide resulted in quenching of the emission of C2. Upon gradual addition of cyanide (up to 5.0 equiv.) resulted in the about 4-fold de-crease in the emission intensity of C2 with the blue shift to 450 nm. The minimum emission intensity of C2 was obtained with the addition of 2.0 equiv. of cyanide was sufficient to reach. More cyanide addition could not decrease the emission intensity further. It was concluded from titration data that stoichiometric ratio for the interaction of C2:cyanide is 1:2. The isosbestic point was explicitly identified at 433 nm, showing the formation of a single species between C2 and cyanide. An apparent bright beige color was converted to dark blue during the cyanide Fig. 3. UV–vis spectra of C1 (a) and C2 (b) in the presence of CN−and Ag+ions.
detection, which could be easily observed by the naked eye under UV lamp. The LOD value for C2–CN is calculated as 0.52 μM from the emission titration data.
In order to reveal the efficiency of cyanide over the other bases, effect of pH on fluorescence intensity of C1 and C2 in the absence and in the presence of cyanide was tested in the range of pH 3.0–14.0 (Fig. S15). The results demonstrated that both receptor C1 and C2 had ability to detect cyanide ion in the range of pH 7.0–9.0 without interfering with hydroxide. At pH ≥ 10.0, hydroxide started to interfere with cy-anide ion. At the pH levels lower than 6.0, the receptor C2 undergo hydrolysis followed by quench of emission intensity. Therefore, it was inferred from that the present receptors showed the efficient potential
for cyanide in the pH range of 7–9 which is optimum for biological applications.
3.5. Theoretical and1H NMR studies
In order to shed light on the nature of the sensing mechanism be-tween C1 and C2 with CN−, we have carried out density functional
theory (DFT) and time-dependent DFT (TDDFT) analysis using the Gaussian 16 software with the B3LYP/6–31G method basis set [44]. Initially, the optimized structures of C1, C2, and their CN−complexes
were obtained by B3LYP-6-31G. Then, to find the possible transitions, TDDFT analysis was carried out by using the optimized structures. In Fig. 5. Smartphone-assisted RGB responses for the determination of CN−by C1 (a) and C2 (b).
Table 1
Comparison of some colorimetric and fluorometric sensors for CN−detection through deprotonation mechanism.
Compound Sensing method LOD (μM) Solvent system Test Strips Food Sample Smartphone
App. Ref.
Colorimetric 6.40 DMSO/Tris (6/4) yes no no 32
FL “turn off” 0.95 DMSO/H2O (4/1) yes yes no 33
Colorimetric –
FL “turn off” – DMSO/H2O (1/1) yes no no 29
Colorimetric 21.0
FL “turn off” 0.60 CH3CN/H2O (8/2) no no no 34
FL “turn on” – DMSO/H2O (7/3) yes no no 35
Colorimetric –
FL “turn on” 0.45 CH3CN/H2O (9/1) yes yes yes This work
Colorimetric 0.92
FL “turn off” 0.52 CH3CN/H2O (9/1) yes yes yes This work
the case of C1, LUMO was localized on the diaminomaleonitrile and phenolic units, while HOMO was solely localized on benzothiazole moiety. However, after binding with CN−, the π electrons of HOMO of
C1–CN are merely distributed on the diaminomaleonitrile fragment,
whereas the LUMO is mainly distributed on the benzothiazole and phenolic units due to the extended π-conjugation (Fig. 8). On the other hand, HOMO of C2 was spread on the whole skeleton of molecule in-volving phenanthroimidazole, and LUMO was only distributed on the
diaminomaleonitrile and phenolic units. In C2–CN, HOMO was spread on the diaminomaleonitrile and phenolic moieties, while LUMO orbitals were primarily localized on the phenanthroimidazole and phenolic units (Fig. 8). Notable differences in the electron density distribution are originated from the enhanced donor-to-acceptor ICT transition in the receptors after the CN− induced deprotonation. The band gaps
between HOMO and LUMO of C1 and C2 were calculated as 2.87 and 2.94 eV, respectively (Fig. 8). Upon complexation with CN−, the energy
Fig. 6. Fluorescence spectra of C1 (a) and C2 (b) in the presence of different anions in MeCN/H2O (9:1, v/v): insets: visual fluorescence color changes of C1 (a) and
C2 (b) after addition of anions
Fig. 7. Fluorescence titration spectra of C1 (a) and C2 (b) upon incremental addition of CN−in MeCN/H
2O (9/1, v/v).
gaps between HOMO and LUMO of C1–CN (ΔE = 1.33 eV) and C2–CN (ΔE = 2.10 eV) were decreased. The red shifted ICT mechanism mon-itored in absorption studies of C1 and C2 on interaction with cyanide confirmed these narrowing down of energy gaps.
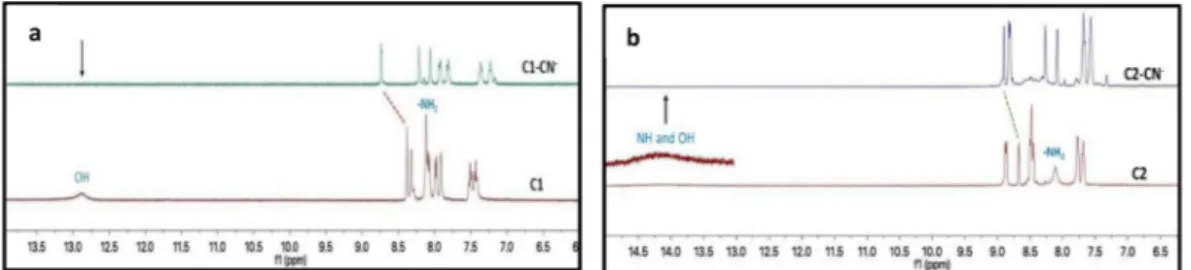
The sensing mechanism of the receptors was finally confirmed by1H
NMR experiments using tetrabutylammonium cyanide in DMSO‑d6. As
depicted inFig. 9, the phenolic OH proton signal of C1 and phenolic OH and NH proton signals of C2 appeared at δ 12.88 and δ 14.14 ppm (as broad singlet) in the absence of CN−, respectively. -NH
2proton signals
of C1 and C2 were also observed at δ 8.12 and δ 8.11 ppm, whereas the imine proton signals (CH]N) at δ 8.38 and δ 8.68 ppm. After the ad-dition of CN−, the phenolic OH, NH and NH
2signals on C1 and C2 were
completely disappeared owing to the deprotonation arising from hy-drogen bonding with CN−. In addition, the imine proton signals at δ
8.38 and δ 8.68 ppm was down-field shifted to 8.76 and 8.92 ppm. The signals of other aromatic protons in C1 and C2 observed with upfield shift, which triggered charge transfer (CT) followed through delocali-zation of the negative charge on the whole molecule.
4. Conclusion
In summary, we developed two novel colorimetric and fluorogenic sensors linked diaminomaleonitrile moiety for CN−detection in
aqu-eous acetonitrile. Colorimetrically, C1 and C2 presented distinct color changes for CN−sensing with low detection limits (0.92 and 0.68 μM),
respectively. Fluorogenically, the low fluorescence of C1 increased considerably on the interaction with cyanide, whereas the strong fluorescence of C2 quenched due to the push-pull ICT system. The re-cognition events of C1 and C2 towards CN−were satisfactorily revealed
through UV–vis, fluorescence,1H NMR and DFT/TDDFT calculations.
The C1–CN and C2–CN species could be also reversible transformed by addition of Ag+. In addition, the practical performance of C1 and C2
was observed on the test paper and food sample (apricot seeds), and they were successfully integrated with a smartphone, which allows a simple and effective way for on-site detection of CN−.
Acknowledgment
We thank the Research Foundation of Selcuk University for financial support of this work.
Appendix A. Supplementary data
Supplementary data to this article can be found online athttps:// doi.org/10.1016/j.talanta.2019.120278.
References
[1] M.M. Antonisse, D.N. Reinhoudt, Neutral anion receptors: design and application, Chem. Commun. (4) (1998) 443–448.
[2] T. Gunnlaugsson, M. Glynn, G.M. Tocci, P.E. Kruger, F.M. Pfeffer, Anion recognition and sensing in organic and aqueous media using luminescent and colorimetric sensors, Coord. Chem. Rev. 250 (23–24) (2006) 3094–3117.
[3] J.W. Steed, A modular approach to anion binding podands: adaptability in design and synthesis leads to adaptability in properties, Chem. Commun. (25) (2006) 2637–2649.
[4] N. Gimeno, X. Li, J.R. Durrant, R. Vilar, Cyanide sensing with organic dyes: studies in solution and on nanostructured Al2O3 surfaces, Chem.–Eur. J. 14 (10) (2008) 3006–3012.
[5] H. Nguyen, T. Tran, P. Wong, A kinetic study of the cementation of gold from cy-anide solutions onto copper, Hydrometallurgy 46 (1–2) (1997) 55–69. [6] M.A. Chaaban, Hazardous waste source reduction in materials and processing
technologies, J. Mater. Process. Technol. 119 (1–3) (2001) 336–343. [7] K. Kulig, B. Ballantyne, Cyanide Toxicity vol. 15, US Department of Health &
Human Services, Public Health Service, Agency for Toxic Substances and Disease Registry, Atlanta, 1991.
[8] Z. Xu, X. Chen, H.N. Kim, J. Yoon, Sensors for the optical detection of cyanide ion, Chem. Soc. Rev. 39 (1) (2010) 127–137.
[9] F. Baud, Cyanide: critical issues in diagnosis and treatment, Hum. Exp. Toxicol. 26 (3) (2007) 191–201.
[10] W.H. Organization, Guidelines for Drinking-Water Quality: Second Addendum vol. 1, Recommendations, World Health Organization, 2008.
[11] R. Koenig, Wildlife deaths are a grim wake-up call in Eastern Europe, Science 287 (5459) (2000) 1737–1738.
[12] F.R. Sidell, D.R. Franz, Overview: defense against the effects of chemical and bio-logical warfare agents, Med. Aspects Chem. Biol. warfare 41 (2) (1917) 1. [13] J. Hamel, A review of acute cyanide poisoning with a treatment update, Crit. Care
Nurse 31 (1) (2011) 72–82.
[14] P. Breuer, C. Sutcliffe, R. Meakin, Cyanide measurement by silver nitrate titration: comparison of rhodanine and potentiometric end-points, Hydrometallurgy 106 (3–4) (2011) 135–140.
[15] B. Lou, Z.-Q. Chen, Z.-Q. Bian, C.-H. Huang, Multisignaling detection of cyanide anions based on an iridium (III) complex: remarkable enhancement of sensitivity by coordination effect, New J. Chem. 34 (1) (2010) 132–136.
[16] K.K. Mak, H. Yanase, R. Renneberg, Cyanide fishing and cyanide detection in coral reef fish using chemical tests and biosensors, Biosens. Bioelectron. 20 (12) (2005) 2581–2593.
[17] G. Ding, T. Lin, R. Zhou, Y. Dong, J. Xu, X. Lu, Electrofluorochromic detection of cyanide anions using a nanoporous polymer electrode and the detection me-chanism, Chem.–Eur. J. 20 (41) (2014) 13226–13233.
[18] T. Suzuki, A. Hioki, M. Kurahashi, Development of a method for estimating an accurate equivalence point in nickel titration of cyanide ions, Anal. Chim. Acta 476 (1) (2003) 159–165.
[19] M.d.F.B. Sousa, O.E. Godinho, L.M. Aleixo, An indirect voltammetric approach for the determination of cyanide at a chemically modified electrode, Electroanalysis 7 (11) (1995) 1095–1097.
[20] L.D. Chen, X.U. Zou, P. Bühlmann, Cyanide-selective electrode based on Zn (II) tetraphenylporphyrin as ionophore, Anal. Chem. 84 (21) (2012) 9192–9198. [21] H.-I. Kang, H.-S. Shin, Derivatization method of free cyanide including cyanogen
chloride for the sensitive analysis of cyanide in chlorinated drinking water by liquid chromatography-tandem mass spectrometry, Anal. Chem. 87 (2) (2014) 975–981. [22] I. Yahaya, Z. Seferoglu, Fluorescence Dyes for Determination of Cyanide,
Photochemistry and Photophysics-Fundamentals to Applications, IntechOpen (2018).
[23] A.K. Mahapatra, S.K. Manna, P. Sahoo, Color response of tri-armed azo host col-orimetric sensors and test kit for fluoride, Talanta 85 (5) (2011) 2673–2680. [24] Y.M. Hijji, B. Barare, A.P. Kennedy, R. Butcher, Synthesis and photophysical
characterization of a Schiff base as anion sensor, Sens. Actuators B Chem. 136 (2) (2009) 297–302.
[25] Y. Zhou, J.Y. Jung, H.R. Jeon, Y. Kim, S.-J. Kim, J. Yoon, A novel supermolecular tetrameric vanadate-selective colorimetric and “Off–On” sensor with pyrene ligand, Org. Lett. 13 (10) (2011) 2742–2745.
[26] P. Anzenbacher, D.S. Tyson, K. Jursíková, F.N. Castellano, Luminescence lifetime-based sensor for cyanide and related anions, J. Am. Chem. Soc. 124 (22) (2002) 6232–6233.
[27] Y. Ding, T. Li, W. Zhu, Y. Xie, Highly selective colorimetric sensing of cyanide based on formation of dipyrrin adducts, Org. Biomol. Chem. 10 (21) (2012) 4201–4207. [28] S. Erdemir, B. Tabakci, M. Tabakci, A highly selective fluorescent sensor based on calix [4] arene appended benzothiazole units for Cu2+, S2− and HSO4− ions in aqueous solution, Sens. Actuators B Chem. 228 (2016) 109–116.
[29] P.M. Reddy, S.-R. Hsieh, C.-J. Chang, J.-Y. Kang, Detection of cyanide ions in aqueous solutions using cost effective colorimetric sensor, J. Hazard Mater. 334 (2017) 93–103.
[30] http://supramolecular.org(accessed October 2018).
[31] Z.M. Dong, W. Wang, Y.B. Wang, J.N. Wang, L.Y. Qin, Y. Wang, A reversible col-orimetric chemosensor for “Naked Eye” sensing of cyanide ion in semi-aqueous solution, Inorg. Chim. Acta 461 (2017) 8–14.
Fig. 9.1H NMR spectra of C1 (a) and C2 (b) in the absence or presence of CN−(2.0 equiv.) in DMSO‑d 6.
[32] Z. Li, C. Liu, S. Wang, L. Xiao, X. Jing, Visual detection of cyanide ion in aqueous medium by a new chromogenic azo-azomethine chemosensor, Spectrochim. Acta A Mol. Biomol. Spectrosc. 210 (2019) 321–328.
[33] P.-X. Pei, J.-H. Hu, Y. Chen, Y. Sun, J. Qi, A novel dual-channel chemosensor for CN− using asymmetric double-azine derivatives in aqueous media and its appli-cation in bitter almond, Spectrochim. Acta A Mol. Biomol. Spectrosc. 181 (2017) 131–136.
[34] S.B. Roy, A. Maity, K.K. Rajak, A turn-off fluorescence sensor for cyanide detection which in turn inhibit 2-way ESIPT investigated by experimental and theoretical study, Inorg. Chem. Commun. 76 (2017) 81–86.
[35] Y. Singh, T. Ghosh, Highly selective colorimetric and fluorometric chemosensor for cyanide on silica gel and DMSO/H2O (7: 3 v/v) mixed solvent and its imaging in living cells, Talanta 148 (2016) 257–263.
[36] Z. Li, S. Wang, L. Xiao, X. Li, X. Shao, X. Jing, X. Peng, L. Ren, An efficient col-orimetric probe for fluoride ion based on schiff base, Inorg. Chim. Acta 476 (2018) 7–11.
[37] Z. Li, S. Wang, L. Xiao, X. Li, X. Jing, X. Peng, L. Ren, An efficient colorimetric and absorption ratiometric anion sensor based on a simple azo-azomethine receptor, Inorg. Chim. Acta 479 (2018) 148–153.
[38] M.A. Kaloo, J. Sankar, Exclusive fluoride ion recognition and fluorescence “turn-on” response with a label-free DMN Schiff base, Analyst 138 (17) (2013) 4760–4763. [39] R. Sheng, P. Wang, Y. Gao, Y. Wu, W. Liu, J. Ma, H. Li, S. Wu, Colorimetric test kit
for Cu2+ detection, Org. Lett. 10 (21) (2008) 5015–5018.
[40] K. Keshav, P. Torawane, M.K. Kumawat, K. Tayade, S.K. Sahoo, R. Srivastava, A. Kuwar, Highly selective optical and reversible dual-path chemosensor for cya-nide detection and its application in live cells imaging, Biosens. Bioelectron. 92 (2017) 95–100.
[41] M.J. Kim, R. Manivannan, I.J. Kim, Y.-A. Son, A colorimetric and fluorometric chemosensor for the selective detection of cyanide ion in both the aqueous and solid phase, Sens. Actuators B Chem. 253 (2017) 942–948.
[42] R.S. Dickins, D. Parker, Signalling Reversible Anion Binding in Aqueous Media, Macrocyclic Chemistry, Springer, 2005, pp. 121–136.
[43] Y. Marcus, Thermodynamics of solvation of ions. Part 5.—gibbs free energy of hydration at 298.15 K, J. Chem. Soc., Faraday Trans. 87 (18) (1991) 2995–2999. [44] M. Frisch, G. Trucks, H. Schlegel, G. Scuseria, M. Robb, J. Cheeseman, G. Scalmani,
V. Barone, G. Petersson, H. Nakatsuji, Gaussian 16, Revision A. 03, Gaussian, Inc., Wallingford CT, 2016.