EFFECTS OF VARYING LEVELS AND
DIFFERING DURATIONS OF CALORIE
RESTRICTION ON CELLULAR AND
SYNAPTIC PROTEINS, AS WELL AS THE
INFLAMMATORY STATE OF THE FEMALE
MOUSE BRAIN
a thesis submitted to
the graduate school of engineering and science
of bilkent university
in partial fulfillment of the requirements for
the degree of
master of science
in
neuroscience
By
Duygu Macaro˘
glu
September 2020
EFFECTS OF VARYING LEVELS AND DIFFERING DURATIONS OF CALORIE RESTRICTION ON CELLULAR AND SYNAPTIC PROTEINS, AS WELL AS THE INFLAMMATORY STATE OF THE FEMALE MOUSE BRAIN
By Duygu Macaro˘glu September 2020
We certify that we have read this thesis and that in our opinion it is fully adequate, in scope and in quality, as a thesis for the degree of Master of Science.
Michelle Marie Adams(Advisor)
Soner Do˘gan
Hacı Hulusi Kafalıg¨on¨ul
Approved for the Graduate School of Engineering and Science:
ABSTRACT
EFFECTS OF VARYING LEVELS AND DIFFERING
DURATIONS OF CALORIE RESTRICTION ON
CELLULAR AND SYNAPTIC PROTEINS, AS WELL
AS THE INFLAMMATORY STATE OF THE FEMALE
MOUSE BRAIN
Duygu Macaro˘glu M.S. in Neuroscience Advisor: Michelle Marie Adams
September 2020
Aging is an inevitable and complicated process leading to functional decline. Re-garding brain aging, cognitive decline takes place in multiple domains, including learning, memory, executive functions, motor coordination, and language. At the cellular and molecular level, age-related cognitive decline is elucidated with cer-tain hallmarks, including aberrant neuronal network, stem cell exhaustion, glial cell activation, and inflammation. Calorie restriction (CR) is a widely-utilized approach for coping with aging’s detrimental effects even though there is no one agreed way for the application of CR. In this study, varying levels of CRs were applied for differing durations to MMTV-TGF-alpha female mice. The study initiated when mice were 10-weeks of age (Baseline) and carried out until 49/50 weeks of age and 81/82 weeks of age. There were four dietary groups named Ad-libitum (AL; control), Chronic Calorie Restriction (CCR), Intermittent Calorie Restriction - Restriction (ICR-R), and Intermittent Calorie Restriction -Refeed (ICR-RF).
iv
The study’s first aim was to show age-related changes in the cellular and synap-tic proteins and the inflammatory state of the female mice’s brains. The second aim of the study is to demonstrate the effects of varying levels of CR implemented for the short-term and the long-term manner on the same hallmarks. Our find-ings showed both chronic- or intermittent- CR altered the synaptic integrity pro-teins against brain aging at the long-term period (81/82 weeks) compared to the short-term (49/50 weeks) period except for PSD-95. Similarly, both chronic- or intermittent- CR showed an attenuative impact on the pro-inflammatory mark-ers, but IL-6 was affected only by CCR at the same periods. Furthermore, an age-related imbalance between neurogenesis and astrogliogenesis was shown based on DCX and GFAP. Both chronic- or intermittent- CR showed a compensatory effect on it acting through astrogliogenesis, even though it was not statistically significant.
Keywords: brain aging, calorie restriction, proliferation, synaptic integrity, neu-roinflammation, western blot, female mouse .
¨
OZET
DE ˘
G˙IS
¸EN D ¨
UZEY VE FARKLI S ¨
URELERDEK˙I
KALOR˙I KISITLAMASININ H ¨
UCRESEL VE S˙INAPT˙IK
PROTE˙INLER VE D˙IS
¸ ˙I FARE BEYN˙IN˙IN
˙INFLAMATUVAR DURUMU ¨
UZER˙INE ETK˙ILER˙I
Duygu Macaro˘glu N¨orobilim, Y¨uksek Lisans
Tez Danı¸smanı: Michelle Marie Adams Eyl¨ul 2020
Ya¸slanma, fonksiyonel gerilemeye sebep olan ka¸cınılmaz ve karma¸sık bir s¨ure¸ctir. Beyin ya¸slanması ile ilgili olarak, bili¸ssel gerileme; ¨o˘grenme, hafıza, y¨ur¨ut¨uc¨u i¸slevler, motor koordinasyon ve dil dahil olmak ¨uzere bir¸cok farklı alanda ger¸cekle¸sir. H¨ucresel ve molek¨uler d¨uzeyde ise, ya¸sa ba˘glı bili¸ssel gerileme; anor-mal n¨oronal a˘g, k¨ok h¨ucre t¨ukenmesi, glial h¨ucre aktivasyonu ve iltihaplanma gibi belirli ¨ozelliklerle a¸cıklanmaktadır. Kalori kısıtlaması (KK), ya¸slanmanın zararlı etkileriyle ba¸sa ¸cıkmada yaygın olarak kullanılan bir yakla¸sım olmasına ra˘gmen uygulanma y¨ontemi ¨uzerine uzla¸sılmı¸s tek bir y¨ontem yoktur. Bu ¸calı¸smada, MMTV-TGF-alfa di¸si farelere de˘gi¸sen d¨uzey ve farklı s¨urelerde kalori kısıtlaması uygulanmı¸stır. C¸ alı¸smalar, fareler 10 haftalıkken (Ba¸slangı¸c) ba¸slatılmı¸stır ve 49/50 haftalık ve de 81/82 haftalık olana kadar s¨urd¨ur¨ulm¨u¸st¨ur. C¸ alı¸sma, Ad-libitum (AL; kontrol), Kronik Kalori Kısıtlaması (KKK), Aralıklı Kalori Kısıtlaması - Kısıtlama (AKK-K) ve Aralıklı Kalori Kısıtlaması -Yeniden Besleme (AKK-YB) olarak adlandırılan d¨ort farklı diyet grubunu i¸cermektedir.
vi
C¸ alı¸smanın ilk amacı, h¨ucresel ve sinaptik proteinlerdeki ya¸sa ba˘glı de˘gi¸siklikleri ve di¸si farelerin beyinlerinin iltihaplanma durumunu g¨ostermektir. C¸ alı¸smanın ikinci amacı ise, kısa- ve uzun s¨ureli olarak uygulanan de˘gi¸sen d¨uzeydeki kalori kısıtlamalarının belirtilen ¨ozellikler uzerindeki¨ etkilerini g¨ostermektir. Bulgularımız, hem kronik hem de aralıklı KK’nın, sinaptik in-tegrite proteinlerini , PSD-95 hari¸c, beyin ya¸slanmasının etkilerine kar¸sı uzun-s¨ureli (81/82 hafta) uygulamada kısa-s¨ureli (49/50 hafta) uygulamaya kıyasla de˘gi¸stirdi˘gini g¨ostermi¸stir. Benzer ¸sekilde, hem kronik hem de aralıklı KK, proin-flamatuvar belirte¸cler ¨uzerinde zayıflatıcı bir etki g¨ostermi¸stir, fakat IL-6 aynı d¨onemlerde yalnızca KKK’den etkilenmi¸stir. Ayrıca, n¨orojenez ve astrogliojenez arasındaki ya¸sa ba˘glı imbalans, DCX ve GFAP temel alınarak g¨osterilmi¸stir. Hem kronik hem de aralıklı KK, istatistiksel olarak anlamlı olmamasına ra˘gmen as-trogliogenez yoluyla etki eden telafi edici bir etki g¨ostermi¸stir.
Anahtar s¨ozc¨ukler : beyin ya¸slanması, kalori kısıtlaması, proliferasyon, sinaptik integrite, n¨oroinflamasyon, western blot, di¸si fare.
Acknowledgement
First of all, I would like to thank my supervisor Prof. Dr. Michelle M. Adams, for allowing me to be part of her laboratory and research team. And also, I am so grateful to her for giving me this opportunity to work on such a great project.
Secondly, I would like to thank Assoc. Prof. Soner Do˘gan and Asst. Prof. Bilge G¨uven¸c Tuna and their team for sharing their samples generously and help-ing me all the time.
I would like to thank Assoc. Prof. Soner Do˘gan and Asst. Prof. Hacı Hulusi Kafalıg¨on¨ul for taking part in my thesis committee and their help.
I would like to thank all past and current members of Adams Lab, namely Beg¨un Erbaba, Beyza ¨Ozen, Bilge A¸skın, Duygu Mutlu, Erg¨ul Dilan C¸ elebi-Birand, Elif Tu˘g¸ce Karo˘glu-Erav¸sar, Hande ¨Ozge Aydo˘gan, Melek Umay T¨ uz-S¸a¸sik, Narin Ilgım Ardı¸c, Naz Mengi, and Zeynep G¨ultekin for their guidance, assistance, and supports. Most especially, I would like to express my deepest gratitude to Melek Umay T¨uz-S¸a¸sik for her guidance throughout my thesis. Her comments, feedback, and help mean a lot to me. Also, I would like to thank Elif Tu˘g¸ce Karo˘glu-Erav¸sar for her help in statistical analysis. In this regard, I would like to thank Hande ¨Ozge Aydo˘gan as well. She also helped me a lot with the statistical analysis, but more importantly, I am so grateful for her friendship and support all the time.
viii
I would like to express my deepest gratitude to Bilgen I¸sık-Kara¸sahin, Murat Kara¸sahin, and their lovely children Do˘ga and Defne! They became my family in Ankara. Also, I would like to express my deepest gratitude to Clive Topley. I cannot thank enough for his friendship, support, and encouragement all the time.
Last but not least, I would like to express my deepest gratitude to my lovely big family, in particular my mom S¸erife Macaro˘glu, my dad Fahri Macaro˘glu and my lovely sister Yaren Macaro˘glu. I could not have done it without them. I am so lucky to be part of this family and so grateful for their unconditional love and support all the time. My most exceptional thank is to Uzay G¨okay. Words cannot describe how grateful I am for being in my life. You are the pillar of strength in every part of my life.
This thesis was financially supported by The Scientific and Technological Re-search Council of Turkey (TUBITAK) to establish and maintain the experimental animals with the grant no 119S238 and The European Molecular Biology Orga-nization (EMBO) Installation Grant through TUBITAK to Michelle M. Adams for the Western blot experiments.
Contents
1 Introduction 1
1.1 Brain Aging . . . 1
1.2 Proliferation and Brain Aging . . . 3
1.3 Synaptic Alterations and Brain Aging . . . 6
1.4 Neuroinflammation and Brain Aging . . . 8
1.5 Calorie Restriction and Brain Aging . . . 10
1.6 Mouse as a Model Organism . . . 12
1.7 Aim of the Study . . . 13
2 Methods 15 2.1 ∗Animals . . . 15
2.2 ∗Experimental Setup . . . 16
2.3 ∗Sample Homogenization . . . 18
CONTENTS x
2.5 Bradford Assay . . . 20
2.6 Western Blot . . . 23
2.6.1 Sample Preparation for Western Blot . . . 23
2.6.2 SDS-PAGE Gel Preparations . . . 24
2.6.3 Sample Loading and Electrophoresis . . . 26
2.6.4 Electrotransfer of Samples . . . 27
2.6.5 Blocking and Antibody Incubations . . . 28
2.6.6 Chemiluminescent Detection . . . 30
2.7 Image Quantification . . . 31
2.8 Statistical Analysis . . . 32
3 Results 34 3.1 Cellular markers for proliferation . . . 34
3.1.1 Doublecortin (DCX) . . . 34
3.1.2 Glial fibrillary acidic protein (GFAP) . . . 37
3.2 Synaptic integrity markers . . . 40
3.2.1 Postsynaptic Density Protein-95 (PSD-95) . . . 40
3.2.2 Gephyrin (GEP) . . . 43
3.2.3 Synaptophysin (SYN) . . . 46
CONTENTS xi
3.3.1 Interleukin-6 (IL-6) . . . 49
3.3.2 Tumor necrosis factor-alpha (TNF-α) . . . 52
3.3.3 Glial fibrillary acidic protein (GFAP) . . . 55
4 Discussion 56
List of Figures
1.1 Interconnections among hallmarks of aging [4] . . . 3
2.1 Figurative Representation of Experimental Setup . . . 17
2.2 Standard curve of BSA Standards . . . 22
2.3 Figurative Representation of Electrotransfer Assembly in Western Blot . . . 27
3.1 Representative immunoblot image of Doublecortin and Actin (loading control). Each band was labeled according to the du-ration and dietary regimen. . . 35
3.2 Effects of varying levels of calorie restriction at differing durations on the protein level of Doublecortin in the whole brain of MMTV-TGF-α female mice.(A) Bar graph for nor-malized band intensities of DCX for ad-libitum fed animals (n=4 per group; 2 technical replicates for each animal). Each bar rep-resents the mean± SEM.(B) Bar graph for normalized band in-tensities of DCX for ad-libitum, CCR, ICR-R, and ICR-RF fed animals at 49/50 weeks and 81/82 weeks (n=4 per group; 2 tech-nical replicates for each animal). Each bar represents the mean± SEM. . . 36
LIST OF FIGURES xiii
3.3 Representative immunoblot image of GFAP and Actin (loading control). Each band was labeled according to the duration and dietary regimen. . . 38
3.4 Effects of varying levels of calorie restriction at differing durations on the protein level of GFAP in the whole brain of MMTV-TGF-α female mice.(A) Bar graph for normalized band intensities of GFAP for ad-libitum fed animals (n=4 per group; 2 technical replicates for each animal). Each bar represents the mean± SEM.(B) Bar graph for normalized band intensities of GFAP for ad-libitum, CCR, ICR-R, and ICR-RF fed animals at 49/50 weeks and 81/82 weeks (n=4 per group; 2 technical repli-cates for each animal). Each bar represents the mean± SEM. . . . 39
3.5 Representative immunoblot image of PSD-95 and Actin (loading control). Each band was labeled according to the duration and dietary regimen. . . 41
3.6 Effects of varying levels of calorie restriction at differing durations on the protein level of PSD-95 in the whole brain of MMTV-TGF-α female mice.(A) Bar graph for nor-malized band intensities of PSD-95 for ad-libitum fed animals (n=4 per group; 2 technical replicates for each animal). Each bar rep-resents the mean± SEM.(B) Bar graph for normalized band in-tensities of PSD-95 for ad-libitum, CCR, ICR-R, and ICR-RF fed animals at 49/50 weeks and 81/82 weeks (n=4 per group; 2 tech-nical replicates for each animal). Each bar represents the mean± SEM. . . 42
3.7 Representative immunoblot image of GEP and Actin (loading con-trol). Each band was labeled according to the duration and dietary regimen. . . 44
LIST OF FIGURES xiv
3.8 Effects of varying levels of calorie restriction at differing durations on the protein level of GEP in the whole brain of MMTV-TGF-α female mice.(A) Bar graph for normalized band intensities of GEP for ad-libitum fed animals (n=4 per group; 2 technical replicates for each animal). Each bar represents the mean± SEM.(B) Bar graph for normalized band intensities of GEP for ad-libitum, CCR, ICR-R, and ICR-RF fed animals at 49/50 weeks and 81/82 weeks (n=4 per group; 2 technical replicates for each animal). Each bar represents the mean± SEM. . . 45
3.9 Representative immunoblot image of SYN and Actin (loading con-trol). Each band was labeled according to the duration and dietary regimen. . . 47
3.10 Effects of varying levels of calorie restriction at differing durations on the protein level of SYN in the whole brain of MMTV-TGF-α female mice.(A) Bar graph for normalized band intensities of SYN for ad-libitum fed animals (n=4 per group; 2 technical replicates for each animal). Each bar represents the mean± SEM.(B) Bar graph for normalized band intensities of SYN for ad-libitum, CCR, ICR-R, and ICR-RF fed animals at 49/50 weeks and 81/82 weeks (n=4 per group; 2 technical replicates for each animal). Each bar represents the mean± SEM. . . 48
3.11 Representative immunoblot image of IL-6 and Actin (loading con-trol). Each band was labeled according to the duration and dietary regimen. . . 50
LIST OF FIGURES xv
3.12 Effects of varying levels of calorie restriction at differing durations on the protein level of IL-6 protein in the whole brain of MMTV-TGF-α female mice.(A) Bar graph for nor-malized band intensities of IL-6 for ad-libitum fed animals (n=4 per group; 2 technical replicates for each animal). Each bar represents the mean± SEM.(B) Bar graph for normalized band intensities of IL-6 for ad-libitum, CCR, ICR-R, and ICR-RF fed animals at 49/50 weeks and 81/82 weeks (n=4 per group; 2 technical repli-cates for each animal). Each bar represents the mean± SEM. . . . 51
3.13 Representative immunoblot image of TNF-α and Actin (loading control). Each band was labeled according to the duration and dietary regimen. . . 53
3.14 Effects of varying levels of calorie restriction at differing durations on the protein level of TNF-α protein in the whole brain of MMTV-TGF-α female mice.(A) Bar graph for normalized band intensities of TNF-α for ad-libitum fed ani-mals (n=4 per group; 2 technical replicates for each animal). Each bar represents the mean± SEM.(B) Bar graph for normalized band intensities of TNF-α for ad-libitum, CCR, ICR-R, and ICR-RF fed animals at 49/50 weeks and 81/82 weeks (n=4 per group; 2 tech-nical replicates for each animal). Each bar represents the mean± SEM. . . 54
List of Tables
2.1 Number of animals by experimental groups . . . 18
2.2 Radioimmunoprecipitation Assay (RIPA) Buffer Recipe . . . 20
2.3 Standard and unknown protein preparations for Bradford Assay . 21 2.4 Representative plate design for Bradford Assay . . . 22
2.5 Absorbance values of standards and samples obtained at 595 nm . 22 2.6 2X Loading Buffer Recipe . . . 23
2.7 Separating Gel Recipe for 10% and 12% concentrations . . . 25
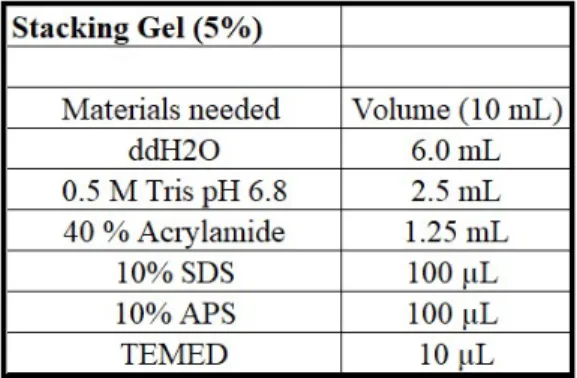
2.8 Stacking Gel Recipe for 5% concentration . . . 25
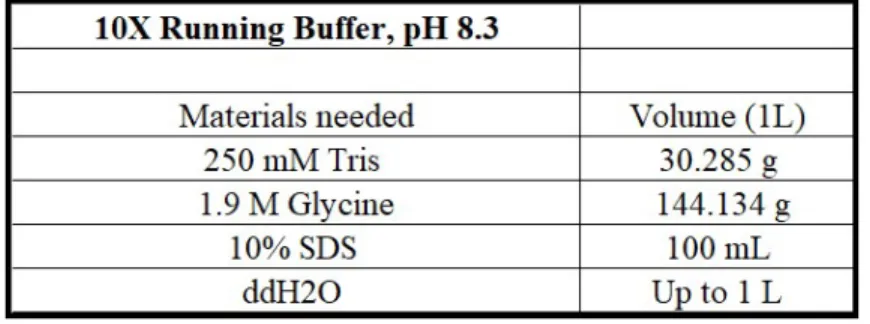
2.9 10X Running Buffer Recipe . . . 26
2.10 1X Transfer Buffer Recipe . . . 28
2.11 10X TBS Recipe . . . 29
2.12 Primary antibody list used in western blot experiments . . . 29
Chapter 1
Introduction
1.1
Brain Aging
Aging is an inevitable and complicated process. Most organisms experience age-related imbalance in the homeostatic state of the body, therefore a decline in body systems’ functioning. Although people may have experienced normal aging, which is not accompanied by pathological conditions, age-related impairments increase the risk factors for multiple diseases, including cardiovascular diseases, neurodegenerative diseases, cancer [1]. The lifespan of the human has been rising with the advancement in the field of health. According to the United Nations (UN), the percentage of older people (over 65 years) in the global population will reach over 15 percent by 2050 [2]. An increase in humans’ life expectancy has caused people to suffer from age-related dysfunctions for a longer time. Therefore, it created the need for improvement in the healthspan of people as that of lifespan.
Regarding normal brain aging, age-related deterioration in the homeostasis is a multifactorial process associated with cognitive impairments in multiple domains. As people get older, they experience mild cognitive decline, including learning, memory, executive functions, motor coordination, language [1, 3]. There are well-accepted brain aging hallmarks at the cellular and molecular levels, includ-ing aberrant neuronal network, stem cell exhaustion, glial cell activation, and inflammation [1]. On the other hand, aging hallmarks are categorized as primary hallmarks (that are the primary causes of aging), antagonistic hallmarks (that are the responses to primary hallmarks), and the integrative hallmarks (that are the response to primary and antagonistic hallmarks and the reason behind the phe-notypically observable alterations during aging) [4]. Due to the aging process’s complexity, it is not possible to attribute age-related alterations to one single hallmark. Instead, most of the brain aging process pathways show a complex interplay between each other, which makes it difficult to understand. Thus, it is essential to understand possible interaction among the hallmarks and how the aging cascades proceed and contribute to cognitive decline.
All in all, brain aging is a complex process, during which more and more people suffer from age-related deteriorations with the expansion of lifespan. It is a process that negatively affects not only the suffered individuals but also economics. Comprehension of complex interplays between hallmarks and the interventions to cope with age-related decline in functions of the brain provides older people with an independent life, as well as may protect them from age-related pathologies.
Figure 1.1: Interconnections among hallmarks of aging [4]
1.2
Proliferation and Brain Aging
Neurogenesis is a process of forming new neurons from neural stem cells (NSCs), which was thought to be restricted only to the embryonic development of the central nervous system (CNS). Starting with Altman’s studies on the postnatal rat hippocampus in 1965, multiple studies were carried on the generation of new neurons after the perinatal period[5, 6, 7]. After the second half of the 1990s, it became evident that neurogenesis is not limited to the central nervous system’s developmental stages in mammals. Instead, the mammalian brain is capable of
producing new neurons throughout adulthood in two well-defined regions: the subgranular zone (SGZ) of the dentate gyrus in the hippocampus and the sub-ventricular zone (SVZ) of the lateral ventricles. The newly born neurons in SGZ of the dentate gyrus remain in the hippocampus and form the dentate granule cells after differentiation. The newly born neurons in SVZ of the lateral ventricles migrate through the rostral migratory stream (RMS) to the olfactory bulb, where they form olfactory interneurons [8, 9].
There are various methods to measure the rate of neurogenesis and cell prolif-eration in the postnatal period. 5’-Bromo-2’-Deoxyuridine (BrdU) is an analog of thymidine, which is able to incorporate into the deoxyribonucleic acid (DNA) during the replication of DNA. Since it is an exogenous marker, it has to be injected generally through intraperitoneally. Immunohistochemical detection of BrdU through fluorescently tagged 2o antibodies is widely used to trace and count the number of dividing cells. It is also possible to get an idea of the proliferation in different cell types using the cell-specific markers with BrdU. In addition to exogenous markers, there are endogenous markers, including Ki-67 and PCNA. Ki-67 is a nuclear protein that is expressed at different stages of the cell cycle. Since it does not need to be injected exogenously, it is used as an alternative to BrdU in neurogenesis studies. Similar to BrdU, it can be detected by immuno-histochemistry [10]. PCNA (proliferating cell nuclear antigen) is an essential factor for the function of DNA polymerases during DNA replication [11]. It is expressed during all cell cycle stages and able to mark dividing cells in the neuro-genic regions. In addition to addressing neurogenesis in the dividing cells, other markers can also assess the source and stages of dividing cells. As mentioned above, co-labeling of actively dividing cells with cell- or stage-specific markers
provides broader comprehension for adult neurogenesis and cellular proliferation. To illustrate, glial fibrillary acidic protein (GFAP) distinguish astrocytes from other glial cells in the central nervous system [12], and ionized calcium-binding adapter molecule 1 (Iba-1) is used for marking the microglial cells [13]. Besides, neuronal cells can be traced at different stages until they become a mature func-tional neuron. Doublecortin is a guider protein during the migration that is used as an immature neuron marker [14]. On the other hand, the neurons’ maturation can be detected by the expression of neuronal nuclei (NeuN) [15].
Even though neurogenesis goes on during adulthood, there are age-related al-terations in the process, including a decrease in the rate of neurogenesis and proliferation, as well as the changes in the microenvironment of the neural stem cells [16] Age-related alterations in the neurogenesis and proliferation has been attributed to cognitive decline [1]. However, certain studies reported an inverse relationship between cognitive abilities and neurogenesis in aged-rats [17]. That is to say, with increasing age, subjects could perform well in behavioral tasks mean-ing intact cognitive ability, but still, they could not have preserved neurogenesis. Therefore, decreased neurogenesis and proliferation can have a different meaning at different ages and needs to be further investigated for the comprehension of this complex topic [18]
1.3
Synaptic Alterations and Brain Aging
Communication between neurons is not provided by physical contact; instead, it occurs by releasing neurochemicals into a specialized gap named synaptic cleft. The synaptic regions have a highly specialized structure to facilitate synap-tic transmission. Essential components for a synapsynap-tic transmission include the presynaptic-, postsynaptic cells, and a synaptic cleft [19]. Presynaptic cells are responsible for the production, storing, and secretion of neurotransmitters in a controlled manner. Neurotransmitters are not found dispersed in the presynaptic terminal; instead, they are stored in synaptic vesicles initially formed from the Golgi apparatus. There are specialized regions named active zones on the presy-naptic terminal, in which Ca+2 channels and SNARE proteins are concentrated. The fusion of synaptic vesicles to the membrane of presynaptic cells is managed through the SNARE, and chaperone proteins that are also found on the vesicular membrane, so active zones are the predetermined regions synaptic vesicles are docked, primed, and fused to release neurotransmitters [19, 20, 21]. Each protein involved in the process is essential for proper synaptic transmission to take place at the right time and place.
Similar to presynaptic cells, postsynaptic cells have specialized regions where the receptors are concentrated through structural proteins. Namely, postsynap-tic density (PSD) regions are suited right across the active zones to facilitate the neurotransmission in the excitatory synapse. In contrast to excitatory synapses, inhibitory synapses do not have PSD but still have specialized composition [22].
Depending on either excitatory or inhibitory synapse, synaptic region composi-tion differs in terms of receptors, structural- and cell adhesion proteins. Exci-tatory postsynaptic density regions are rich in ionotropic- (AMPA and NMDA receptors) and metabotropic glutamatergic receptors (mGlu receptors) and their corresponding structural proteins for stabilization [23, 24]. On the other hand, inhibitory postsynaptic regions are rich in ligand-gated chloride ion channels that are GABA- and glycine receptors. In addition to structural proteins for the lo-calization and stabilization of the postsynaptic receptors, intracellular signaling pathways play a role in the dynamics of receptors on the membrane [25, 26, 27]. The synaptic cleft is the physical gap between presynaptic- and postsynaptic neurons. The extracellular matrix fills the synaptic cleft, which includes the cell adhesion molecules and fibrils considered essential for stabilizing synapses at the right positions [28]. Besides, glial cells are located around the synaptic cleft, where they reuptake of neurotransmitters and endocytose into the presynaptic cells.
Age-related changes in cognitive impairments have been attributed to the neu-ronal and synaptic loss during healthy aging. Contrary to this, recent studies with the improvement in the stereological methods showed that neuron and synapse numbers preserved with aging [29, 30, 31, 32]. Therefore, cognitive impairments can be associated with the subtle molecular and cellular changes in the key synap-tic proteins, as well as the alterations in the excitatory/inhibitory (E/I) balance instead of due to the alterations in neuron or synapse numbers [33, 34].
1.4
Neuroinflammation and Brain Aging
The blood-brain barrier shields the central nervous system (CNS) from the cir-culatory lymphocytes, cytokines, and chemokines under homeostatic conditions. The specialized endothelial cell (EC) forming the blood vessel wall around the brain provides a tight regulation for movements of molecules in and out and pro-tect the CNS from infectious or toxic agents [35]. The innate immunity in the central nervous system is provided by CNS-specific cell types: microglia and as-trocytes. Microglia are the pivotal immune cells of the CNS, whose progenitor cells originate from the yolk sac during the embryonic developmental stage[36]. They constitute around 10-15% of the total cells in the CNS [37]. After com-pletion of embryonic development and BBB construction, they become resident innate immune cells of the CNS. Microglial cells have a highly plastic feature, which is tightly regulated with the interaction in their microenvironment as well as other CNS cells, including astrocytes, neurons, and oligodendrocytes. High plasticity provides microglial cells with morphological changes in response to a variety of threats, including aging, infectious agents, and trauma [38, 39]. Under normal physiological conditions, they are found in a ramified form. In response to various threats, they undergo morphological and molecular alterations named primed state. They become de-ramified morphologically and more responsive to the insults with elevated expression of neuroinflammatory markers and lowered threshold for their activation. Also, they demonstrate age-related alterations in the transcriptional profile [39].
On the other hand, astrocytes are the most abundant cell types in the CNS, whose progenitor cells originate from neural stem cells (NSCs) differently from the microglia [40]. They provide various functions with neurons, including physical support, protection against excitotoxicity by removing excess neurotransmitters from the synaptic cleft, and maintaining the blood-brain barrier [40, 41]. As in the microglial cells, they display high plasticity and go through morphological and molecular alterations as a response to changes in their microenvironments due to various insults. The reactive form of astrocytes in the aged brain has short and stubby processes compared to that of young ages [42]. Upregulation of glial fibrillary acidic protein (GFAP) is considered as a marker for activated astrocytes [12], and the interplay among the astrocytes and microglial cells through cytokines play a significant role in the fate of neuroinflammation [43].
With advancing age, dysregulation of homeostasis in the immunity of CNS leads to polarization in the phenotype of microglia and astrocytes to activated reactive form. Phenotypic alterations in the glial cells are accompanied by the elevation in pro-inflammatory cytokines, including IL-6, TNF-alpha, IL-1beta, which ultimately lead to chronic low-level inflammation [38] Persistent inflam-mation in CNS is thought to be one of the reasons behind age-related cognitive deficits, as well as predispositions to neurodegenerative diseases [44].
1.5
Calorie Restriction and Brain Aging
Caloric restriction (CR) is a well-studied approach, which increases both lifespan and healthspan of the organisms without genetic interventions to cope with the detrimental effects of aging [80]. Even though there are controversial results in CR’s effectiveness on the extension of lifespan and healthspan of the living beings, its effectiveness was shown on various living beings, including yeast, nematodes, fruit flies, and rats [45, 46, 47]. It is based upon varying levels of reduction (20-40%) in the daily caloric intake of organisms without causing an imbalance or malnutrition in macronutrients, including carbohydrate, protein, fat, as well as vitamin and mineral sources [48]. However, there is no one agreed way for applying CR regarding the period, amount, and the way of restriction.
There are two widely used approaches in applying CR: Chronic Calorie Re-striction (CCR) and Intermittent Fasting (IF). In the context of brain aging, both ways have been proven to alleviate age-related deterioration [49]. The basis of CCR is the sustained restriction in the daily calorie intake throughout the study, whereas IF is based on every-other-day feeding. IF has started to gain attention since it can be easily sustained throughout the lifetime compared to the con-stantly applied CR approaches. In addition to the every-other-day feeding way of IF, there is a unique approach, which is a cyclic manner regimen based on a restriction period (severe than CCR) followed by a non-restricted (ad-libitum) period and named as Intermittent Calorie Restriction (ICR) [48, 50]. Gener-ally, CR has been studied in the cross-sectional studies in a life-long manner [51, 52, 53, 54, 55]. But still, short-term CR applications have gained consider-able attention for the understanding mechanism of dietary restrictions as well as
determine the shortest period to have significant impacts against the detrimen-tal effects of aging. Such studies are especially important for the translational potential of CR applications.
Although CR’s impacts on the lifespan and healthspan have been introduced in many organisms, CR’s molecular mechanism has not been elucidated completely. It has been proposed that it alters the molecular pathways that are involved in en-ergy metabolism, including Mammalian Target of Rapamycin (mTOR), Insulin-like Kinase-1 (IGF-1) signaling, and Adenosine Monophosphate-Activated Pro-tein Kinase (AMPK) signaling [56, 57, 58]. In addition to them, CR attenuates aging’s detrimental effects by reducing ROS, oxidative stress, and inflammation. It also leads to the epigenetic modifications on both histone proteins and DNA that ultimately affect the autophagy pathways against aging [56, 57].
On the other hand, there have been findings suggesting a stabilizing effect of CR on the key synaptic proteins, including synaptophysin, NR2A, NR2B, GluR1, and GluR2 [47]. Its neuroprotective effect has been suggested through multiple studies, in which CR increased brain-derived neurotrophic factor (BDNF) level. Due to the role of BDNF in neuronal survival, beneficial effects of CR have been associated with the adult neurogenesis as well [59]. Hence, CR has been implementing widely to ameliorate age-related deteriorations by altering multiple molecules and pathways.
1.6
Mouse as a Model Organism
There are a variety of different model organisms in gerontology studies. In a broad sense, it can be divided into two: mammalian model organisms and non-mammalian model organisms. Each model organism, being either mammal or non-mammal, has its advantages and disadvantages depending on the research questions. Regarding translational research, mammalian model organisms have the priority due to commonalities with humans, including a high percentage of genome similarity, conserved genome sequences, and protein domains [60].
The prevalence of mice as a model organism in aging studies has started around the 1970s after caloric restriction experiments, which were initially done for can-cer tumorigenesis studies. Those studies facilitated the availability of the colonies of the aged-rodents, thereby they become prevalent in aging studies as well [61]. However, because of the concerns about the fluctuation in the female mice’s hor-monal level, scientific research in the aging has been dominated exclusively by male mice. Although it secures against hormonal changes, it stunts the under-standing of brain-aging comprehensively.
In this study, we utilized healthy MMTV-TGF-α (C57BL/6) female mice. Those mice overexpress human transforming growth factor-α (TGF-α) under the control of mouse mammary tumor virus promoter (MMTV). TGF-α acts through epidermal growth factor-receptors (EGF-R/ErbB), which initiates a signaling cas-cades controlling cell proliferation, survival, migration, and differentiation [62] . The overexpression of TGF-α in mammary epithelium is associated with tumor development in the mammary glands around their middle-ages [63, 64]. In that sense, it is a widely used mouse model in breast cancer studies.
Regarding brain aging studies, it is also an important model organism since aging does not come about alone. In fact, aging is a process accompanied by a variety of predispositions to diseases. Hence, it is essential to understand how we age when we have a genetic susceptibility to illness.
All in all, mice as a mammalian model organism have various advantages, including high similarity in terms of the genome sequence, protein structures, and conserved pathways [60]. The inclusion of females and transgenic strains into aging studies is essential to comprehend the brain’s aging process widely. Hence, the knowledge acquired from animal studies can be more comprehensive when the most suitable model organism is utilized.
1.7
Aim of the Study
Nowadays, there is a gradual increase in the lifespan of humans following the advancement in the field of medicine [65]. However, extension in the lifespan is not followed by that of healthspan. People with a higher life expectancy suffer from age-related deterioration for a more extended period. Hence, comprehension of how healthier brain aging can be achieved becomes significant for people to sustain independent and disease-free life.
Calorie restriction is a well-studied approach, which trustily increases both lifespan and healthspan of the organisms without genetic interventions [80]. Al-though we have non-negligible knowledge regarding CR and its impacts on the brain, it is still not understood fully. Also, there is no one agreed way for the application of CR in terms of restriction amount and period of application. On
the other hand, both brain aging and CR studies have been male-dominated due to the concerns about the hormonal fluctuation in females, which stunts the understanding of brain-aging comprehensively.
Here in this thesis, we firstly aimed to show age-related changes in the cellular and synaptic proteins as well as the inflammatory state of the female mice’s brains. The second aim of the study is to demonstrate the effects of varying types of dietary restrictions implemented for the short-term and the long-term manner on the same topics and the potential of dietary regimens to slow down the age-related alterations.
Chapter 2
Methods
Section titles marked with an asteriks (∗) indicates that those prodecures were performed by the team of Do˘gan-Lab at Yeditepe University.
2.1
∗Animals
MMTV-TGF-α (C57BL/6) male mice were donated by Dr. Margot Cleary, Hormel Institute Medical Research Center, University of Minnesota. The breed-ing colony was established at Yeditepe University, YUDETAM. MMTV-TGF-α positive female mice were obtained by crossing the following mice: MMTV-TGF-α (C57BL/6) positive male with MMTV-TGF-MMTV-TGF-α (C57BL/6) negative female. During the experiments, animals were subjected to a controlled environment (21 − 24oC temperature and 12h/12h light cycle). Also, they had free access
to water. Their medical conditions were checked on a daily basis. All the ex-perimental procedure applied to animals was approved by Yeditepe University Animal Care and Use Committee.
2.2
∗Experimental Setup
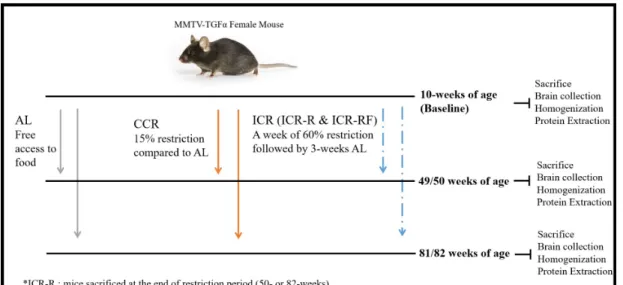
In this study, thirty-six female MMTV-TGF-α (C57BL/6) mice were used. The distribution of the animal numbers by experimental groups was indicated in Table 2.1. Feeding experiments were started when mice were 10 weeks old (Young Adult). A set of mice was sacrificed at the beginning of the feeding experiments to form a baseline. They were also named as Baseline (10-weeks). Other animals were randomly assigned to three different diet groups: Ad libitum(AL), Chronic Caloric Restriction (CCR), and Intermittent Caloric Restriction(ICR). Mice were fed with a standard pathogen-free food – Altromin TPF 1414, provided from Kobay A.S¸ (Ankara, Turkey).
Mice in the AL group had free access to food until they were sacrificed. Mice in the CCR group were subjected to 15% restriction in their daily caloric intake compared to AL-fed mice. Mice in the ICR group were subjected to 60% re-striction for a week, then 60% rere-striction was followed by three-week ad-libitum feeding. This four-week cyclic regimen was applied until the designated time-points. Mice in the ICR group was further divided into two groups based on which stage of the cyclic regimen they were sacrificed. A group of mice being sac-rificed right after the 60% restriction period was named ICR-Restriction (ICR-R); on the other hand, a group of mice being sacrificed after the ad-libitum period was called ICR-Refeed (ICR-RF).
Animals were subjected to the feeding regimens as mentioned above until two designated time points: 49/50-weeks (Middle-Aged) and 81/82-weeks (Old). All mice were sacrificed after overnight fasting. Mice in the ICR-RF group were sacrificed in either 49-weeks or 81-weeks, which correspond to the end of the refeeding period. Mice in the ICR-R group were sacrificed in either 50-weeks or 82-weeks, which correspond to the end of the restriction period. Mice in the AL and CCR groups were sacrificed in all four designated weeks (49-week,50-week,81-week, and 82-week). Since the animals sacrificed at consecutive weeks did not show a significant difference in terms of weight, size, or medical conditions, they were considered as one time period as 49/50-weeks and 81/82-weeks (Figure 2.1).
Table 2.1: Number of animals by experimental groups
2.3
∗Sample Homogenization
Mice were sacrificed at the designated time-points. First of all, whole brains were collected then they were cut into half through a sagittal plane. One-half of the brains were immediately frozen via dry-ice, and the other halves were utilized for the pathological examinations.
Frozen brain tissues were used for homogenization. Firstly, brain tissues were weighed then were cut into small pieces to ease the homogenization. And then, they were washed with 600 µL of 1X PBS to remove surface contaminants. The washing step was performed three times and through pipetting up and down. After the washing, a spoon of 0.5 mm zirconium oxide beads (ZROB05) was placed on the samples. 1X PBS Buffer was used as a homogenization buffer. The volume of PBS Buffer was determined according to the weight of the brain samples (that is, 400 µL of PBS was added for 200 mg of brain sample). Then the cap of eppendorf was closed tightly and covered by using parafilm. Homogenization
was performed by means of Bullet Blender at Speed 8 for 3 min. When homog-enization was accomplished, zirconium beads were removed by centrifugation at max rpm for 10 min at +4oC. Homogenized brain tissues were collected into a new 1.5 mL eppendorf and stored at -86oC for further experiments.
2.4
Protein Extraction from Mouse Brain
Ho-mogenates
The brain homogenates which were homogenized in ice-cold, sterile 1X PBS by the members of Do˘gan Lab in Yeditepe University were taken from -80oC refrigerator.
For each group of samples, 50 µL of brain homogenates were used for protein extraction purposes. They were thawed on ice then mixed well by pipetting before centrifugation. First of all, PBS was removed from each of the samples by centrifugation at 14.000 rpm for 10 min at +4oC. Resulting supernatants were discarded then pellets were dissolved in 300 µL of radioimmunoprecipitation assay (RIPA) buffer [0.25%(w/v) Sodium Deoxycholate, 1mM Sodium Chloride, 50-mM Tris-HCl pH 8.0, %1(v/v) NP-40, 1.0-50-mM EDTA, 1X Protease Inhibitor (05 892 970 001, Roche) and 1%(v/v) Phosphatase Inhibitor (P0044, Sigma)]. The amount of RIPA buffer was decided based on the previous optimization experiments. Afterward, each sample was waited on ice for 30 min and tapped gently every 10 min interval. They were then centrifuged at 13.000 rpm for 20 min at +4oC, and supernatants were carefully collected into new eppendorfs. Supernatants were aliquoted to decrease the negative effect of the thaw/freeze cycle on proteins. The recipe of RIPA Buffer is shown in Table 2.2
Table 2.2: Radioimmunoprecipitation Assay (RIPA) Buffer Recipe
2.5
Bradford Assay
To determine the concentration of soluble protein extracts, Bradford Assay was used. The assay was performed on a 96-well plate. As a standard, Bovine Serum Albumin (BSA, 1mg/mL) was used in different concentrations with a range of 2 µg/mL – 20 µg/mL.
First of all, ddH20 was added into the 96-well plate, as indicated in Table 2.3.
After then, BSA (A7906, Sigma-Aldrich, St. Louis, MO, USA) and the unknown protein samples were loaded accordingly. Blank, standards, and samples were loaded in duplicates. Lastly, 250 µL of Bradford Assay Reagent (B6916, Sigma, St. Louis, MO, USA) was added onto each well. The plate was shaken on an orbital shaker at 250 rpm for 45 seconds at room temperature then placed
into a dark place for 10 min incubation without shaking. In the meantime, the Microplate Reader (SpectraMax M5, Molecular Devices, Sunnyvale, CA, USA) was turned on and was allowed for being calibrated. Before taking measurements, the presence of air-bubbles on each well was checked, and they were blown up, if any. The absorbances were obtained at 595 nm wavelength. The absorbance of the blank was substrated automatically by the SoftMax-Pro Software. A standard curve was plotted based on the net absorbances of standards (Figure 2.2). Then the concentrations of the unknown proteins were calculated according to the linear equation of the standard curve.
Table 2.4: Representative plate design for Bradford Assay
Table 2.5: Absorbance values of standards and samples obtained at 595 nm
2.6
Western Blot
Western blotting is a widely used laboratory method to differentiate a protein of interest from a mixture and/or to see the changes in the amount of protein across treatments [66].
2.6.1
Sample Preparation for Western Blot
The amount of protein loaded into the wells was determined by optimization ex-periments. To avoid any saturation on the band intensity, proteins were prepared in two different quantities as 20 µg for GEP [67] and SYN [68], and as 40 µg for PSD-95 [69], DCX [70], IL-6 [71], TNF-alpha [72], and GFAP [73]. Loading control - Actin [74] worked well in both quantities without saturation. According to the required amount of proteins, proteins were diluted with ddH20, then mixed
with 2X Loading Dye (Table 2.6). 10% DTT was added freshly into 2X Loading Buffer in the ratio of 1:9. Samples were boiled at 95oC for 5 min before loading
into wells. After heating, they were quick spun and waited on ice.
2.6.2
SDS-PAGE Gel Preparations
According to the size of the protein of interests, two different separating gel concentrations were used. 10% separating gel was used to separate the size of proteins in the range of 110 kDa - 35 kDa, and 12% separating gel was used for the proteins whose sizes are in the range of 50 kDa - 15 kDa. The stacking gel concentration was 5% for both. For both concentrations of separation gel, glass plates with 1.5 mm integrated spacers were used. They were covered with a short plate then slid into the casting frame as the short plate facing forward. Before pouring the gel mixture, gel cassettes were checked against any leakage. Depend-ing on the protein of interests, either 10% or 12% of separatDepend-ing gel was prepared, as shown in Table 2.7. The gel was poured into the gel cassette via pipette. Iso-propanol alcohol was added on top of the separating gel in order to flatten the gel and aid polymerization. When the gel was polymerized, isopropanol alcohol was discarded. Then the stacking gel solution, which was prepared, as indicated in Table 2.8, was poured over the separating gel. Air-bubble was blown up, if any. A 15-well comb was placed carefully. The gels were left to be polymerized for about 20 min.
Table 2.7: Separating Gel Recipe for 10% and 12% concentrations
2.6.3
Sample Loading and Electrophoresis
Gel cassette sandwiches were removed from the casting frame carefully. Residual polymerized gel outside of the gel cassette sandwiches was cleaned with double-distilled water. Then they were placed into the electrode assembly as the short plate facing inward. Any leakage was checked, then the tank was filled with 1X Running Buffer (Table 2.9) until a two gel level. The combs were taken out carefully without disrupting the wells. Before loading the samples, they were mixed well then were quick spun. Each sample was loaded carefully in order not to introduce any bubble into wells. A protein ladder (26616, Thermo Scientific Paisley, UK) was loaded as 2µL before the first sample and after last the sample. The remaining empty wells were loaded with 2X loading dye so that samples could run in a balance. As an electrophoresis system, Mini-PROTEAN Tetra Cell (BioRad, CA, USA) was utilized. Samples were run for 30 min at 90V to align perfectly before being separated according to size. After then, the voltage was increased to 120V at which the samples were run until loading dyes reach the end of the gel. The entire running process had lasted around 2-2.5 hours.
2.6.4
Electrotransfer of Samples
Ten to fifteen minutes before the end of the electrophoresis, Polyvinylidene di-fluoride (PDVF) membranes were soaked into 100% methanol for the activation. After 3 min incubation in the 100% methanol, the membranes were transferred into ice-cold 1X Transfer Buffer (Table 2.10). In the meantime, transfer equip-ment: Whatman filter papers, gel holder cassette, and foam pads were also equi-librated in ice-cold 1X Transfer Buffer. Upon completing the electrophoresis, gel cassette sandwiches were taken from the chamber, and then the short plates were removed via gel releasers. After discarding the stacking gel, the transfer sandwich was assembled, as indicated in Figure 2.3.
Figure 2.3: Figurative Representation of Electrotransfer Assembly in Western Blot
The transfer sandwich was slid into the electrode assembly. The cooling unit was placed into the tank. The tank was filled with ice-cold 1X Transfer Buffer then covered by the lid. The transfer was carried out in the Mini Trans-Blot Cell Module (BioRad, CA, USA) in a cold room. Transfers of PSD-95 [69], GEP [67], DCX [70], and SYN [68] were performed at 100 V for 90 min, whereas transfers of IL-6 [71], TNF-alpha [72], and GFAP [73] were performed at 90 V for 75 min.
Table 2.10: 1X Transfer Buffer Recipe
2.6.5
Blocking and Antibody Incubations
Around thirty minutes before the end of the electrotransfer, 5% blocking solution was prepared in a 50 mL falcon. The type of blocking solution was determined according to the optimization experiments of antibodies. In this study, all anti-bodies performed better with 5% non-fat dry milk in 1X-TBS-T (Tris Buffered Saline - 3% Tween 20) (Table 2.11). Depending on the required volume of the blocking solution, non-fat dry milk powder was weighed and dissolved in 1X TBS-T. Then it was left on the shaker in the cold-room.
Table 2.11: 10X TBS Recipe
After the electrotransfer of the proteins, PDVF membranes were taken from the transfer system and then was put into 1X-TBS-T. Membranes were cut into smaller pieces according to the position of protein interests. In this way, more than one protein of interest could be checked per each running. Then they were blocked by 5% dry-milk in 1X-TBS-T for an hour at room temperature on a shaker. After the blocking step, they were washed with 1X TBS-T for 5 min on a shaker then incubated with the primary antibody (Table 2.12) at +4oC for
overnight.
After overnight incubation with the primary antibody, membranes were washed three times with 1X TBS-T for 10 min. Then they were incubated with secondary antibody(Table 2.13) at room temperature for an hour. After secondary antibody incubation, membranes were washed three times with 1X TBS-T for 10 min and become ready for chemiluminescent detection.
Table 2.13: Secondary antibody list used in the western blot experiments
2.6.6
Chemiluminescent Detection
Around ten minutes before taking images, the Biorad-ChemiDocTM XRS+ imag-ing system (Biorad, CA, USA) was turned on. Then, the tray was cleaned by 70% Ethanol. For the detection purpose, Supersignal West Femto Maximum Sensitivity Substrate (Thermo-scientific, Rockford, IL, USA: 34095) was used.
When the imaging system becomes ready, the chemiluminescent solution was prepared by mixing the enhancer solution and the peroxide solution in a ratio of 1-1. The membrane was placed onto a clean and flat surface; then, it was covered by the chemiluminescent solution. After 5 min incubation of the membrane with the chemiluminescent solution at dark, the membrane was interlaid in a clean
piece of a sheet protector. After the excess solution was dried by a towel paper, the protein of interest was visualized. The exposure time was varied depending on the antibody and protein of interests. It was optimized for intense band by Image Lab 6.1 Software to avoid signal saturation.
2.7
Image Quantification
All image quantifications were performed in a double-blind manner. Gel images were exported from Image Lab 6.1 Software for quantification. Band intensity measurements were done through the ImageJ program (NIH, Bethesda, MD, USA). Exported images were opened by the ImageJ, and then their types were changed to 16-bit from the RGB scale. Each band was enclosed with a rectangle. The size of the rectangle was the same for all the bands in the same image. After the selection of band areas, each lane was plotted. A straight line was drawn to the bottom side of the curve to define the measurement area. It is also essential to eliminate any background effect on the band intensity measurement. The area under the curve was measured, then normalization steps were followed.
There were two different normalization approaches applied to data. The first one was within gel normalization. The aim of within-gel normalization was to minimize the differences among technical replicates, which might have happened due to variation in exposure time or experimental process. Firstly, all band in-tensities of an antibody in the same gel were averaged. Then each band intensity of that antibody, which was in the same blot, was divided by the averaged value. This procedure was applied to all antibodies, including the loading control. The second normalization approach was related to the internal loading control, where
each band intensity of an antibody was divided by band intensity of its corre-sponding loading control (i.e., Actin). Loading-control normalization was applied after the within-gel normalization. The second normalization is essential for elim-inating errors that might have occurred during the sample loading part.
2.8
Statistical Analysis
Statistical analysis was performed by using IBM SPSS Statistics 22 Software (IBM, USA). The results were shown as mean ± SEM . The sample size for each experimental group was four (n=4). For each biological replicate, there were two technical replicates.
The homogeneity of variance and the normality were checked by Levene’s Test and Kolmogorov-Smirnov Test, respectively. Analysis of Variances(ANOVA) was implemented when both assumptions were not violated. One-Way ANOVA was performed with a factor of duration with three levels (10 weeks, 49/50 weeks, and 81/82 weeks) to see whether the duration has an impact on the protein level of ad-libitum fed mice. Two-Way ANOVA was carried out with a factor of duration with two levels (49/50 weeks and 81/82 weeks) and a diet factor with four levels (AL, CCR, ICR-R, and ICR-RF). Pairwise comparisons were performed via Tukey’s Post Hoc Test whenever required. A simple effect test was followed whenever there was a statistically significant main effect (either duration or diet) or interaction.
Kruskal Wallis Test was applied to a group of protein data when both as-sumptions were violated. Three Kruskal Wallis Tests were used to those data to analyze the effects of independent variables. The first one was performed with a factor of duration with three levels (10 weeks, 49/50 weeks, and 81/82 weeks) to examine if the duration affects the protein level of AL-fed mice. Since the Kruskal Wallis Test is not able to deal with two independent variables together, the effects of duration and diet were analyzed one by one. Whenever there was a statistically significant duration or diet effect, Kruskal Wallis Test was followed by Mann-Whitney U Test for pairwise comparison. P-value adjustment was done and stated where necessary so that the accumulation of Type I error could be eliminated.
Chapter 3
Results
3.1
Cellular markers for proliferation
3.1.1
Doublecortin (DCX)
Doublecortin (DCX) is an essential protein guiding the immature neurons throughout their migration during developmental stages and adult neurogene-sis [14]. The protein level of DCX was investigated to comprehend the age- and caloric restriction (CR) -related alterations in the proliferative state of the brain.
Following the validation of the normality and equal variances, Analysis of Vari-ances (ANOVAs) was performed on normalized protein data. One-way ANOVA test showed no significant effect of duration on the protein level of DCX on ad-libitum fed mice at the p <.05 level (F(2,9)= 0.185, p = .835). This result indicates
that the protein level of DCX tends to be stable in the whole brain of ad-libitum fed mice with advancing duration/age.
On the other hand, Two-way ANOVA revealed a significant main effect of duration on the protein level of doublecortin on mice subjected to different dietary regimens at the p <.05 level (F(1,24) = 6.010, p = .022). A simple effect analysis
was carried out to understand better the effect of duration on different dietary regimen groups. It was revealed that the effect of duration was statistically significant on the Chronic Caloric Restriction (CCR) group at the p <.05 level (F(1,24) = 9.490, ∗p = .005 ). In fact, the protein level of doublecortin tends to
decrease with increasing duration of the aforementioned dietary regimen, whereas other dietary regimens tend to be stable with advancing duration/age.
Figure 3.1: Representative immunoblot image of Doublecortin and Actin (loading control). Each band was labeled according to the duration and dietary regimen.
Figure 3.2: Effects of varying levels of calorie restriction at differing durations on the protein level of Doublecortin in the whole brain of MMTV-TGF-α female mice.(A) Bar graph for normalized band intensities of DCX for ad-libitum fed animals (n=4 per group; 2 technical replicates for each animal). Each bar represents the mean± SEM.(B) Bar graph for normalized band intensities of DCX for ad-libitum, CCR, ICR-R, and ICR-RF fed animals at 49/50 weeks and 81/82 weeks (n=4 per group; 2 technical replicates for each
3.1.2
Glial fibrillary acidic protein (GFAP)
Glial fibrillary acidic protein (GFAP) is a structural protein that belongs to class III intermediate filaments. It is used to distinguish astrocytes from other glial cells in the central nervous system. In addition to being a marker for astrocytes, its increasing level is associated with neuroinflammation [12]. The protein level of GFAP was investigated to comprehend the age- and caloric restriction (CR) -related alterations in both the proliferative- and inflammatory state of the brain.
Following the violation of the normality and equal variances, Kruskal Wallis H Test was performed on normalized protein data. Kruskal Wallis Test applied to ad-libitum fed mice data showed a statistically significant effect of duration on the protein level of glial fibrillary acidic protein (GFAP) at the p <.05 level (χ2(2) = 8.115, p = 0.017). Following the significant p-value, Mann Whitney
U Test was applied to see which groups have the statistical significance. It was revealed that the protein level of GFAP tends to be stable until the age of 49/50-weeks (U=1.000, #p = 0.043); however, it tends to increase after 49/50-weeks of age where there was a statistically significant difference among 49/50-weeks- and 81/82-weeks of age at the p <.025 level (U=0.000,∗p = 0.021).
To understand the effects of different dietary regimens (AL, CCR, ICR-R, and ICR-RF) and their durations (49/50-weeks and 81/82-weeks), two more Kruskal Wallis H Test were performed. The test results revealed a significant main effect of duration on the protein level of glial fibrillary acidic protein (GFAP) at the p <.05 level (χ2(1) = 23.273, p = 0.000). Following the significant p-value, Mann
Whitney U Test was applied to see which dietary groups have the statistical significance by increasing duration. Regardless of the type of dietary regimens, the protein level of GFAP was in a tendency to rise by increasing duration/age in all dietary regimens at the p <.025 level. (U=0.000,∗p =0.021)
Figure 3.3: Representative immunoblot image of GFAP and Actin (loading con-trol). Each band was labeled according to the duration and dietary regimen.
Figure 3.4: Effects of varying levels of calorie restriction at differing durations on the protein level of GFAP in the whole brain of MMTV-TGF-α female mice.(A) Bar graph for normalized band intensities of GFAP for ad-libitum fed animals (n=4 per group; 2 technical replicates for each animal). Each bar represents the mean± SEM.(B) Bar graph for normalized band inten-sities of GFAP for ad-libitum, CCR, ICR-R, and ICR-RF fed animals at 49/50 weeks and 81/82 weeks (n=4 per group; 2 technical replicates for each animal).
3.2
Synaptic integrity markers
3.2.1
Postsynaptic Density Protein-95 (PSD-95)
Postsynaptic Density Protein-95 (PSD-95) is one of the main scaffolding proteins localized at the postsynaptic density regions of the excitatory synapses. It reg-ulates the clustering of the key components at the postsynaptic sites, including NMDA receptors, K-ion channels, and cell adhesion molecules [23, 24, 75, 76]. The protein level of PSD-95 was investigated to comprehend the age- and caloric restriction (CR) -related alterations in the integrity of postsynaptic excitatory regions.
Following the violation of the normality and equal variances, Kruskal Wallis H Test was performed on normalized protein data. Kruskal Wallis Test applied to ad-libitum fed mice data showed that there was not a statistically significant effect of duration on the protein level of PSD-95 at the p <.05 level (χ2(2) = .346, p = .841). This result indicates that the protein level of PSD-95 tends to be stable in the whole brain of ad-libitum fed mice with increasing duration/age.
To understand the effects of different dietary regimens (AL, CCR, ICR-R, and ICR-RF) and their durations (49/50-weeks and 81/82-weeks), two more Kruskal Wallis H Test were performed. The test results revealed no significant main effect of duration or diet on the protein level of PSD-95 at the p <.05 level (χ2(1) = 2.750, p = 0.097, χ2(3) = 5.287, p = .152 ,respectively). Hence, it indicates that
PSD-95 at the protein level tends to be stable regardless of the dietary regimens and their application periods in the whole brain of MMTV-TGF-alpha female mice.
Figure 3.5: Representative immunoblot image of PSD-95 and Actin (loading control). Each band was labeled according to the duration and dietary regimen.
Figure 3.6: Effects of varying levels of calorie restriction at differing durations on the protein level of PSD-95 in the whole brain of MMTV-TGF-α female mice.(A) Bar graph for normalized band intensities of PSD-95 for ad-libitum fed animals (n=4 per group; 2 technical replicates for each animal). Each bar represents the mean± SEM.(B) Bar graph for normalized band intensities of PSD-95 for ad-libitum, CCR, ICR-R, and ICR-RF fed animals at 49/50 weeks and 81/82 weeks (n=4 per group; 2 technical replicates for each
3.2.2
Gephyrin (GEP)
Gephyrin (GEP) is one of the essential inhibitory postsynaptic scaffolding protein that takes a role in the regulation of the anchoring and stabilization of GABAAR
and Glycine Receptor at the postsynaptic density sites [26, 25]. The protein level of GEP was investigated to comprehend the age- and caloric restriction (CR) -related alterations in the integrity of postsynaptic inhibitory regions.
Following the validation of the normality and equal variances, Analysis of Vari-ances (ANOVAs) was performed on normalized protein data. One-way ANOVA test showed a statistically significant effect of duration on the protein level of GEP on ad-libitum fed mice at the p <.05 level (F(2,9) = 4.312, p = .049).
Fol-lowing the significant ANOVA test result, Tukey’s HSD Post Hoc Test revealed a statistically significant difference among Baseline (10-weeks of age) and 49/50 weeks of age at the p <.05 level (∗p = 0.043) . This result indicates that the protein level of GEP tends to decrease in the whole brain of ad-libitum fed mice with increasing age even though the reduction at 81/82 weeks of age was not statistically significant compared to Baseline (p = .187).
On the other hand, Two-way ANOVA revealed that there was a significant main effect of duration on the protein level of GEP on mice, which were sub-jected to different dietary regimens, at the p <.05 level (F(1,24)= 35.772, p =
.000). Simple effect analysis was carried out to better understand the effect of duration on different dietary regimen groups. It was revealed that the simple ef-fect of duration was statistically significant on three of the diet groups as follows: Chronic Caloric Restriction (CCR) group at the p <.05 level (F(1,24)= 15.915, ∗∗p
(F(1,24)= 8.157, ∗∗p = .009) and Intermittent Caloric Restriction-Refeed
(ICR-RF) at the p <.05 level (F(1,24) = 17.232, ∗∗∗p = .000). In fact, the protein level
of GEP tends to increase with increasing duration of caloric restriction treat-ments regardless of type. In contrast, ad-libitum feeding tends to be stable with increasing duration.
Furthermore, the simple effect of diet was statistically significant at the dura-tion of 81/82 weeks at the p <.05 level (F(3,24)= 4.272, p = .015). The pairwise
comparisons on dietary regimens in 81/82 weeks revealed a statistically signifi-cant increase in the protein level of GEP in the ICR-RF group compared to AL feeding at the p <.05 level (bp = 0.020, Bonferroni adjusted). Besides, there was
also a marginally significant difference in the CCR group compared to AL feeding in the duration of 81/82 weeks (ap =0.064, Bonferroni adjusted)
Figure 3.7: Representative immunoblot image of GEP and Actin (loading con-trol). Each band was labeled according to the duration and dietary regimen.
Figure 3.8: Effects of varying levels of calorie restriction at differing durations on the protein level of GEP in the whole brain of MMTV-TGF-α female mice.(A) Bar graph for normalized band intensities of GEP for ad-libitum fed animals (n=4 per group; 2 technical replicates for each animal). Each bar represents the mean± SEM.(B) Bar graph for normalized band inten-sities of GEP for ad-libitum, CCR, ICR-R, and ICR-RF fed animals at 49/50 weeks and 81/82 weeks (n=4 per group; 2 technical replicates for each animal).
3.2.3
Synaptophysin (SYN)
Synaptophysin (SYN) is a vesicle-associated protein located in the presynaptic synapse. It plays a role in the fusion of the vesicles to the membrane of the presynaptic neurons and the reuptake of neurotransmitters by endocytosis [77]. The protein level of SYN was investigated to comprehend the age- and caloric restriction (CR) -related alterations in the integrity of presynaptic regions.
Following the violation of the normality and equal variances, Kruskal Wallis H Test was performed on normalized protein data. Kruskal Wallis Test applied to ad-libitum fed mice data showed that there was not a statistically significant effect of duration on the protein level of synaptophysin at the p <.05 level (χ2(2)= 2.192, p = 0.334). This result indicates that the protein level of synaptophysin tends to be stable in the whole brain of ad-libitum fed mice with increasing duration/age.
To understand the effects of different dietary regimens (AL, CCR, ICR-R, and ICR-RF) and their durations (49/50-weeks and 81/82-weeks), two more Kruskal Wallis H Test were performed. The test results revealed a significant main effect of duration on the protein level of synaptophysin at the p <.05 level (χ2(1)=
16.568, p = 0.000). Following the significant p-value, Mann Whitney U Test was applied to see which dietary groups have the statistical significance by increasing duration. It was revealed that the effect of duration was statistically significant
on three of the diet groups as follows: Chronic Caloric Restriction (CCR) group at the p <.025 level (U=0.000, ∗p =0.021), Intermittent Caloric Restriction-Restriction(ICR-R) at the p <.025 level (U=0.000, ∗p =0.021) and Intermittent Caloric Restriction-Refeed (ICR-RF) at the p <.025 level (U=0.000,∗p =0.021). In fact, the protein level of synaptophysin tends to decrease with increasing du-ration of caloric restriction treatments regardless of type. In contrast, ad-libitum feeding tends to be stable with increasing duration.
Figure 3.9: Representative immunoblot image of SYN and Actin (loading con-trol). Each band was labeled according to the duration and dietary regimen.
Figure 3.10: Effects of varying levels of calorie restriction at differing durations on the protein level of SYN in the whole brain of MMTV-TGF-α female mice.(A) Bar graph for normalized band intensities of SYN for ad-libitum fed animals (n=4 per group; 2 technical replicates for each animal). Each bar represents the mean± SEM.(B) Bar graph for normalized band inten-sities of SYN for ad-libitum, CCR, ICR-R, and ICR-RF fed animals at 49/50 weeks and 81/82 weeks (n=4 per group; 2 technical replicates for each animal).
3.3
Inflammatory markers
3.3.1
Interleukin-6 (IL-6)
Interleukin 6 (IL-6) is another main pro-inflammatory cytokine secreted by var-ious central nervous system cells, including neurons, astrocytes, microglial cells, and endothelial cells [78]. The protein level of IL-6 was investigated to compre-hend the age- and caloric restriction (CR) -related alterations in the neuroinflam-matory response of the brain.
Following the validation of the normality and equal variances, Analysis of Vari-ances (ANOVAs) was performed on normalized protein data. One-way ANOVA test showed a significant effect of duration on the protein level of IL-6 on ad-libitum fed mice at the p <.05 level (F(2,9)= 7.693, p = .011). Following the
significant ANOVA test result, Tukey’s HSD Post Hoc Test revealed a statisti-cally significant difference among Baseline (10-weeks of age) and 49/50 weeks of age at the p <.05 level (∗p = 0.015) and between Baseline and 81/82 weeks of age p <.05 level (∗p = 0.027) This result indicates that the protein level of IL-6 tends to increase compared to the Baseline (10-weeks of age) in the whole brain of ad-libitum fed mice with increasing age. However, there was not a statisti-cally significant difference between 49/50-weeks- and 81/82-weeks of age animals. Therefore the increase in the protein level of IL-6 was not perpetual by the du-ration; instead, it stays stable between 49/50-weeks- and 81/82-weeks of age.
![Figure 1.1: Interconnections among hallmarks of aging [4]](https://thumb-eu.123doks.com/thumbv2/9libnet/5685645.114577/19.918.273.689.175.586/figure-interconnections-among-hallmarks-of-aging.webp)