COMPARING DESIGNERS’ COGNITIVE BEHAVIORS IN
GEOMETRY-BASED AND PARAMETRIC 3D MODELING ENVIRONMENTS
A Master’s Thesis
by
ÇETİN TÜNGER
Department of
Interior Architecture and Environmental Design İhsan Doğramacı Bilkent University
Ankara July 2014
COMPARING DESIGNERS’ COGNITIVE BEHAVIORS IN
GEOMETRY-BASED AND PARAMETRIC 3D MODELING ENVIRONMENTS
Graduate School of Economics and Social Sciences of
İhsan Doğramacı Bilkent University
by
ÇETİN TÜNGER
In Partial Fulfillment of the Requirements for the Degree of MASTER OF FINE ARTS
in
THE DEPARTMENT OF
INTERIOR ARCHITECTURE AND ENVIRONMENTAL DESIGN IHSAN DOĞRAMACI BILKENT UNIVERSITY
ANKARA July 2014
I certify that I have read this thesis and have found that it is fully adequate, in scope and in quality, as a thesis for the degree of Master of Arts in Interior Architecture and Environmental Design.
---
Assistant Prof. Dr. Şule Taşlı Pektaş Supervisor
I certify that I have read this thesis and have found that it is fully adequate, in scope and in quality, as a thesis for the degree of Master of Arts in Interior Architecture and Environmental Design.
---
Assistant Prof. Dr. Yasemin Afacan Examining Committee Member
I certify that I have read this thesis and have found that it is fully adequate, in scope and in quality, as a thesis for the degree of Master of Arts in Interior Architecture and Environmental Design.
---
Visiting Assistant Prof. Dr. Necmiye Yaprak Savut Examining Committee Member
Approval of the Graduate School of Economics and Social Sciences
--- Prof. Erdal Erel
ABSTRACT
COMPARING DESIGNERS’ COGNITIVE BEHAVIORS IN GEOMETRY-BASED AND PARAMETRIC
3D MODELING ENVIRONMENTS
Tünger, Çetin
M.F.A., Department of Interior Architecture and Environmental Design Supervisor: Assist. Prof. Dr. Şule Taşlı Pektaş
July 2014
Digital design area has been constantly developed by scientific studies, but it is observed that studies in this area have mostly focused on the technical aspects of the subject (i.e. development of new tools and courses). User, tool, and process are three fundamental elements of a digital design system, so there is a need for studies on users and processes as well as tools. This study was carried out to understand and compare the cognitive behaviors of designers in conventional geometry-based and parametric 3D modeling environments within the framework mentioned above.
While the geometry-based modeling tools are based on creation and the modification of the geometry, parametric modeling environments include an algorithmic structure underlying the form generation process. The study utilized Rhino as a geometric tool and Grasshopper as a parametric 3D tool. Six design students participated in the study. The data was collected by protocol analysis method and analyzed with a content-oriented coding scheme developed in this study. Results indicated that the cognitive actions of designers were significantly different in geometric and parametric modeling environments.
Keywords: 3D modeling environments, parametric design, geometry-based design,
ÖZET
TASARIMCILARIN GEOMETRİ-ESASLI VE PARAMETRİK ÜÇ BOYUTLU MODELLEME ORTAMLARINDAKİ BİLİŞSEL AKTİVİTELERİNİN KARŞILAŞTIRILMASI
Tünger, Çetin
Yüksek Lisans, İç Mimarlık ve Çevre Tasarımı Bölümü Tez Yöneticisi: Yrd. Doç. Dr. Şule Taşlı Pektaş
Temmuz 2014
Sayısal tasarım alanı bilimsel çalışmalarla sürekli gelişmekle birlikte, bu alandaki çalışmaların daha çok konunun teknik yönlerine (yeni araç ve ders geliştirme gibi) odaklandığı görülmektedir. Kullanıcı, araç ve sürecin bir sayısal tasarım sisteminin asal unsurları olduğu düşünüldüğünde, araç kadar kullanıcı ve süreç üzerine çalışmalara da gereksinim duyulduğu anlaşılır. Bu çalışma, bahsedilen çerçeve içinde kullanıcıların geleneksel ve parametrik üç boyutlu modelleme araçlarındaki bilişsel davranışlarını anlamak ve karşılaştırmak amacıyla gerçekleştirilmiştir.
Geometri-esaslı modelleme araçları yarat ve değiştir mantığını temel alan modelleme ortamları iken, parametrik araçlar form yaratma sürecinin altında yatan bir algoritmik yapıyı da içeren modelleme ortamlarıdır. Bu çalışmada, geometrik ortam olarak Rhino, parametrik ortam olarak da Grasshopper kullanılmıştır. Çalışmaya altı öğrenci katılmış, protokol analizi yöntemi ile toplanan veriler bu çalışmada geliştirilen içerik-esaslı bir kodlama şeması kullanılarak analiz edilmiştir. Analiz sonucunda, tasarımcıların geometrik ve parametrik modelleme ortamlarındaki bilişsel aktiviteleri arasında önemli farklar tespit edilmiştir.
Anahtar Kelimeler: üç boyutlu modelleme araçları, parametrik tasarım,
geometri-esaslı tasarım, protokol analizi yöntemi, tasarımda bilişim, insan-bilgisayar etkileşimi
ACKNOWLEDGEMENTS
At first, I would like to thank to my supervisor Assist. Prof. Dr. Şule Taşlı Pektaş for her invaluable support and endless patience. She always encouraged me and guided me sincerely to gain a dual perspective on the concepts of both geometric and
parametric thinking. I am grateful to her for providing me with the essential software and hardware, and the experiment location.
I also would like to express my thanks to my thesis committee members, Assistant Prof. Dr. Yasemin Afacan and Visiting Assistant Prof. Dr. Necmiye Yaprak Savut, who allocated time to read my thesis and made invaluable comments.
I would like to thank to 2012-2013 Fall Semester Section 1-ADA 134 students at the Department of Interior Architecture and Environmental Design, Bilkent University. Although thinking parametrically was a challenging issue for them, their effort was priceless. Six students among them, who participated in my experiment, were Elif Erdemir, Sezen Özmen, Ecem Kürk, Gül Ağaoğlu, Beren Seymen, and Ceren Karacanoğlu. I especially want to express my thanks to them to spare their valuable time for the phases of the experiment and the retrospective data collection. This study would not be completed without their voluntariness.
Finally, I am grateful to my family members. Their patience, love and support from the very beginning until the completion of my thesis were one of my biggest
encouragements. Also, I would thank to our new family member, Eylül Çelmen, for her priceless smiles.
TABLE OF CONTENTS
ABSTRACT ... iii
ÖZET ... iv
ACKNOWLEDGEMENTS ... v
TABLE OF CONTENTS ... vii
LIST OF TABLES ... x
LIST OF FIGURES ... xi
CHAPTER I: INTRODUCTION ... 1
1.1 Problem Statement ... 1
1.2 Thesis Objectives ... 3
1.3. Structure of the Thesis ... 3
CHAPTER II: DIGITAL DESIGN MEDIA ... 6
2.1 Traditional Geometry-Based 3D Modeling Environments ... 8
2.2 Parametric 3D Modeling Environments ... 11
2.2.1 Background of Parametric Modeling ... 12
2.2.2 Design Steps in PDEs ... 13
2.2.3 Types of PDEs ... 16
2.2.3.1 Textual Scripting PDEs ... 16
CHAPTER III: PROTOCOL ANALYSIS ... 22
3.1 Stages of Protocol Analysis ... 24
3.1.1 Data Collection... 24
3.1.1.1 Verbalization ... 24
3.1.1.1.1 Think-Aloud (Concurrent) Method ... 25
3.1.1.1.2 Retrospective Method ... 26
3.1.2 Data Analysis ... 27
3.1.2.1 Transcription ... 27
3.1.2.2 Segmentation ... 28
3.1.2.3 Coding Schemes and Coding the Segments ... 29
3.1.2.3.1 Process-Oriented Coding Schemes ... 29
3.1.2.3.2 Content-Oriented Coding Schemes ... 31
3.2 Protocol Studies on Parametric Design ... 33
CHAPTER IV: METHODOLOGY ... 34
4.1 Participants and Research Setting ... 34
4.2 Procedures ... 36 4.2.1 Training Period... 36 4.2.2 Pilot Study ... 36 4.2.3 Experiment ... 37 4.2.4 Data Collection... 42 4.2.5 Data Analysis ... 42 4.2.5.1 Transcription ... 42
4.2.5.3 Coding and coding scheme ... 44
CHAPTER V: RESULTS ... 51
5.1 Results Related to the Segmentation Categories ... 52
5.2 Time Spent and Action Density throughout the Process ... 54
5.3 Results Related to Cognitive Actions ... 60
5.3.1 Distribution of the Action Categories ... 60
5.3.2 Distribution of the Action Sub-categories... 62
5.3.3 Distribution of the Individual Actions ... 66
5.3.4 Distribution of the Actions According to Geometric and Algorithmic Spaces ... 72
CHAPTER VI: DISCUSSION & CONCLUSIONS ... 79
6.1 Observations on the Design Processes in the GME and the PDE ... 79
6.2 Observations on the Cognitive Actions in the GME and the PDE ... 80
6.2.1 Physical Actions ... 80
6.2.2 Perceptual Actions ... 81
6.2.3 Conceptual and Functional Actions ... 81
6.3 Learning Effect... 83
6.4 Conclusions ... 83
LIST OF TABLES
Table 1: Research setting ... 38
Table 2: An example of segmented protocols (Subject 4, Session G1) ... 44
Table 3: Coding scheme ... 46
Table 4: A partial example of the coded segments ... 50
Table 5: Time spent, number of actions and action density in the modeling environments ... 54
Table 6: Percentage distribution of action categories in GME and PDE according to individual design sessions ... 61
Table 7: Comparison of action categories in GME and PDE ... 61
Table 8: Percentage distribution of action sub-categories in GME and PDE according to individual design sessions ... 64
Table 9: Comparison of action sub-categories in GME and PDE ... 65
Table 10: Percentage distribution of the geometry-based actions at physical and perceptual level in GME and PDE according to individual design sessions ... 75
Table 11: Comparison of geometry-based actions at physical and perceptual level in GME and PDE ... 76
LIST OF FIGURES
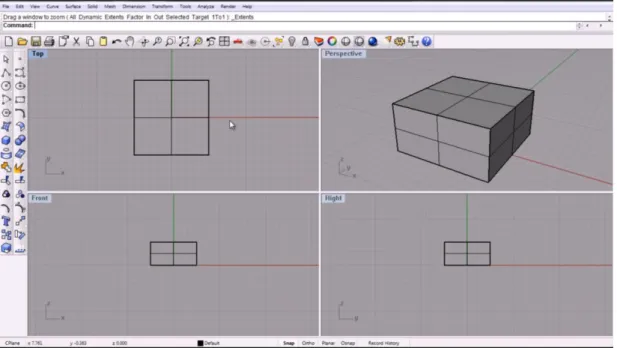
Figure 1: Rhino interface as an example of a traditional geometry-based 3D
modeling environment ... 9
Figure 2: Design spaces in PDEs ... 11
Figure 3: A screenshot from Rhinoscript as an example of textual scripting PDEs .. 17
Figure 4: Grasshopper interface as an example of visual scripting PDEs ... 19
Figure 5: A family of parameters displaying the relations ... 21
Figure 6: Stages of protocol analysis ... 24
Figure 7: Short term memory model ... 25
Figure 8: Long term memory model ... 26
Figure 9: A process-oriented coding scheme ... 30
Figure 10: Process-based categories of the FBS model ... 30
Figure 11: A content-oriented coding scheme ... 32
Figure 12: Design Problem 1 ... 40
Figure 13: Design Problem 2 ... 41
Figure 14: Total number of segments in R1-G2-R3 sessions (a) and G1-R2-G3 sessions (b) ... 53
Figure 15: Total time spent in minutes in R1-G2-R3 sessions (a) and G1-R2-G3 sessions (b) ... 55
Figure 16: Total frequency of actions in R1-G2-R3 sessions (a) and G1-R2-G3 sessions (b) ... 57
Figure 17: Action/minute ratio in R1-G2-R3 sessions (a) and G1-R2-G3 sessions (b) ... 59 Figure 18: Categories of the coding scheme ... 60 Figure 19: Distribution of action categories throughout the process ... 62 Figure 20: Distribution of physical and perceptual sub-category actions in the
process ... 63 Figure 21: Distribution of create geometry action (D_Cg) in R1-G2-R3 sessions (a)
and G1-R2-G3 sessions (b) ... 67 Figure 22: Distribution of modify geometry actions (D_Mg) in R1-G2-R3 sessions
(a) and G1-R2-G3 sessions (b) ... 68 Figure 23: Distribution of delete geometry actions (D_Dg) in R1-G2-R3 sessions (a)
and G1-R2-G3 sessions (b) ... 69 Figure 24: Distribution of view geometry actions (P_Vg) in R1-G2-R3 sessions (a)
and G1-R2-G3 sessions (b) ... 70 Figure 25: Distribution of goal actions (C_G) in R1-G2-R3 sessions (a) and
G1-R2-G3 sessions (b) ... 71 Figure 26: Distribution of the geometric and algorithmic space actions ... 72 Figure 27: Distribution of physical and perceptual actions according to the geometric
and algorithmic spaces ... 73 Figure 28: Distribution of physical sub-categories according to geometric and
algorithmic spaces ... 74 Figure 29: Distribution of perceptual sub-categories according to the geometric and
CHAPTER I
INTRODUCTION
Digital Design Media has become an integral part of the design process, by which many disciplines design and produce their products. However, today, there is a great variety of modeling environments and almost each tool serves for a different way of designing. Thus, understanding the structure of these tools and how these
environments affect the cognitive behaviors of designers are important issues. However, a review of related literature reveals that these issues have not been explored and exhibited, yet.
This thesis aims to alleviate the problem by an experimental study. This chapter introduces the research problems, purposes of the study, and the structure of the thesis.
1.1 Problem Statement
The effects of the developments in the computer science have been felt in the Computer Aided Design (CAD) for many years. Design communities have already accepted the advantages of computational modeling tools in architecture. At the present time, CAD industry offers a great number of modeling environments to designers.
Among architects, the most commonly used modeling tools are the traditional geometry-based modeling environments like AutoCAD and 3Ds Max (Autodesk). The structure of these environments depends on the creation and modification of geometry (Hemmerling & Tiggemann, 2011). On the other hand, parametric modeling environments have become a new trend among designers in recent years. An interview conducted five years ago stated that Grasshopper (Robert McNeel & Associates), one of the parametric modeling tools, was downloaded by
approximately 12.000 users, and this number boosted to 130.000 registered users until 2013 (AEC Magazine, 2009). The structure of these modeling environments depends on designing parametrically. Its users engage with the algorithmic thinking and have the opportunity to create their own rules behind the geometry (Dino, 2012).
Today, architectural offices and schools are utilizing both modeling environments and designers are modeling their projects in geometric and/or parametric modeling environments. However, as mentioned before, there is a research gap in the
differences between these two modeling environments in terms of cognitive behaviors of designers.
The present study attempts to fill this gap by comparing the cognitive behaviors of designers in two environments through protocol analysis. This method aims to capture the verbalization of designers’ mental processes and has been applied to many studies that elicited how designers design. Collecting the data by retrospective method and analyzing the collected data through a content oriented coding scheme may reveal the answers of the following research questions:
1. What are the cognitive behaviors of designers while designing in the traditional geometry-based and parametric 3D modeling environments?
2. Is there any difference between the cognitive behaviors of designers in the traditional geometry-based and parametric 3D modeling environments?
1.2 Thesis Objectives
The essential concern of this thesis is to reveal the cognitive behaviors of designers comprehensively in order to answer the research questions specified above.
However, answers to these questions are also provided through several consecutive objectives listed below:
1. Providing insights into the geometry-based and parametric 3D modeling environments in order to understand their structure and operation
2. Studying the analysis methods that reveal the design processes of designers 3. Devising a content-oriented coding scheme, which allow for encoding the possible actions in both geometric and parametric 3D modeling environments
4. Specifying the differences of design processes with both modeling tools
5. Comparing and discussing the results in order to understand how modeling tools affect users’ way of designing
6. Suggesting further research on the topic
1.3. Structure of the Thesis
Chapter 2 describes the background of digital media. Two different modeling environments are discussed: the traditional geometry-based 3D modeling
environments (GMEs) and parametric 3D design environments (PDEs), respectively. The structure and operation of both types are defined. Additionally, the author of this thesis defines the design steps and two types of this tool: textual scripting PDEs (1) and visual scripting PDEs (2).
Section 3 examines the protocol analysis method. The background and the stages of the method are described before a review of protocol studies on parametric design. The stages of the protocol analysis are divided into two: data collection and data analysis. In the data collection section, two different verbalization methods are mentioned: the think-aloud (concurrent) and the retrospective method. In the data analysis section, its consecutive stages are explained as follows: transcription,
segmentation, coding scheme and coding the segments. Finally, process-oriented and content-oriented coding schemes are addressed.
Chapter 4 specifies the methodology of the thesis. At first, the methods of selecting the participants and research setting are mentioned. Then procedures of the
methodology are discussed. Procedures are divided into five phases and presented in the following order: training period, pilot study, experiment, data collection, and data analysis.
Chapter 5 evaluates the results of the analyses. The results are mainly explained under two topics: the segmentation categories and the cognitive actions. The latter consists of five sub-headings: time spent and action density throughout the process
(1), distribution of action categories (2), action sub-categories (3), individual actions (4), and actions according to geometric and algorithmic spaces (5).
Chapter 6 concludes the results of the previous section and presents the limitations of the study and the suggestions for further research.
CHAPTER II
DIGITAL DESIGN MEDIA
Digital design, also called Computer Aided Design (CAD), is the use of computer systems to design objects. In 1963, the first CAD environment named “Sketchpad” initiated the visual interface used in today’s CAD programs (Davis, 2013).
Sketchpad enabled 2D vector-based drafting and due to its high costs of hardware, it was firstly used in large fields aerospace and automotive industries. Ivan Sutherland, the inventor of Sketchpad, emphasized the importance of CAD and his product and stated that “For highly repetitive drawings or drawings where accuracy is required, Sketchpad is sufficiently faster than conventional techniques” (Sutherland qtd. in Wikipedia, 2014).
In 1980s, first personal computers were produced and their hardware and software were fundamentally enhanced for intensive tasks as opposed to their relatively lower costs (CADAZZ, 2004). As a result of these developments, computers enabled three-dimensional (3D) digital design and the use of CAD has expanded to several
industries including architecture. Frank O. Gehry was one of the pioneers as an architect, who attempted to benefit from designing digitally with Computer Aided Three-Dimensional Interactive Architecture (CATIA) (Alvarado & Munoz, 2012).
Digital Design Media has had a fast pace of development and 1990s were the decade of a new concept in CAD by which 3D objects were assigned with parameters. In 1988, Parametric Technology Corporation released Pro/Engineer, a software package that enables object-oriented and feature-based modeling (CADAZZ, 2004). This feature, hereby, enabled engineers to engage with non-graphical information and play with the parameters of pre-defined algorithms of objects. Through the last decade, parametric modeling tools have been developed and offered to architects so as to create and encode their own rules of their designs.
As it is understood from the development of CAD, today, several digital modeling environments, which differ in their usage according to design aims, are available for architects. The variety of software applications in digital modeling facilitates
designers to deal with more specific design issues. Effort on specific tasks rather than the whole problem helps to generate more detailed and accurate solutions. For
instance, engineers may use performance-based tools for the calculation of needed durability and test the result of their model considering the parameters assigned (Turrin, von Buelow, & Stouffs, 2011). Besides, architects may benefit from
Building Information Modeling (BIM) tools in order to manage the approximate time and cost in their projects efficiently (Vios & Ramilo, 2013).
3D digital modeling tools can be grouped under two modeling environments in general: the geometry-based 3D and parametric 3D modeling environments. This thesis explores and compares the cognitive behaviors of designers in these two different 3D modeling environments. Therefore, their features are discussed respectively in the following sections.
2.1 Traditional Geometry-Based 3D Modeling Environments
The shift from conventional hand drawing to computer aided drafting in architecture provided several advantages for architects and designers. Different level of detailing by zooming in and out, saving the document for future use and flexibility in editing provided convenience in contrast to conventional hand drawings. GMEs enabled designers to complete geometric descriptions and to calculate design proposals in detail. The book titled “Digital Design Manual” by Hemmerling and Tiggeman provides extensive information on the structure and features of GMEs (2011).
In the traditional GMEs, geometry is the basis of modeling process. While performing a task in these tools, the design knowledge of architects relates to processing of both geometric knowledge and design principles. Repetition of creating and modifying actions defines the construction of the final solution. These environments include a space/a 3D canvas where all the geometric creations and modifications are visible (Figure 1).
The canvas allows designers to visualize their geometric proposals and users have the possibility to change the angle of view. GMEs offer users two options of displays: two-dimensional (2D) and three–dimensional (3D). The former has a variety of angles such as top, bottom, left, right etc., while the latter has the options as; axonometric or perspective. While two-dimensional view may serve for
alignment of objects, three-dimensional view may mostly serve as the visualization of the geometry. In addition, viewing tools facilitate for perceiving the geometry and checking its consistency.
Figure 1: Rhino interface as an example of a traditional geometry-based 3D modeling environment
(O'Hern, 2011)
According to the task, and the level of detail, representation of the model may be a wireframe, surface or solid. A wireframe model depicts 3D objects as lines. In 3D view, the use of wireframe mode may reduce the ease of visibility for models including a high number of objects. A surface model defines the geometry with its surfaces. This type of visualization may be well suited for free-form geometries because of flexibility of editing. Finally, a solid model is the most comprehensive mode for the representation of geometric data. A solid model includes the
information about volume, surface and the boundaries of the objects.
Creation of geometries in 3D modeling tools depends on primitives (solids) and surfaces. Primitives are the simple three-dimensional bodies such as cube, cylinder,
torus etc. They are built in the software packages that resolve the necessity to recreate these geometries. Primitive geometries are essential to architectural design as Le Corbusier stated “their image is distinct and tangible with us” (qtd. in
Hemmerling & Tiggemann, 2011). Editing tools of the solid geometries are Boolean operations and associative manipulating. The former relates to conjunction,
disjunction, or negation of overlapping solids. The latter concept concerns with dynamic modification affecting the overall shape such as twisting, bending or stretching a point, edge, or surface of a geometry.
There are two major methods for the creation of surfaces: classic surface types and free-from surfaces. The former is constructed by moving a two-dimensional primitive form along a defined path. The latter is characterized by homogenous surfaces with soft transitions. Free form surfaces offer more flexibility in contrast to classic surface types while creating and processing. Editing the surfaces includes the methods: split and trim, fillet and chamfer. In addition, surfaces provide control points for editing.
Although there are several software packages of geometry-based modeling tools, they offer similar structures and functionalities to the user. Some examples of GMEs are AutoCAD, 3Ds Max, Maya, Revit (Autodesk), SketchUp (Google-Last
Software), and Rhinoceros (McNeel). This study used Rhino (version 5.0), also called as Rhinoceros, as the geometric three-dimensional modeling tool.
2.2 Parametric 3D Modeling Environments
Relational thinking is the basis for designing parametrically. Parametric 3D modeling environments are the tools in which relations between parameters are constructed. The structure of parametric modeling tools makes possible to focus on the dependencies between design components. Generating associative solutions according to the intention of the designer is a strong feature and supports the customization of relations throughout the design.
While GMEs strictly limits users because of their built-in algorithms, parametric software packages have the advantage of user-assigned relations. Actually, this new way of designing requires a different type of thinking. Users, who prefer to think parametrically, deal also with non-visual and qualitative process of relational design, which depends on algorithms (Figure 2). This is why parametric modeling tools are also named as algorithmic editors.
Figure 2: Design spaces in PDEs
(adapted from Yu, Gero, & Gu, 2013)
An algorithm is “a process or set of rules to be followed in calculations or other problem-solving operations, especially by a computer” (Oxford Dictionaries, 2014a).
An algorithmic design process includes definition and manipulation of parameters and rules. The term “parameter” is defined as “a limit that controls the way that you can do something” (Cambridge Dictionaries, 2014b). Oxford Dictionaries state the meaning of parameter as “a quantity whose value is selected for the particular circumstances and in relation to which other variable quantities may be expressed” (Oxford Dictionaries, 2014b). While the former definition emphasizes the existence of a constraint, the latter refers to a relation. In other words, parameters have an interdependent and associative structure among themselves that generate the rules. Adoption of these concepts into CAD industry led to the development of PDEs and the term “computational design” gained interest to define this way of working.
2.2.1 Background of Parametric Modeling
Parametric modeling environments, which became popular within the last decade, are relatively new for architects. However, relational thinking is a longstanding concept and its use in architecture has expanded in time.
Humans have been in a continuous discovery since their presence. They have been seeking for rationality behind the things in their environments (The American Institute of Architects California Council, 2012). A similar approach has been observed in architecture. There were several attempts of incorporating rational relations into architectural projects and one of them was the adoption of golden-ratio to the buildings’ proportions (Britton, 2012).
Additionally, the works of Antoni Gaudi are examples of relational thinking in architecture. The study of Hernandez revealed the associative design in the columns
of the Expiatory Temple of the Sagrada Familia by illustrating the design steps (2006). To model the columns in scale, Gaudi had benefited from plaster as a design tool. Plaster provided him the opportunity for step-by-step design and design
explorations.
However, architects’ desire to build more complex topology tightly integrated into geometry was only achieved by the enhancement of parametric modeling. In spite of the developments in CAD industry, traditional GMEs were inadequate to design parametrically. In the present time, after a great number of updates, PDEs are accepted by many architects and used to structure the topology of their projects (Alvarado & Munoz, 2012; Tramontin, 2008).
Zaha Hadid, Frank Gehry, and Norman Foster have been, recently, the most known examples among many others who explore the possibilities of parametric design in their architectural projects. These architects engage with the inherent structure of PDEs that allows for complex relations and undiscovered forms (MinWu & Ma, 2012). By the help of PDEs, they designed and constructed unique and exciting buildings such as Heydar Aliyev Cultural Center (Zaha Hadid), Disney Concert Hall (Frank Gehry), and The Gherkin (Norman Foster).
2.2.2 Design Steps in PDEs
The associative architecture of PDEs is largely based on algorithms, which consist of parameters and rules. The dependency among design components offers the most outstanding feature of PDEs: variational design (Monedero, 2000). A PDE enables the exploration of forms around the initial shape while preserving the relations of
parameters. Harding et al. (2013) claims that generating varieties during the design process requires several steps in a top-down way. However, there is no established process model yet, but through examining the precedents that are the case studies of relational modeling (Alvarado & Munoz, 2012; Tramontin, 2008), the phases of parametric design can be described as below:
1. Defining the constraints 2. Capturing the relations
3. Modeling the geometry (initial shape) 4. Generating the forms (exploration) 5. Testing the end model
The first phase in PDEs is to generate design proposals in a top-down way. According to the needs, the designer may firstly begin to model by defining the constraints of the design object. A constraint is “something that controls what you do by keeping you within particular limits” (Cambridge Dictionaries, 2014a). Assigning the limitations probably reveals the boundaries of the model in terms of form. In addition to constraints, connection of parameters (capturing the relations) also defines how form will appear. Both modeling the constraints and their relations are the concepts of the early design phase and they determine the evolution of design.
The range of geometric variations closely correlates with the flexibility of limitations (Dino, 2012; Monedero, 2000). If the user designs complex relations that work as constraints, then it might be a problem for slight changes as needed. Also, in PDEs, users have the potential for creating the same geometry through different algorithms
(Barrios Hernandez, 2006). For example, a rectangle might be generated by either a rectangle command or joining different lines according to intention that how design will evolve while considering the technical knowledge of PDEs. Therefore, the way of constructing the algorithmic data is a milestone. Defining the relations and
constraints of the data are closely interrelated within what manner the form might be modified. Consequently, PDEs allow users to specify the amount of change while considering the structure of constraints.
After the determination of limitations and their relations, the initial object can be started to build in a PDE. While this phase generates the geometry by considering the algorithms assigned, it may work as a temporary phase that prepares the model to the next step: generation of the alternative forms.
The last phase, generating forms, equals to the exploration process. The methodology of conventional CAD tools does not satisfactorily support design exploration. GMEs in the market represent the final image of the design and hide the theory behind the geometry (Schnabel, 2007). On the other hand, in PDEs, the user explores for the variations of the initial form and chooses the most appropriate solution from the alternatives after designing the relations and the amount of constraints (Dino, 2012; Lee, Gu, Jupp, & Sherratt, 2012; Lee, Gu, Ostwald, & Jupp, 2013a; Turrin et al., 2011). Therefore, exploring the possible outcomes in PDEs minimizes the effort required for repetitive tasks while GMEs depends on erasing and regenerating the elements (Holland, n.d.). In addition to these, in GMEs, designers use the design knowledge and skills experienced in the design studios and they attempt to visualize the model in their mind. However, in PDEs, designers may generate unimagined
outcomes beyond the boundaries of their skills (Schnabel, 2007). Then, they adopt the best solution from the alternatives. This is why PDEs are called as “generative design tools” in real terms rather than being “a representation tool”.
Moreover, the interdependent data behind the end product might be enhanced for more complicated problems. An architect may want to test the load capacity of a column and after encoding the specific parameters, s/he might be able to calculate and simulate the expected scene. However, the performing capability of parametric modeling tools is not within the scope of this thesis.
2.2.3 Types of PDEs
The architecture of PDEs mainly depends on scripting. At the present time, parametric modeling software packages can be divided into two in terms of their methods of scripting: textual and visual (Dino, 2012). The difference between the types of scripting changes the way of structuring the algorithms.
2.2.3.1 Textual Scripting PDEs
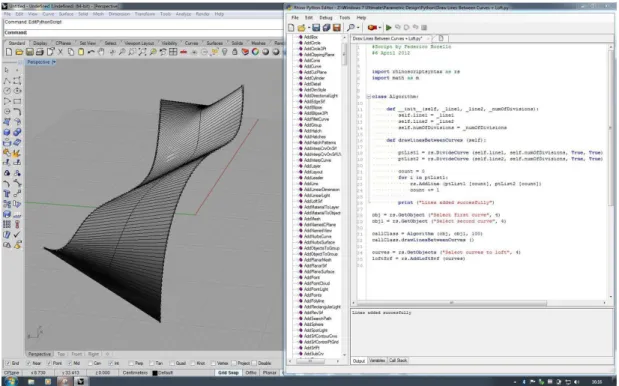
Both textual scripting parametric tools and visual scripting PDEs have two spaces. While one of the spaces exhibits the geometry (analog window), the other one represents the family of relations behind the geometry (symbolic window) (Monedero, 2000). However, the algorithm window of a textual scripting PDE is called a “textual script editor” and makes designers deal with a pre-defined coding system such as Microsoft's VBScript language, or Java language (Figure 3) (Yu, Gu, & Ostwald, 2013). Rhinoscript© from Robert McNeel & Associates, Generative Components© from Bentley and Mayascript© from Autodesk are some examples for
textual scripting PDEs. In these environments, algorithms are generated by pre-defined commands according to the language type of the software.
Figure 3: A screenshot from Rhinoscript as an example of textual scripting PDEs
(Designreform, 2010)
In addition to these, modifications of parameters in textual scripting PDEs require re-entering the commands into the algorithm editor. Therefore, the iterative process might reduce the practicality of generating and exploring alternatives. Besides, because of its textual structure, following the relations among design components is difficult and that may cause to get lost in parameters while designing the algorithms.
Therefore, there is an argument that textual scripting PDEs may not properly support architects, while designing parameters and rules. The discussion is worth to pay
text-based parametric tools force architects to spend time on learning textual scripting languages and may lead to a decrease in the efficiency of PDEs (Çinici, Akipek, & Yazar, 2008).
2.2.3.2 Visual Scripting PDEs
Parametric modeling software packages supporting visual scripting have similar working principles with the textual scripting PDEs. The difference between them is the structure of the algorithm editor. Visual scripting PDEs offer geometry-based and algorithm-based spaces like textual scripting PDEs do. However, the visual nature of algorithm editor in the former provides several advantages, especially for architects, in contrast to textual encoding editors.
PDEs integrated with visual scripting are called “graphical algorithm editors” and they include all the parameters and the relational structure of them that are created and modified visually (Figure 4). This way of algorithm editing provides a user-friendly modeling environment to architects and designers because graphical editors require no knowledge of advanced programming or scripting languages. Therefore, users dealing with visual issues may save more time to focus on their work rather than struggling with encoding the languages.
Figure 4: Grasshopper interface as an example of visual scripting PDEs
(Sun, 2012)
Furthermore, visual scripting PDEs enable data mapping. A graphical algorithm editor displays the visual components and exhibits their connections with each other. This feature eases the management of the relations throughout the design process. When a parameter is visually scripted onto the symbolic window, its correspondence in the geometry is instantly recomputed on the analog window (Dino, 2012). This dual control in visual scripting PDEs supports architects to enhance their design bidirectionally. Users are able to visualize both the geometry and the rules assigned by them.
Grasshopper from McNeel and Dynamo from Autodesk are some examples for visual scripting PDEs. Today, Grasshopper is the most popular PDE integrated with a graphical algorithm editor and used by many architects (AEC Magazine, 2009). Thus, the author of this thesis used Grasshopper in the experiment phase as the PDE.
Grasshopper is a plug-in of Rhino and has a graphical algorithm editor that
represents the parameters and the rules visually. The definition space is totally based on components that include variable number of parameters. Components are
generated by being dropped onto the “definition canvas” and dragged to locate them on the desired location (Wikipedia, 2013). There are mainly three types of
components in Grasshopper: linguistic, numerical and graphical. Linguistic
components are nominal variables such as the form of the geometry (rectangle, circle etc.) or its axis in the modeling space (x, y, z). A numerical component represents the quantitative data and specifies the dimensions and the limitations of other
parameters. The last one, graphical components enable the modification of the
geometry via manipulating the graph (types of polygons or color-based components).
The structures of components consist of inputs and outputs. Each component has a variable number of inputs (at the left side) and outputs (at the right side). When an output parameter of a component is linked to an input parameter of another
component, it provides a relation between them. The relations among parameters are generated through a node-based system and that displays the rules at the same time.
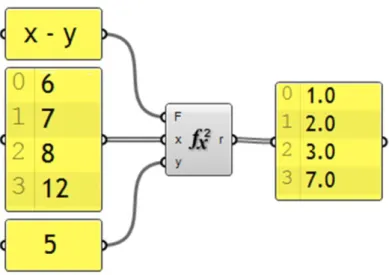
An example might provide a better understanding of how parameters and rules are operated in Grasshopper. Figure 5 illustrates a family of parameters and their dependencies by using a simple mathematical equation. There are numerical inputs that are connected to x and y and these constant numerical parameters are linked to a qualitative constraint that progresses the operation: x-y and produces four outputs. The component highlighted in gray illustrates the qualitative inputs (f (x²)={f, x, y, r}
x=6,7,8,12, y= 5), outputs (1,2,3,7) and a linguistic constraint (f (x²)={f, x, y, r} and f=(x-y=r)).
Figure 5: A family of parameters displaying the relations
CHAPTER III
PROTOCOL ANALYSIS
Protocol analysis is an empirical and observational research method. It has been utilized to understand how humans design and mainly aims to discover the cognitive processes or actions of research participants including designers. To reveal the mental process of designers, at first, their verbal reports are collected from the recordings of participants’ behaviors and then verbal data is analyzed through a coding procedure (Hughes & Parkes, 2003). Today, protocol analysis is widely acknowledged as a valid research method in design community and it has been applied to several disciplines such as industrial design, engineering design, architecture and interior architecture (Jiang, 2009).
At the first half of the 20th century, protocol analysis was developed in psychological research and psychologists who wanted to elicit the cognitive actions used the
introspection method. Van Someren et al. states (1994, p. 29) “Introspection is based on the idea that one can observe events that take place in consciousness, more or less as one can observe events in the outside world”. The reason behind the idea was that psychologists were educated well to observe others and they had the ability to interpret what others think at that moment (van Someren et al., 1994). However, guessing one’s cognitive actions could not be a reliable study and it was almost
impossible to repeat the experiment. Therefore, it could not be an empirical method for revealing the cognitive behaviors of designers.
In 1980s, software engineers engaged with developing programs for computers at an expert level of performance (as cited in Hughes & Parkes, 2003). Therefore,
engineers required the knowledge of experts in order to generate and encode the artificial intelligence of computers that gave rise to a new way of data collection: verbalization. In other words, knowledge engineers had interviews with experts in order to gather verbal reports at first hand (van Someren et al., 1994). One of the most distinctive characteristics of verbalization was in the way of collecting data that prevents the high possibility of interpretation encountered in the introspection
method.
After about ten years, Ericsson & Simon (1993) studied protocol analysis
considering the reliability of verbal reports and compared the short and long-term memory of humans in the exploration of cognitive activities. Their study was further developed by van Someren et al. (1994) whose research focused on the use of the concurrent protocol technique. Although many researchers benefited from the think-aloud method in their studies, there were still arguments about its convenience (Lloyd, Lawson, & Scott, 1995). These researchers, who criticized the verbalization while performing on a task, gave preference to the retrospective method. At the present time, concurrent and retrospective protocols are regarded as valid research tools in empirical design studies.
3.1 Stages of Protocol Analysis
The protocol analysis method possesses two main procedures, namely and
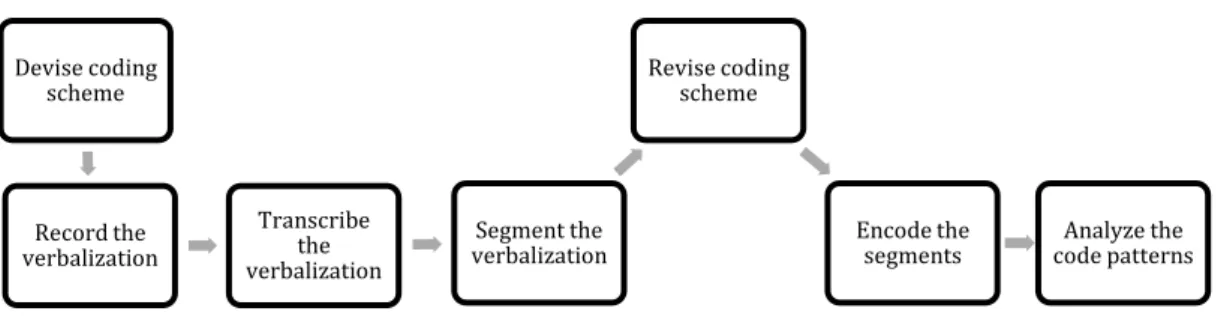
respectively, data collection and data analysis. The former, data collection, is related with gathering verbal data from designers. The latter, data analysis, includes several successive stages: transcribing the verbalization, segmenting the transcription, encoding the segments, and the last, analyzing the coded protocols (Figure 6).
Figure 6: Stages of protocol analysis
Adapted from (Hughes & Parkes, 2003) and utilized in this study.
3.1.1 Data Collection
The first step in protocol analysis is to gather data from the subjects. The acquisition of data in protocol studies has a qualitative nature.
3.1.1.1 Verbalization
There are two methods for data collection in protocol analysis: think-aloud protocol (concurrent) and retrospective protocol. Although each method demands for eliciting subjects’ cognitive behaviors, they differ in the collection and the content of the verbal data. Devise coding scheme Record the verbalization Transcribe the verbalization Segment the verbalization Revise coding scheme Encode the
3.1.1.1.1 Think-Aloud (Concurrent) Method
Concurrent protocol analysis, also named as the think-aloud method, is the collection of the verbal data while a designer is performing a task. In this method, designers are expected to verbalize their thoughts instantly as they were dealing with a design problem. If they keep silent for a period of time, they are prompted to think aloud. The recording of the protocols could be either audio or audio and visual.
Figure 7: Short term memory model
Adapted from (van Someren et al., 1994)
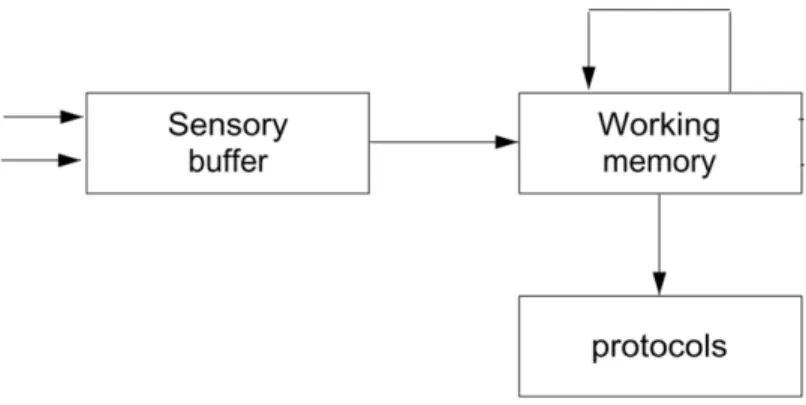
The simultaneous reporting on the cognitive actions relates to short-term memory (STM) as illustrated above (Figure 7). In STM, information flows from sensory buffer into working memory and subjects report the mental process from working memory. Subjects verbalize their cognitive actions after a very limited time during a task performance. The narrow time range between performing a task and its
verbalization prevent the interpretation of design process (Ericsson & Simon, 1993). Therefore, think-aloud protocol is efficient at process-oriented aspects of design (Gero & Tang, 1999) and used in the studies in which the aim was to reveal the design process of subjects (Atman, Cardella, Turns, & Adams, 2005; Atman, Chimka, Bursic, & Nachtmann, 1999).
Although concurrent protocol analysis is applicable for the studies exploring the design processes, it was also discussed that reporting the process while performing a task might need an intensive effort and diminish the concentration of designers (Ericsson & Simon, 1993).
3.1.1.1.2 Retrospective Method
Retrospective protocol analysis is the collection of the verbal data after a designer completes the task. In this method, designers firstly deal with the design problem and this period is recorded visually. Then, designers are asked to report about the design process. In most of the cases, designers watch their records to remember their cognitive activities.
Figure 8: Long term memory model
(van Someren et al., 1994)
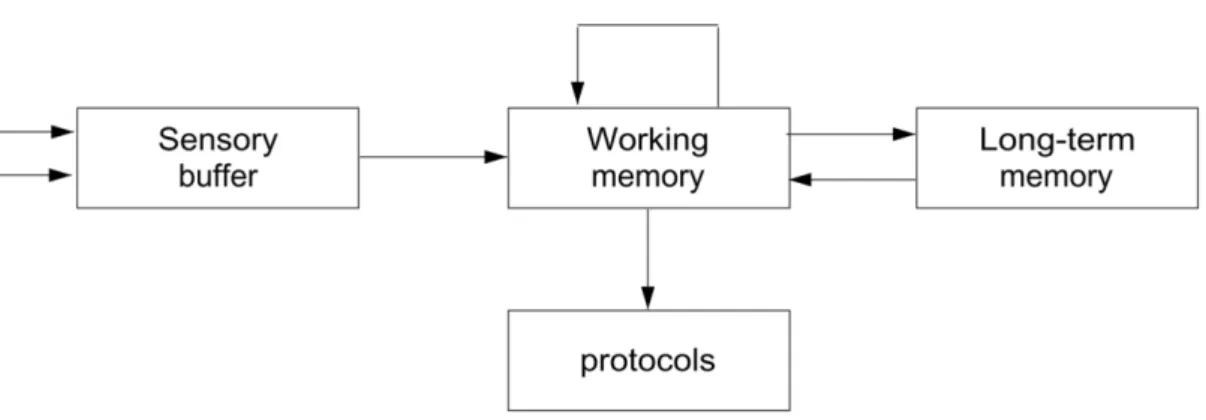
The delayed verbalization of the cognitive actions relates to long-term memory (LTM) as illustrated above (Figure 8). In LTM, information flows from the sensory buffer into the long-term memory and subjects verbalize the mental process from the long-term memory. The remarkable duration between performing a task and its
verbalization might lead to interpretations. Gero & Tang (1999, p. 2) claim that “retrieved data from LTM may have details omitted or may be generated by
reasoning rather than recall”. Due to that reason, retrospective protocol might be an appropriate decision for the content-oriented aspects of the design (Tang & John, 2000). This is why designers are requested to report, “what they are thinking of” and “attending to” during the verbalization stage (Suwa, Purcell, & Gero, 1998; Suwa & Tversky, 1997). Thus, designers are expected to report their cognitive actions rather than the phases of their design processes. The method of retrospection has been applied to many studies that focused on a content-oriented approach (Bilda & Demirkan, 2003; Suwa et al., 1998; Tang & John, 2000).
3.1.2 Data Analysis
For the analysis of collected protocols, several procedures are applied to verbal data. Video or audio-recorded protocols of subjects are transcribed, segmented, encoded, and analyzed (in terms of frequencies, percentages and statistical tests), respectively. These stages enable researchers to obtain quantitative results from the qualitative protocols.
3.1.2.1 Transcription
The earliest phase of data analysis is the transcription of acquired verbal data. Although transcribing does not need an intensive mental effort, it takes long time to hear each word and transfer them into written form. However, recent studies
gathering protocols in English benefited from the certain software packages like NVivo that allows for automated transcription (Lee et al., 2012; Lee et al., 2013a;
Lee, Gu, & Williams, 2013b). Transcribing the reports provides a basis for the next stage, segmentation.
3.1.2.2 Segmentation
The aim of segmentation is to divide the entire protocol into small units. The aggregated units ease the coding of the protocol. There seems to be two ways of dividing a transcript into segments. The first method is to divide the protocol
according to pauses or tones of the voice (Ericsson & Simon, 1993). Either pauses or levels of toning may flag the beginning of a new segment. The latter method entails aggregating the reports according to subject’s intentions. A change in designer’s intention, also named as “design move” by Goldschmit (1991), flags the start of a new episode (Bilda & Demirkan, 2003; Suwa et al., 1998). This may incorporate a change in the content of the actions or the flow of design.
In addition to these, the grain size of the segments may differ according to the type of protocols. A concurrent protocol is based on a process-oriented approach in which timelines have a great significance (Atman et al., 2005, Atman et al., 1999; Gu, Kim, & Maher, 2011; Lee et al., 2013b). Therefore, in the think-aloud protocols, each design step or idea is tightly linked to a specific time and each individual action might become a segment because each action refers to a time range that needs to be coded.
On the other hand, the grain sizes of segments in retrospective protocols are larger in contrast to the segments in the concurrent protocols. A retrospective protocol is based on a content-oriented approach in which the cognitive actions and the
reasoning behind them are emphasized (Suwa et al., 1998). Thus, segments in retrospective protocols are tightly integrated into meaningful episodes and expected to be larger in their size.
3.1.2.3 Coding Schemes and Coding the Segments
A coding scheme is used for quantifying a qualitative data. Devising the content and structure of a coding scheme may vary according to aims of researcher(s). The coding schemes used for describing design activity may be grouped into two in parallel with Doorst and Dijkuhuis’s (1995) model: process-oriented coding schemes and content-oriented coding schemes.
3.1.2.3.1 Process-Oriented Coding Schemes
Process-oriented coding schemes mainly list the categories that are related to process of design. Gero, and McNeill (1997) devised a process-oriented coding scheme and tested its operation for verbal data. Their scheme focuses on level of abstraction aspects of the problem domain (function, behavior, and structure). Atman et al. (1999) applied a process-oriented coding scheme in which categories are specified as process stages (Figure 9).
Figure 9: A process-oriented coding scheme
(Atman et al., 1999)
In this coding scheme, the purpose is to explore the processes among function (F), behavior (B) and structure (S) categories. The process-based sub-categories are shown in Figure 10. In process-oriented protocol studies, the findings can be represented in several ways such as timelines, cumulative time plots, and process time plots (Atman, Deibel, & Borgford-Parnell, 2009; Yu, Gu, et al., 2013).
3.1.2.3.2 Content-Oriented Coding Schemes
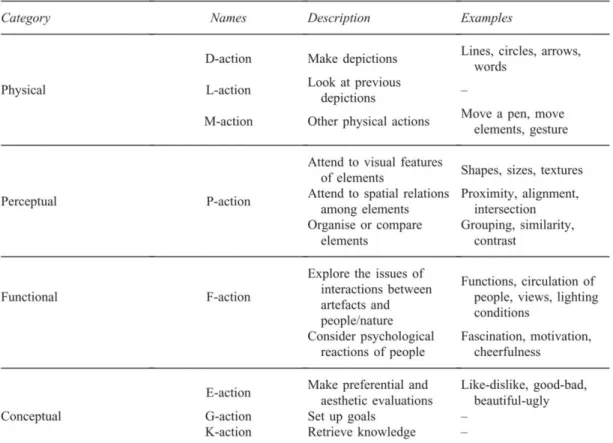
A content-oriented coding scheme concerns with the contents of designers’ actions. The most widely-known content-oriented coding scheme was proposed by Suwa et al (1998). The main idea behind their coding model was the use of the four levels of information processing in human cognition. These levels represent the major categories of their coding scheme. Their study emphasizes that humans process information sensorily, perceptually, functionally, and conceptually (Suwa et al., 1998).
Suwa et al. (1998, p. 459) states “physical actions correspond to sensory level, perceptual actions to perceptual, and both functional and conceptual to semantic” (Figure 11). The four levels of information are dependent to each other and the major categories indicate an order from higher levels to lower levels. The coding scheme involves four main categories, their sub-categories and the actions. There are several researchers who adapted the content-oriented coding scheme of Suwa et al (Bilda & Demirkan, 2003; Lee et al., 2013a).
Figure 11: A content-oriented coding scheme
(Suwa et al., 1998)
The analysis by a content-oriented coding scheme may illustrate the dependencies among the actions and may provide information about which action suggests or trigger the other one. In addition to these, frequencies and percentages may provide insight into the distribution of specific actions in the overall process.
According to the literature, retrospective verbalization might be more appropriate for content-oriented protocol studies (Tang & John, 2000). Thus, this thesis applied the retrospective reporting method for the data collection phase.
3.2 Protocol Studies on Parametric Design
There are only a few studies, which analyzed parametric design using protocol analysis techniques. Lee et al. (2012) evaluated creativity in parametric design through protocol analysis and expert panel assessment. Then, Lee et al. (2013a) looked into the cognitive behaviors of designers while performing a task in PDEs. The study created a link between the cognitive behaviors of designers and their final products. A similar approach was also utilized in the study of Lee et al. (2013b) that explored the creativity in parametric design, and sought for a relation between creativity and problem or solution driven design strategies.
A few studies attempted to compare GMEs and PDEs using protocol analysis. Yu et al.’s (2013) pilot study aimed to reveal the effects of rule algorithm in PDEs. In addition to these, Yu et al, (2013a) & Yu et al. (2013b) compared the cognitive behaviors of designers in both modeling environments. While the former study focused on testing the experimental setting, the latter’s comparison was based on the differences between problem and solution spaces. Both of the studies used the FBS ontology for the comparison of GME and PDE.
The studies, which compared GMEs and PDEs, have not yet reached conclusive results. Moreover, none of the existing studies used a content-oriented coding scheme in their comparison. Therefore, this thesis is the first to compare GMEs and PDEs with a content-oriented approach.
CHAPTER IV
METHODOLOGY
This study compares the students’ cognitive behaviors in traditional-geometry-based and parametric 3D modeling environments utilizing a content-oriented coding scheme. This section of the thesis will focus on the methodology and explain demographics of the participants, research settings, procedures, and data analysis.
4.1 Participants and Research Setting
The case study compares the cognitive behaviors of six novice design students. Protocol analysis usually deals with a small size sample, but it offers an in-depth exploration of the samples and immensely rich data (Yu et al., 2013). Thus, the sample size of the present study is considered to be appropriate.
All of the subjects study in the Department of Interior Architecture and
Environmental Design in Bilkent University, Ankara, Turkey. Choosing the subjects from the same grade, department, and school provides a similar background among the students. None of the subjects had a prior knowledge on CAD. Therefore, they had the same background and experience in CAD environments and this may help to avoid biases in the study.
All of the participants were female and volunteers for the experiment. The ages of the participants ranged from 20 to 22 with a mean of 21, and the standard deviation of their ages was 0,894 years. The experiment location was a computer lab that was equipped with required software/hardware and provided the silence needed while designers were performing their tasks on the computers.
Subjects dealt with two different modeling environments in this study. The geometric 3D modeling tool Rhinoceros (version 5.0), also called Rhino, and the parametric 3D modeling environment Grasshopper were used. There are several reasons for
choosing Grasshopper rather than other parametric modeling tools. First of all, both software packages are the productions of Robert McNeel and Associates. The author of the thesis thought that the similar user interfaces of modeling environments would eliminate the confusion based on different interfaces. Secondly, Grasshopper is a plug-in of Rhino and this integrity allows subjects to open Grasshopper easily through the command window in Rhino. The last and the most significant factor for the use of Grasshopper is its visual scripting structure and as it is specified in the literature, visual PDEs ease the generation and modification of algorithms for architects and designers (Çinici et al., 2008). As a result, the visual nature of Grasshopper may improve the novices’ interaction with the algorithms.
The experiment used two different instruments for recording the modeling process: a software application, CamStudio, and a video recorder. CamStudio, a screenshot video recording software, captured the screens of the designers’ computers. Records of CamStudio were shown to the subjects who were supposed to watch the record
and to tell what they had been thinking and attending to during the process. In this re-call process, a videotape was used to record the retrospective protocols of the subjects.
4.2 Procedures
The study involved training period, pilot study, experiment, and data collection phases, respectively.
4.2.1 Training Period
The first phase involves trainings of the subjects in two modeling environments in seven weeks. Each week students were given a lecture and completed hands-on exercises. Additionally, each week, subjects were assigned various studio works and homework related to lectures in the trainings.
The students initially learned about Rhino through a column design example. Then, they were engaged with Grasshopper through modeling the same column
parametrically. Thus, subjects became aware of the differences in the two modeling environments while building the same model in a geometry-based and a parameter-based approach. In the next step, the same column was associated with a golden ratio algorithm in Grasshopper and this enabled students to realize the rule-based structure in parametric tools.
4.2.2 Pilot Study
Before the actual experiment, novice designers attended to a pilot study. In the pilot study, two different design problems with their specifications were assigned to
students. Design briefs were labored to build similar design problems with a slight difference in their context. To visualize the problem environment, each design brief was enriched with a relative plan.
Students were divided into two groups, which dealt with different modeling
environments. Assignment of modeling tools to the groups was done randomly and was announced just before the study. The subjects were given an hour to complete the first design problem. After an hour, they were allowed to rest in ten minutes and they switched the modeling environment. The pilot study facilitated for checking several issues related to research design such as:
1. adequacy of the time allowed to students 2. complexity of the design problems
3. operability of the research setting (experiment location, software applications, and instruments)
4. appropriateness of the coding scheme
It was found that the time given to students and the complexity of the design problems were appropriate. In terms of the research setting, the only problem was due to CamStudio that captures high quality of screenshots and caused lock-ins of computers due to the insufficient hardware of computers in lab. However, the problem was solved through a decrease in the quality of screenshots.
4.2.3 Experiment
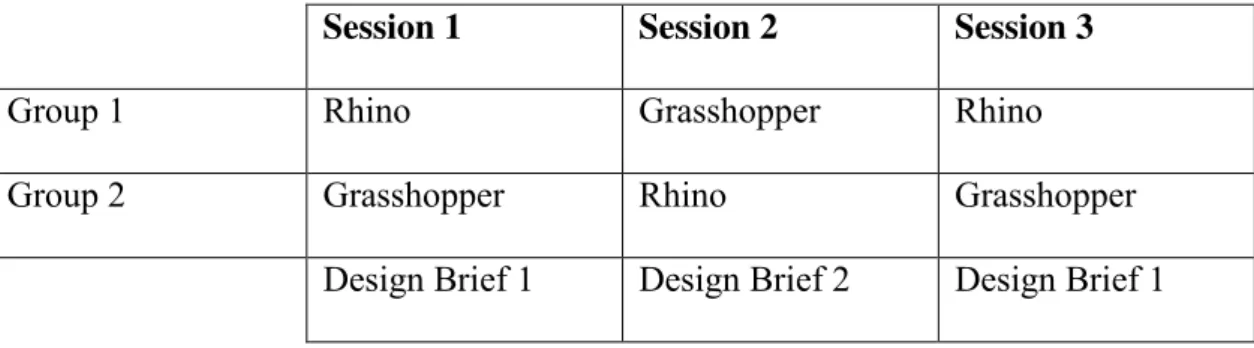
the students were divided into two groups randomly. The first group had the design sessions in Rhino-Grasshopper-Rhino order. The second group had the design
sessions in Grasshopper-Rhino-Grasshopper environment respectively (Table 1). The reason of applying three consecutive design sessions was to test the learning effect and to see whether tools affected learning or not. The table below illustrates the structure of the experiment in terms of sessions, subjects, modeling tools and design briefs.
Table 1: Research setting
Session 1 Session 2 Session 3
Group 1 Rhino Grasshopper Rhino
Group 2 Grasshopper Rhino Grasshopper
Design Brief 1 Design Brief 2 Design Brief 1
First of all, the participants were located in the computer-lab, and their groups and modeling environments were announced. After that, the design briefs were
distributed to the students. When all subjects were ready to model, the students were requested to start CamStudio for screen capturing and then, experiment began. When a subject finished modeling, she was requested to close CamStudio and save her recording. This process was repeated three times and each design session was one hour with a ten-minute break between them, but they were allowed to finish earlier or later on demand.
In the experiment, the subjects were assigned two different design problems in three sessions. Each design brief had a problem definition, its specifications and a plan
including the immediate surrounding of the design area. Two different design
problems were developed for the experiment after the pilot study. Attention was paid to generate two design problems with similar design topology and complexity. Also, problems were considered to be slightly different in terms of function, while,
structurally, they were the same.
Both design problems were located in a shopping mall. The first design problem was to model “a bar table” (Figure 12), and the second one was to design “a coffee table” (Figure 13). Each design brief had a plan including the immediate environment that is surrounded with three stores. The actual design areas for both problems were 4x4 meters squares and were highlighted by different colors on the plan. Some design specifications were also included in the design briefs.
Figure 12: Design Problem 1
Design Problem 1 “Bar Table” Time: 1 hour
You are required to design “an interior bar table in a shopping mall” by considering the specifications below:
1. At the top of the table, there must be a covered surface that serves for the purpose of putting on some stuff such as glass, plate, etc.
2. The bar table must be self-standing and structurally stable itself.
3. You should consider ergonomic requirements of your design and its interaction with users. You will assume that people will use this table while standing.
You should also consider the following qualities of your design solution: - Creativity and novelty
- Technical quality (conformance with brief) - Consistency and integrity (the unity of the model) - Completeness and sophistication
Store 1
Store 2
Store 3 Bar Table Area
4x4 m
Shopping Mall Store Floor
Figure 13: Design Problem 2
Design Problem 2 “Coffee Table” Time: 1 hour
You are required to design “an interior coffee table in a shopping mall” by considering the specifications below:
1. At the top of the table, there must be a covered surface that serves for the purpose of putting on some stuff such as glass, plate, etc.
2. The coffee table must be self-standing and structurally stable itself.
3. You should consider ergonomic requirements of your design and its interaction with users. You will assume that people will use this table while sitting.
You should also consider the following qualities of your design solution: - Creativity and novelty
- Technical quality (conformance with brief) - Consistency and integrity (the unity of the model) - Completeness and sophistication
Store 1
Store 2
Store 3 Coffee Table Area
4x4 m
Shopping Mall Store Floor
4.2.4 Data Collection
After the experiment, the subjects were requested to watch their three screen records successively to recall the activities. They were expected to report “what they were thinking of “and “attending to” (Suwa et al., 1998) in each action. In addition to these, the verbalization process of each student was also recorded on the video for the analysis phase and these processes were repeated for each subject individually.
4.2.5 Data Analysis
Data analysis was the next phase after the collection of verbal data. In the analysis of protocols, there were three consecutive stages: transcription, segmentation, and coding the segments. The analysis phase of the experiment aimed to obtain quantitative findings from linguistic data.
4.2.5.1 Transcription
The experiment involved six students and each student had three design sessions that required transcription of eighteen protocols in total. The verbal records of students were translated to a word document separately. At first, the video records of protocols were copied to an electronic media. Then, each record was listened and transcribed into a document of Microsoft Word simultaneously. Additionally, collection of verbal data was in subjects’ native language, Turkish, in order to prevent the language barrier. No software application supported the automated transcription in Turkish and this is why transcription was handled manually.
4.2.5.2 Segmentation
Segmentation is the division of transcripts into meaningful episodes. This thesis adapted its segmentation method from Suwa et al. (1998). When a designer changed his/her intention, it was perceived as a signal for a new segment. This change was perceived as either the transition between design steps or an instant shift in a design step (Table 2). The first one, transition between design steps, refers to the next design move. For instance, if a designer begins to extrude the surface, after
completed the generation of that surface, it exemplifies a new segment. The second one, an instant shift in a design step, refers to an unexpected decision-making process. For example, if a designer decided to change the direction of extrusion at that moment, it was perceived as a new segment.
Table 2: An example of segmented protocols (Subject 4, Session G1)
Segment Protocol
23 Then I thought of an object on which people rest their foot. Well, you
know, foot rest...on bar tables... I aimed to draw one of them and I took back the loft and the cap.
24 Now, I am creating that circle and I am trying to locate it from the top
view...the place for the foot rest. Yes, they will use it when they stand. I am trying to find that center (of circle) in order to be in the middle (of the existing drawing) but I could not do. Still center...I mean I was trying to locate it at the center. The idea of adding a footrest occurred after I completed the drawing.
25 Now, I am trying to move (the circle) to an appropriate level (elevation)
and I achieved this size by measuring my feet... The height of circle. I was expected to specify it as 20 cm but... 40cm… I probably stopped here. Ha, ok, I was measuring it at that time.
4.2.5.3 Coding and coding scheme
The coding scheme used in this study was based on Suwa et al.’s (1998) study. Suwa et al.’s (1998) coding scheme includes four action categories which correspond to information processing levels in human mind. “The content-oriented approach aims at revealing the contents of what designers see, attend to, think of and retrieve from memory while designing” (Suwa et al., 1998, p. 457). Bilda and Demirkan (2003) used Suwa et al.’s action categories but they revised cognitive actions to compare design activity in traditional vs. digital media. This study combined Suwa et al.’s and Bilda and Demirkan’s coding schemes but revised the result substantially to provide insights into designers’ cognitive actions in GMEs and PDEs. The structure of both modeling environments and the early protocols from the pilot study were considered