9 Determinants of Economic
Growth in
Turkeyl
Sübidey Togan
Rapid, sustained economic growth is one of the main objectives of Turkish policymakers. Because total factor productivity plays a big role in growth, policies that increase education levels, achieve more equitable distribution of income, and secure high rates 01 investment are essential. In addition, prudent macroeconomic policies are needed to avoid balance of payments crises, eliminate industrial incentives that inhibit competition, and further lower nominal and ellective rates of protection.
To better allocate resources and create a more enabling climate for innovation and technical progress, in 1994 Turkey adopted a new com-petition policy modeled on European Union practice. Further liberal-ization of trade should also help achieve growth. In addition, public enterprise performance must improve, barriers to entry and exit of firms should be removed, and privatization should be encouraged. The success of these reforms will depend, to some degree, on regional political developments and international economic developments. Membership in a customs union with the European Union and participation in the General Agreement on Tariffs and Trade (GATT) will also contribute to competition and growth.
During the past forty-five years per capita gross national product (GNP) in Turkey has increased threefold. Although the country remains poor by industrial country standards, it has placed itself among the world's rapidly growing middle-income countries. Still, policymakers are eager to bolster growth, and so are pursuing efTorts to foster competition and trade.
SOURCES OF GROWTH ANALYSIS
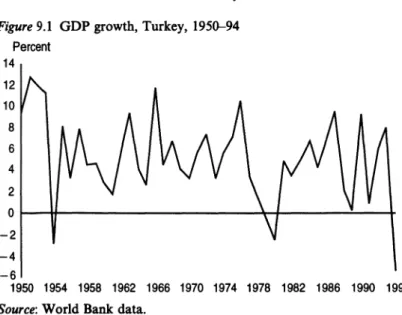
The average annual growth of gross domestic product (GDP) during 1950-94 averaged 5.1 percent, but it has fluctuated considerably,
159
N. Shafik (ed.), Economic Challenges Facing Middle Eastern and North African Countries © Economic Research Forum 1998
Figure 9.1 GDP growth, Turkey, 1950-94 Parcent 14 12 10 8 6 4 2 Or-~~---~~---~---+ -2 -4 -6 1~1~1~1~1~1m1m1m1~1~1~1~~M
SOUTce: World Bank data.
moving between -5.4 and 12.8 percent (Figure 9.1). The variability of GDP measured by the standard deviation was 4.0. The main objective of economic policy in Turkey has been to increase average growth as weIl as narrow its variability.
Economists analyzing the behavior of growth generally consider one of two approaches: growth theories and models and sources of growth analysis. This chapter employs the sources of growth method developed by Jorgenson and Griliches (1967), which is an accounting identity. As such the analysis is grounded in national accounts and aggregate production function theory. The basic formula of the' sources of growth method states that the rate of output (GDP) is equal to the rate of growth of capital times the capital income share, plus the rate of growth of labor times the labor share, plus total factor productivity change. The various factors affecting economic growth in Turkey are also examined qualitatively.
From State Planning Organization data on capital stock, labor, and gross output (Maraslioglu and Tiktik, 1991, as revised by Maraslio-glu) and shares of capital and labor in value added as weights (Cela-sun, 1986; De Santis and Özhan, 1994), total value added in the economy was calculated for 1978-92. Total value added increased by an average of 4.022 percent a year, with capital contributing 1.619 percentage points, labor 0.712 percentage point, and total factor productivity (TFP) growth 1.691 percentage points. Thus 40.25
per-Sübidey Togan 161 cent of the average growth rate is explained by capital, 17.70 percent by labor, and 42.05 percent by total factor productivity growth.
These figures refer to aggregate data. Sectoral figures reveal that total factor productivity growth explains more than 60 percent of the growth of value added in agriculture, 59 percent in mining, and 63 percent in manufacturing. The contribution of total factor productiv-ity growth is higher than 80 percent in energy but only 11 percent in services. While the data suggest the importance of total factor pro-ductivity growth, other important contributors to Turkish economic growth include labor force characteristics, the expansion in capacity achieved through investment, technological change, international developments, and the country's economic policies.
Labor force characteristics
About 60 percent of Turkey's 62.5 million people are 15-64 years old. Annual population growth slowed from 2.5 percent during the late 1950s to 2.2 percent during 1985-90. The population is quite young, with a median age of 21. The labor force participation rate (the share of civilian labor force in the population aged 15-64) fell from 75 percent in 1970 to 54 percent in 1993, with the civilian labor force totaling 20.2 million. Unemployment is about 7.6 percent.
Education levels and income distribution are the main factors determining labor productivity in Turkey. Enrollments in primary and secondary schools have increased since the 1970s, when secondary enrollments were substantially lower than the average for middle-income countries. By the 1990s enrollments were stilllower than those of the average middle-income country, but the gap had narrowed substantially (World Bank, various years). A major shortcoming of the education system is its emphasis on general curriculum schools and neglect of technical and vocational schools (OEen, 1993). Total spending for education was just 1.9 percent of GDP in 1988, compared with 2.8 percent in Greece, 3.9 percent in Spain, and 5.0 percent in United States. However, the government recently boosted the share substantially, declaring its commitment to educational attainment.
Education contributes to economic growth through several chan-nels. The most obvious is that educated workers are more productive than uneducated workers. But other factors are important as weIl, as emphasized by Barro (1991) and Hamilton (1995). Regression of the productivity of labor, measured by GDP per unit of labor (GDPIL),
on the aggregate capital-Iabor ratio (KlL) and secondary enrollment rates (SER) over 1978-92 yie1ds the following result:
ln( GDP / L)
=
-0.9495+
0.4350ln(K / L)+
0.6246In(SER)(-8.2855) (2.0911) (5.1182) (9.1)
n
=
15; R2=
0.9536; DW=
1.9736where the terms in parentheses are t-statistics. Thus besides the capital-Iabor ratio a main determinant of labor productivity is human capital proxied by the number of students enrolled in secondary schools relative to the total population of the corresponding age group. (8.1) shows that raising the fraction of children going to secondary school by 10 percentage points can be expected to boost subsequent annual output per unit of labor employed by about 6.2 percent. Empirical studies have shown that the quality of education is also a significant determinant of economic growth. Thus if Turkey to attain rapid, sustainable economic growth it must place a higher value on education. Enrollment in junior high schools could be increased from 50 percent to 60-70 percent by channeling additional funds into the sector and by improving the quality of education in these schools. Restrictive wage policies kept labor unrest and union activity low during the 1980s. But the continuation of peacefullabor relations will depend on achieving relative equality in income distribution. As with most developing countries, distributional data in Turkey are less reli-able than national accounts data, but much of the country's inequality can be explained by the economy's dual structure. In 1970 Turkey was an overwhelmingly rural, agricultural economy, with 37 percent of GDP and 64 percent of total employment generated by agriculture (Dervis and Robinson, 1980; Celasun, 1989). Since then extremely rapid urbanization has led to a structural transformation of the eco-nomy. By 1994 agriculture accounted for just 15 percent of GDP, although it still generated 47 percent of employment. The productivity ratio of nonagriculture to agriculture (calculated using the employ-ment and value added data of Maraslioglu) has fluctuated around 4, which suggests that the large income differential between agricultural and nonagricultural sectors is the main reason for rapid urbanization. Distributional statistics reveal estimated Gini coefficients of 0.509 for 1978,0.522 for 1983, and 0.44 for 1987. The share of households under the poverty line was 25 percent in 1978 and 30 percent in 1983, while the ratio of highest to lowest income groups was 42.01 for 1978 and 47.27 for 1983. Income distribution analysis, following the work of Celasun (1989), shows that the main source of income inequality is
Sübidey Togan 163 the wide gap between the average incomes of agricultural and non-agricu1tural households. The income disparities within agriculture also constitute a significant source of overall inequality. Such disparities can be attributed to variations in regional conditions and uneven patterns of land ownership.
Capadty expansion
Various econornists, including Maddison (1982) and Levine and Renelt (1992), have shown that rapid, long-term econornic growth requires large investments in fixed capital. Turkey is no exception, as evidenced by (8.1). Large investments in fIXed capital over long periods require large and sustainable domestic or foreign savings.
Calculations using the national income data series for 1987-94 deve1-oped by the State Institute of Statistics indicate an average investment to GNP ratio of 24 percent. The domestic savings rate averaged 22.5 of GNP; the foreign savings rate averaged 1.5 percent. Domestic savings peaked at 27.2 percent in 1988, dropped to 22 percent in 1989, and remained there until 1994, when they fell to 20.8 percent. Foreign sav-ings reached 3.1 percent ofGNP in 1990 and 5.0 percentin 1993; during the rest of the period it fluctuated between -1.1 percent and 2.1 percent. The State Planning Organization defines public disposable income as the difference between public sector gross revenue, including state enterprise profits and depreciation, and income transfers to the pri-vate sector and the rest of the world, including interest payments. Private disposable income is the difference between GNP and public disposable income.
Consideration of the relevant accounts over 1987-94 reveals that: • The ratio of public consumption to GNP averaged 9.9 percent and
that of public savings to GNP averaged 2.1 percent. The ratio of public consumption to GNP climbed from 7.0 percent in 1987 to 12.7 percent in 1993. The ratio ofpublic disposable income to GNP declined from 13.6 percent in 1987 to 9.9 percent in 1993. As a result the ratio of public savings to GNP declined from 6.6 percent in 1987 to -2.8 percent in 1993. In 1994 the ratio of public con-sumption to GNP fell to 10.6 percent and the ratio of public savings to GNP increased to -1.8 percent.
• The ratio of public investment to GNP averaged 7.5 percent, fluctuating between 3.7 percent and 10.3 percent. In 1993 it amounted to 7.2 percent and in 1994 to 3.7 percent.
• These developments in the public sector savings--investment gap reflect a deterioration in public finances. The gap increased from 1.6 percentage points in 1988 to 10.1 percentage points in 1993. In 1994 the gap was reduced to 5.5 percentage points.
• The ratio of private consumption to GNP averaged 67.6 percent and varied little over 1987-94. The ratio ofprivate savings to GNP, on the other hand, fluctuated between 17.3 and 24.8 percent of GNP, averaging 20.5 percent.
• The ratio of private investment to GNP averaged 16.6 percent, ranging from 14.9 percent to 19.7 percent. After reaching 19.7 percent in 1993, the ratio fell to 16.2 percent in 1994.
The national accounts data revea1 that the ratio of public savings to public disposable income fell from 48.5 percent in 1987 to -28.8 percent in 1993. Since domestic savings is the sum of private and public savings, the deterioration in public fmances during 1987-92 and the accompanying decline in public savings led to the drop in total domestic savings. For capital accumulation the country can undoubt-edly rely on foreign savings. But excess reliance on foreign savings may lead to unsustainable debt fmance and hence to a loss of credit-worthiness. The country will have to follow prudent macroeconomic policies in order to avoid issuing debt at a rate higher than the growth rate of the resources available for eventual debt service. Thus Turkey must apply effective macroeconomic policies to increase domestic savings as well. The domestic savings rate of 22.5 percent and invest-ment rate of 24.0 percent during 1970-93 compare unfavorably with the average domestic savings rates of 33.0 percent in Indonesia, 32.4 percent in Korea, 33.5 percent in Malaysia, and 28.7 percent in Thai-land. The average investment rate was 30.7 percent in Indonesia, 31.9 percent in the Republic of Korea, 31.5 in Malaysia, and 32.6 percent in Thailand.
Sectoral data on the distribution of fixed investment during 1980-93 show the emphasis the govemment has placed on capital formation in basic infrastructure systems (communication, transportation, and energy). It is because of these large investments that Turkey now has adequate communication and transportation networks. Furthermore, several projects now under way will bring major improvements. For example, the Southem Anatolian Project will construct twenty-one dams and seventeen hydroelectric power plants on the Euphrates and Tigris rivers and their tributaries. About 1.6 million hectares will be irrigated and 26 billion kilowatts of electrical energy generated each
Sübidey Togan 165 year with the installed capacity of 7,500 megawatts. Furthermore, investments in the tourism sector raised tourism revenues from $326 million in 1980 to $4.32 billion in 1994. Finally, additional investment in education shou1d substantial1y increase the quality of the labor force during the second half of the 1990s.
Technical progress
Because total factor productivity growth accounted for 42 percent of GDP growth over 1978-92, it is likely that even with no changes in the supp1y of factors of production (such as capital and labor), produc-tion will expand through improvements in techno10gy and increasing returns to scale.
A number of economists have shown that two factors are key to total factor productivity growth: competitive pressure (as measured by mar-ket concentration ratios, import penetration ratios, and effective rates of protection) and research and development expenditures as a share of GDP (Grossman and He1pman, 1992; Urata, 1994; Goel and Ram, 1994). A consistent set of data on markei concentration ratios - the share of total domestic sales accounted for by the 1argest producer - is not available. However, concentration ratios for se1ected goods during 1989-90 are quite high - 100 percent for plate glass and automotive tier cords, 95 percent for pencils and buses, 90 percent for minibuses, and 80--90 percent for acrylic fiber, electrical porce1ain goods, and washing machines (Dutz, 1996). Such markets are c1early oligopolistic, and competitive pressure must be weak. As such there was not much pressure to improve production efficiency until the 1980s.
Ouring the 1980s Turkey opened its economy to foreign competi-tion by substantial1y lowering nominal and effective rates of protec-tion. The average value of the economywide nominal protection rate fell from 66 percent in 1983 to 28 percent in 1991. Simi1arly, the effective protection rate dropped from 71 percent in 1983 to 38 percent in 1991 (Togan, 1994). As a result competitive pressure from abroad has increased. Thus the concentration ratios reported by Dutz (1996) are expected to fall over time. Turkey will further 10wer nom-inal and effective protection rates during the second half of the 1990s as part of its customs union with the European Union. As competitive pressures develop, production efficiency and hence total factor pro-ductivity growth should increase.
Data on enterprises' spending on research and development are available only for 1990--92. Such spending amounted to just 0.11
percent of GNP during 1991 and 0.12 percent during 1992. Similar figures for industrial countries are in the range of 2 percent. Since it appears that the effect of research and development on total factor productivity is negligible, total factor productivity growth must be the result of increased competitive pressure from abroad and Turkish firms imitating foreign products.
Developments on the international scene
Turkey has been a signatory to the General Agreement on Tariffs and Trade (GATT) since 1951. In the GATT context Turkey is defined as a developing country. This classification allows it to maintain quanti-tative restrietions when confronting scarce foreign exchange reserves, which it did until the late 1980s.
The two most important trade agreements Turkey has concluded are the agreements with the European Union (EU) and the Economic Cooperation Organization. Under the EU agreement Turkey joined a customs union on January 1 1996. The Economic Cooperation Orga-nization, which consists of Iran, Pakistan, and Turkey, established preferential tariffs for its members in 1992. The agreement liberalizes trade among the member states for four years, after which it can automatically be renewed for another two years. Thus competitive pressures are increasing, and with the new agreements it will keep increasing, leading to increases in total factor productivity growth.
Macroeconomic poUcies
Sustainable economic growth rests on effective macroeconomic poli-eies. By the late 1970s it had become apparent that Turkey's strategy of economic growth based on import substitution, fIXed exchange rates, regulation of imports through quotas, and high nominal and effective protection rates was no longer sustainable. In 1980 the government introduced reforms to reduce inflation and control the balance of payments deficit. Policymakers also tried to make the economy more dynamic by fostering competition through trade.
During the 1980s various economic reforms improved export per-formance, eased the balance of payments deficit, and boosted real income. Exports grew from $2.9 billion in 1980 to $11.6 billion in 1989. The current account deficit moved from a deficit of $3.4 billion in 1980 to a surplus of $0.96 billion in 1989. Real income increased by an average of 4.8 percent a year during 1981-9. Inflation went from
Sübidey Togan 167 116 percent in 1980 to 39 percent in 1987. During the late 1980s, however, the government started to move away from market-oriented policies and switched over to populist policies. The ratio of public sector borrowing to GNP rose from 4.8 percent in 1988 to 11.7 percent in 1993. Because this borrowing was increasingly financed by the central bank, the money supply increased rapidly, leading to higher inflation. In 1989 the capital account was liberalized and the govemment allowed the real exchange rate to appreciate. As a result the trade deficit increased from 51.78 billion in 1988 to 514.1 billion in 1993, while the current account deficit went from a surplus of 51.6 billion in 1988 to a deficit of 56.4 billion in 1993. External debt reached 567.4 billion by the end of 1993, and domestic debt exploded. In April 1994 the govemment entered into negotiations with the International Monetary Fund to address the balance of payments crisis. The resulting stabilization package caused real GDP to drop by 5.4 percent in 1994, but the current account deficit was completely eliminated. Still, inflation during 1994 acce1erated to 106 percent. Against this background the government introduced measures - such as the EU customs union agreement - to further open up the eco-nomy.
The 1994 crisis was caused by deteriorating public finances. As the inflation rate exploded, the real exchange rate appreciated. Considera-tion of the relaConsidera-tion between the real exchange rate (RER) and the values of the share of exports in GNP (X/GNP) reveals that:
In(X /GNP)
=
-4.5289+
1.52521n RER(-9.8967) (15.1084) (9.2a)
n
=
31; p=
0.1114; R2=
0.9094; DW=
1.9966(0.6292)
The estimation of the import demand function yields: ln(m)
=
12.4847+
0.20631n GDP - 0.89291npm(5.8666) (1.8544) (-2.7086) (9.2b)
n
=
31; p=
0.5581; R2=
0.5425; DW=
2.3626(3.0915)
where m is real imports and pm is the relative price of imports, defined
aspm
=
[pm * E(l+
t)]/p. In this formulationpm* is the foreign price of imports, E is the exchange rate, t is the average tariff rate, and p is the price of domestic goods.(9.2a) and (9.2b) reveal that the balance of payments crisis in 1994 could have been avoided if policymakers had allowed the real
exchange rate to depreciate sufficiently. In that case exports would have increased, imports would have decreased, and the large trade deficit would have been avoided. Furthermore, policymakers should not have used the liberalization of the capital account to finance the balance of payments deficit by borrowing from abroad.
Investment incentives
Since 1967 the government has granted a number of incentives to promote investment in production activities. These incentives have been directed to reducing the cost of investment, reducing the need for external financing, and increasing profitability. The incentive scheme contains a number of peculiarities. First, incentives are differ-entiated by region: developed regions (consisting of cities of the Istan-bul and Kocaeli and the municipal districts of Ankara, Izmir, and Bursa), priority normal regions (provinces like Afyon, Kirikkale, and Trabzon), regions enjoying first degree priority in development (pro-vinces like Van, Agri, and Kars), and regions enjoying second-degree priority in development (provinces like Cankiri, Y ozgat, and Mala-tya). Second, the government imposes certain conditions on lower limits, investment totals, minimum level of own sources, and export levels that investments have to satisfy in order to benefit from the incentives. Tbird, all incentives originate from the central govern-ment's Undersecretariat for Treasury. Only the investments that are granted incentive certificates by tbis agency are eligible for incentives. In 1995 the investment incentives consisted of (in decreasing order of importance) an investment incentive allowance, customs exemp-tions, exemptions from the value-added tax, a premium on domesti-cally produced capital goods, state aid to certain activities, investment credits, energy incentives, postponement of the value-added tax, and land allocations. By using these measures to reduce the effective cost of borrowing to investors, the government reduces the cost of invest-ments, increasing their profitability. In addition, public investments in infrastructure lower the cost of private production and distribution.
Although the investment incentives are intended to overcome the barriers to entry into industry imposed by capital market imperfec-tions - and thus increase competition - they have become a barrier to competition and structural change. Established firms obtain unit cost advantages through the incentive system that help them consolidate their market position. New entrants with scarce fiscal resources are at a disadvantage relative to weIl informed incumbents. Thus credit
Sübidey Togan 169 incentives often reinforce the position of large incumbents. Further-more, because the govemment directly controls the allocation of credit, credit from public banks is often not extended on a commercial basis. To a large extent the high concentration values discussed earlier can be attributed to these investment incentives. With the phasing out of this system barriers to industrial entry will be reduced, leading to increases in competitive pressures and thus in total factor productivity growth.
Foreign trade policies
Besides the investment incentives, govemment aid to industry is con-centrated in trade-related measures. Until the 1980s
an
imports enter-ing Turkey were regulated by annual import programs. These programs itemized commodities under a liberalization list, a quota list, and a list enumerating the commodities to be imported under bilateral trade arrangements. Goods not included on the lists were prohibited. In 1981 the quota list was partly phased out, and a large number of commodities was transferred from the restricted list to the free import list. In 1984 imports were reclassified as prohibited, sub-ject to permission, or liberalized, and tariffs were reduced substan-tially. However, a number of levies and surcharges were introduced to constrain import demand, including a municipality tax, a transporta-tion infrastructure tax, aminerals surcharge, a stamp duty, a value added tax, a housing fund tax (which finances low-cost housing for poor and middle-income families), a resource utilization and support fund tax, and a support and price stabilization fund tax. At the beginning of the 1990s the import permit system was eliminated, import formalities were eased, and quantitative restrietions were abol-ished. Furthermore, as of 1993 all charges except for customs duties, the housing fund tax, and the minerals surcharge were abolished. Imports exempt from duties under GA TI represented about 38 per-cent of total imports in 1992. In addition, holders of investment incentive certificates are allowed to import machinery and equipment duty-free and exporters are allowed to import intermediate inputs and other capital goods duty-free.In 1989 Turkey adopted a Law on the Prevention of Unfair Com-petition in Importation that contained antidumping and antisubsidy provisions. A Law on the Protection of Competition, modeled largely on EU practice, was adopted in December 1994. This statute contains rules on forbidden practices, provisions against the abuse of a
dominant market posItIon, and regulations on acquIsltIons and mergers. Further liberalization of foreign trade and effective applica-tion ofthis law would cause levels of domestic industrial concentraapplica-tion to fall over time. As a result competitive pressures will rise, leading to increases in total factor productivity growth and hence in GDP per capita.
Publie enterprise polieies
Turkey's public enterprise sector is very large. During the 1930s the govemment formulated an ideological position called etatism, defined as state intervention to direct industrial activity in the interest of national development. These policies were implemented within the frameworks of five-year plans that assigned a leading role to the public sector in saving generation and in carrying out key entrepre-neurial functions in industrial development. As a result of the etatist and import substitution policies followed until the end of the 1970s the share of state-owned enterprises in total value added amounted to 11.5 percent in 1985 and 10.6 percent in 1990 (OECD, 1992). Until March 1996 the state held monopolies in tobacco, weapons, air trans-portation, sugar prodution, and telecommunications. In the manufac-turing sector state-owned enterprises were concentrated in basic metals, chemicals, petrochemicals, fertilizers, newsprint, paper, oil refineries, cement, and textile production. (In March 1996 state-owned enterprises gave up their monopolies in production of fertilizers, paper, cement, and textiles.) These enterprises generally exhibit poor economic performance, mainly because of the soft budget constraints they face. Politicians force them to pursue such objectives as agricul-tural income support and employment creation. Public firms are not subjected to commercial code, and so avoid bankruptcy laws. Pricing, employment, and investment decisions require the approval of the Treasury, the State Planning Organization, and sometimes ministers. Although privatization has been a prominent part of the structural adjustment program since 1983, the difficulties it has encountered have limited its momentum.
It should be emphasized that, besides the barriers to entry imposed by the investment incentives, Turkey also limits exit. Public firms are often not allowed to go bankrupt. The govemment protects workers from unemployment by subsidizing unprofitable firms. Such policies make firms more risk averse in undertaking new activities and block a more decisive approach to resource allocation. Because proper
fune-Sübidey Togan 171 tioning of the price system requires both free entry and free exit of firms from markets, the privatization of public enterprises should be considered. Privatization would increase efficiency and hence total factor productivity growth, 1eading to increases in the rate of GDP growth.
PROSPECTS FOR THE FUTURE
In addition to the factors just discussed, Turkish economic growth over the next several decades will be determined by regional political developments and international economic developments.
Regional political developments
Turkey has been directly affected by the downfall of communism in Eastern Europe and the disintegration of the Soviet Union. As a result of these changes the centuries-old Turkish-Russian borders have ceased to exist; Moscow's power around the Black Sea coast has been fragmented; in the Southern Caucasus Soviet sovereignty has been replaced by Georgia, Armenia, and Azerbaijan; in Central Asia the Turk-speaking republics have been freed from Russian rule; and in the Balkans an entirely new politicallandscape has emerged. The changes have also aroused sentiments, perceptions, and aspirations about group identities, preferred lifestyles, and national and cross-cultural experiences. To the east Turkey enjoyed a long period of harmonious relations with Iran. But Irans efforts to export the Islamic revolution, competition for influence in Central Asia, and Iran's back-ing of the Kurds have strained relations between the two countries. The Iraqi quest for advanced weaponry, friction over Turkish control of the sources of the Tigris and Euphrates rivers, and the Gulf war have generated tensions between Ankara and Baghdad. Turkish-Syrian relations have long been corroded by disputes over Hatay province, and Syrian accumulation of advanced weaponry, water issues, and Syrian backing of Kurd separatists all present conflict areas. Besides the conflicts over Cyprus and control over the Aegean Sea Turkeys most challenging problem is the growth of Kurdish nationalism. Developments on these fronts will determine the extent of the resources Turkey will have to devote to security and national defense in the future. The volume of resources diverted from such areas as education and infrastructure investments to security and
national defense will determine the reduction in resources for product-ive investments and hence in rates of economic growth.
International economic developments
Integration with the European Union
On March 6, 1995, it was agreed at the Association Council meeting in Brussels that Turkey would join the European customs union starting January 1, 1996. Under the timetable specified in the agreement, Turkey:
• Eliminated all customs duties, quantitative restrictions, charges equivalent to customs duties, and measures equivalent to quantita-tive restrictions in trade with EU countries on January 1, 1996. • Adopted the Common Customs Tariff against third-country
imports on January 1, 1996, and will adopt the preferential agree-ments the Union has concluded with third countries by 2001 (for certain products Turkey will impose higher tariffs than those in the Common Customs Tariff for another five years).
• Will adopt within five years EU instruments relating to the removal of technical barriers to trade. Tbe list of these instruments will be laid down within a year. Effective cooperation will be achieved in the fields of standardization, quality, and certification.
• Will implement EU commercial policy regulations, including pro-cedures for administering quantitative quotas, antidumping rules, and procedures for officially supported export credits. Turkey will also adopt the EU's textile and garments agreement with third countries.
• Will adjust policies in order to adopt the common agricultural policy required to establish freedom of movement of agricultural products.
• Adopted EU customs provisions on origin of goods, customs declarations, release for free circulation, customs debt, and right of appeal.
• Will ensure adequate and effective protection and enforcement of intellectual, industrial, and commercial property rights.
• Will adopt EU competition rules, including measures regarding public aid, within two years. However, aid for structural adjust-ment purposes will be considered compatible with the functioning of the customs union for another five years.
Sübidey Togan 173 • Will adopt until 1998 legislation to secure the patentability of
pharmaceutical products and processes.
The European Union, on the other hand, will abolish the system of quotas in textile and clothing products as soon as Turkey has imple-mented EU garments and textile agreements with third countries; measures regarding intellectual, industrial, and commercial property; and competition (including the measures regarding public aid). The Framework Agreement is silent on three issues: supply of services, movement of capital, and movement of labor.
The customs union between Turkey and the European Union will allow goods to circulate freely between the two parties. In addition, Turkey will implement the EU's Common External Tariff (CET) on goods from third parties and adopt all of the EU's preferential trade agreements. To calculate the efTect of these changes on the Turkish economy it is necessary to obtain figures on nominal protection rates for trade with the Union and third countries for periods before and after the formation of the customs union. The Framework Agreement distinguishes between two sets of commodities: products in which it was thought that Turkey could achieve international competitiveness relat-ively soon were placed on a twelve-year list; other industrial products were placed on a twenty-two-year list. In January 1996 the nominal protection rate for both sets of commodities was lowered to zero.2
The average weighted tariff rates prevailing in 1994 and that will prevail in 2001 when Turkey adopts the Common External TarifT and all the preferential EU trade agreements were estimated by Togan (1995). These agreements include free trade agreements with Central and Eastem European countries, Ba1tic countries, and Israel; prefer-ential trade agreements between the European Union and Mrican, Caribbean, and Pacific countries; and the Genera1ized System of Trade Preferences that the EU has granted to developing countries. The weighted average nominal protection rate during 1994, weighted by the share of the respective country groups in Turkish imports, was 13.16 percent. The weighted average nominal protection rate that will prevail in 2001 is 3.16 percent. The input-output table prepared by the State Institute of Statistics for 1990 was used to ca1culate efTective protection rates. The economywide efTective protection rate will fall from 18.44 percent in 1994 to 1.12 percent in 2001 (Togan, 1995). The efTects of the customs union on sectoral value-added is calculated by subtracting the value of the efTective protection rate for 1994 from the value ofthe efTective protection rate for 2001. Thus membership in the
customs union will increase value-added in such sectors as grain mill products, sugar refining, and c10thing and lower value-added for processed tobacco, petroleum refining, and nonalcoholic beverages.
Membership in the customs union will lower annual tariff revenue by about $2.4 billion. Turkey will have to compensate for this loss by increasing other taxes or reducing public spending. In either case output will decrease and unemployment will increase in the short run - at the same time that adjustment takes place under the standby agreement conc1uded with the International Monetary Fund in 1994. Furthermore, adjustment will raise employment in sectors where the country has comparative advantage and lower it in sectors where it does not. The country will also have to adjust to the changing condi-tions regarding competition policy and new rules on intellectual, industrial, and commercial property rights. These adjustment costs will be rather costly in the short run.
Turkey considers membership in the customs union as an intermedi-ate step toward the achievement of full membership in the European Union. The country recognizes that the increased competition achieved through the customs union will lead, in the long run, to improved resource allocation and thus to welf are gains. Policymakers are willing to bear the short-run costs of establishing the customs union, even in the absence of the kind of assistance Greece, Portugal, and Spain received when they joined the Union. Membership in the Union is desirable for a number of reasons. The Union will be Turkey's main trading partner and primary source of technology and investment over the next few decades. Membership will lock in political and economic reforms, providing credibility to these reforms. Membership will increase competition for Turkey within the Union, leading to improved allocation of resources and hence to increases in long-run per capita income. As a result of these changes the customs union will cause - once short-run adjustments in the economy are complete - total factor productivity to grow and per capita incomes to rise over time.
Multilateral agreements
The Uruguay Round is the most comprehensive round launched by the GATT. Besides tariff reductions, this round addressed complex issues like agriculture, trade in services, intellectual property rights, and trade-related investment measures (TRIMs).
For Turkey the implications of the Uruguay Round are similar to those of the customs union agreement. According to the Uruguay
Sübidey Togan 175
Round the average tarifTs on industrial goods will fall by more than a third until January 1 1999 (the customs union requirements are more demanding). In the case of agriculture the Uruguay Round requires that member countries convert a11 nontarifT barriers to trade to tarifTs and reduce the tarifTs by about 24 percent. Export subsidies will be reduced by 36 percent in value terms and 21 percent in volume terms from their 1986-90 base. The reductions in tarifTs and subsidies will take p1ace over six years for industrial countries and ten years for developing countries. These requirements are more demanding than those of the customs union agreement, which did not clearly specify requirements on the adoption of the common agricultural policy. For textiles and clothing the Uruguay Round requires that bilateral quotas negotiated under the Multifiber Arrangement be completely phased out over a ten-year period. Under the customs union agreement the Union will eliminate quotas on Turkish textile and clothing exports once Turkey has efTect-ively implemented the measures regarding intellectual, industrial, and commercial property; competition (including the measures on public aid); and EU garments and textile agreements with third countries.
In the case of intellectual property the requirements of the customs union agreement are similar to those of the Uruguay Round. Accord-ing to the Uruguay Round Turkey will have to adopt the Trade-Related Aspects of Intellectual Property Rights agreement until 2000; the customs union agreement requires that Turkey implement this agreement until 1999. Furthermore, the customs union requires that Turkey adopt until 1998 legislation to secure the patentability of pharmaceutical products and processes.
For subsidies the Uruguay Round defines three categories of subsi-dies: prohibited subsidies (those contingent on export performance or the use of domestic rather than imported goods), actionable subsidies (those that have demonstrably adverse efTects on other member coun-tries), and nonactionable subsidies. The agreement also restricts the use of countervailing measures introduced in response to competitors' sub-sidies. The customs union agreement, on the other hand, requires that Turkey adopt EU competition policies. As such the customs union agreement is much more restrictive than the Uruguay Round agreement. CONCLUSION
Turkey's economic policies during the early and mid-1980s were extremely successful at liberalizing the economy. The formation of a
customs union with the European Union will further open the econ-omy. By allowing greater competition in domestic markets by redu-cing barriers to imports, eliminating export and production subsidies, introducing competition policies and laws regarding intellectual prop-erty rights, privatizing state-owned enterprises and subjecting them to market rules, and alIowing foreign direct investment Turkey will be able to achieve sustainable real growth. Turkey recognizes the import-ance of the customs union agreement and the Uruguay Round agree-ments. The govemment's long-run objective - increasing the welf are of its citizens by achieving steady growth in GNP per capita - will be achieved by the EU customs union. But it certainly was not the only approach. If the customs union agreement had not been ratified by the European Parliament in October 1995, Turkey could have increased competition and elevated national welf are by opening the economy to foreign trade, taking the necessary measures to increase competitive pressures, following the rules of the Uruguay Round, and establishing free trade agreements with the European Union, the United States, and other countries.
Notes
1. The author is grateful to Professor Hanaa Kheir-EI-Din for helpful comments and suggestions.
2. Three other types of eommodities were also eonsidered under the agree-ments: agricultural produets, produets within the province of the
Euro-pean Coal and Steel Community (ELSC), and produets within the province of the European Atomie Energy Community. In order to establish freedom of movement of agricultural produets, Turkey will have to adopt the EU'scommon agricultural policy, whieh provides the main framework for agrieultural support. The poliey is based on three prineiples: free movement of agrieultural eommodities through the eom-mon market order system, protection of agricultural markets from for-eign eompetition through market interventions, and fmancing of agrieultural support program from the EU budget, mainly through the European Agricultural Guidance and Guarantee Fund (EAGGF). Thus Turkish agrieultural eommodity prices should rise to EU levels, and Turkey should fmance its agrieultural support program from a fund similar to the European Agrieultural Guidance and Guarantee Fund. The State Planning Organization estimates the amount of required annual support at $3.1 billion. Since Turkey cannot devote this amount to agrieultural support, free movement of agrieultural produets will not be achieved in the near future.
Sübidey Togan 177
References
Barro, Robert J., 1991. "Economic Growth in a Cross Section of Countries,"
Quarterly Journal of Eeonomies, 106: 407-3.
Celasun, Merih, 1986. "A General Equilibrium Model of the Turkish Eco-nomy, Simlog-l," Middle East Teehnieal University Studies in Development,
13: 29-94.
- - - 1989. "Income Distribution and Employment Aspects of Turkey's Post-1980 Adjustment," Middle East Teehnieal University Studies in Devel-opment, 16: 1-30.
Dervis, Kemal, and Sherman Robinson, 1980. "Tbe Structure of Income Inequality in Turkey," in E. Özbudun, and A. Ulusan, (eds.), The Politieal Eeonomy of Ineome Distribution in Turkey, London: Holmes & Meier. De Santis, Roberto, and H. Gazi Özhan, 1994. "A Social Accounting Matrix
for Turkey 1990," University of Warwick, Development Economics Research Centre.
Dutz, Mark, 1996. "Competition Law and Its Relevance for Turkey," in Reftk Erzan (ed.), Polieies for Competition and Competitiveness: The Case of Indus-try in Turkey, Vienna: United Nations Industrial Development Organization. Goel, Rajeev K., and Rati Ram, 1994. "Research and Development
Expen-ditures and Economic Growth: A Cross-Country Study," Economie Devel-opment and Cultural Change, 42: 403-11.
Grossman, Gene M., and Elhanan Helpman, 1992. Innovation and Growth in the Global Economy, Cambridge, Mass.: MIT Press.
Hamilton, Bruce W., 1995. "Education and Development," report prepared by Bükent University faculty members for Prime Ministry of the Republic of Turkey, Bilkent University, Ankara.
Jorgenson, Dale W., and Zvi Griliches, 1967. "Tbe Explanation ofProductiv-ity Change," Review of Economic Studies, 34: 249-83.
Levine, Ross, and David Renelt, 1992. "A Sensitivity Analysis of Cross-Country Growth Regressions," Ameriean Economic Review, 82: 942-63. Maddison, Angus, 1982. Phases of Capitalist Development, Oxford: Oxford
University Press.
Maraslioglu, Haryi, and Ahmet Tiktik, 1991. "Turkiye Ekonomisinde Sek-torel Gelismeler: 'Uretim, Sermaye Birikimi ve Istihdam 1968-1988," State Planning Organization, Ankara.
OECD (Organization for Economic Cooperation and Development), 1992. "OECD Economic Surveys: Turkey 1991-1992," Paris: OECD.
---1993, "OECD Economic Surveys: Turkey 1993," Paris: OECD. Togan, Sübidey, 1994. Foreign Trade Regime and Trade Liberalization in
Turkey during the 1980s, Aldershot: Avebury.
1995. "Turkey and the European Union," in H. Ersel, (ed.),
Towards A New Medium-Term Stabilization Programfor Turkey, Istanbul: Turkish Industrialists' and Businessmen's Association.
Urata, Shujiro, 1994. "Trade Liberalization and Productivity Growth in Asia: Introduction and Major Findings," The Developing Economies, 32: 363-72. World Bank, various years. World Development Report, New York: Oxford