Communi
C
a
tion
Continuous Triboelectric Power Harvesting and
Biochemical Sensing Inside Poly(vinylidene fluoride)
Hollow Fibers Using Microfluidic Droplet Generation
Mehmet Kanik,* Merve Marcali, Muhammad Yunusa, Caglar Elbuken,
and Mehmet Bayindir*
Dr. M. Kanik,[+] M. Marcali, M. Yunusa, Prof. C. Elbuken,
Prof. M. Bayindir
UNAM-National Nanotechnology Research Center Bilkent University
06800 Ankara, Turkey
E-mail: [email protected]; [email protected] Dr. M. Kanik, M. Marcali, M. Yunusa, Prof. C. Elbuken, Prof. M. Bayindir
Institute of Materials Science and Nanotechnology Bilkent University 06800 Ankara, Turkey Prof. M. Bayindir Department of Physics Bilkent University 06800 Ankara, Turkey DOI: 10.1002/admt.201600190
charge separation in the materials and thus, result in induc-tion of free charges on coated electrodes at the surface of the dielectrics.[7,20–22]
In addition to the surface structure, triboelectric polarity of the materials also plays an important role in building high performance TENGs and triboelectric nanosensors (TENS). John Carl Wickle has listed triboelectric materials according to their relative charging capacity for the first time in 1757.[7,23,24] Research on the subject followed up with extended lists cov-ering not only solids but also liquid compounds and biological substances. A few number of studies addressing liquid-die-lectric interfaces for the large area TENG devices, which are adapted to water waves or rain droplets, are promising renew-able energy sources due to fast and high charging capacity of such interfaces.[25–34] The working mechanism is related to chemical polarity of liquids as well as the surface and tribo-electric properties of the ditribo-electric substrates. Therefore, such systems are used for chemical polarity dependent sensors to quantify the molar fractions of binary solutions.[35,36] One of the main bottlenecks for liquid-based triboelectric power harvesting is the need for continuous medium exchange.
Previously we reported high performance triboelectric power generation using nanofibers produced by iterative thermal size reduction (TSR) technique.[18] In some reports, poly(vinylidene fluoride) (PVDF) fibers were efficiently utilized in nanonet-works as a high performance triboelectric nanogenerator.[37] Here in, we present the integration of PVDF hollow fibers with a microfluidic device that generate droplets for continuous medium exchange. We demonstrate an integrated system of a microdroplet generating microfluidic chip and triboelectric devices based on PVDF hollow fibers. The microfluidic unit feeds continuous droplets of liquid to the PVDF hollow fibers while the triboelectric effect is used for energy generation.
Droplet-based microfluidic systems compartmentalize the fluids of interest in tiny segments separated by a carrier fluid, thus provides segmented two-phase flow.[38] The ability to con-trol flow rates at micro scale enables these systems to achieve exquisite control on the speed and size of the droplets. Coupling the PVDF hollow fibers with droplet-based microfluidic sys-tems reveals the true potential of triboelectric generators since the triboelectric surface experiences continuous and extremely repeatable medium transport that corresponds to repetitive con-tact and separation of two surfaces in conventional systems. The system that we present in this study demonstrates the gen-eration of periodic electric pulses from the PVDF hollow fibers that can be scavenged for several on-chip applications.
Triboelectric effect is one of the most mysterious phenomena that cannot be completely explained using state-of-the-art tech-niques due to its complex nature.[1,2] The fundamental question of the origin of triboelectric charges has yet to be answered. Considerably strong hypotheses pinned to this multiphysics problem are related to either charge/ion transfer or material transfer.[3–5] The projections of chemists relating tribocharges to surface radicals are superior by accurate and repeatable experiments and point out that the tribocharges have chemi-cally or electrichemi-cally controllable on/off states.[4,6] While debates on understanding the fundamentals are going on restlessly, tri-boelectric effect has been utilized for engineering approaches as sensor or energy harvesting device with extraordinary high performance.[7–16]
Though triboelectric nanogenerator (TENG) is a recent con-cept based on sliding and contact/separation of dielectric mate-rials, the capacity of TENGs to derive energy has significantly improved. Researchers succeeded to harvest over 1 kV open cir-cuit voltage (OCV) and 1 mA short circir-cuit current (SCC) from surrounding environmental motions using TENGs.[7,17–19] The basic working mechanism of TENGs is based on primary school frictional charging experiment. Rubbing two dielectric pairs such as human hair and polymers induces static charges on the surface of the materials. Nanostructuring the surface of mate-rials minimizes the required rubbing motion. Hence, simple contact and separation movements of nanostructured surfaces result in higher surface charge due to enhanced molecular level frictions. Additionally, the contact and separation action cause
[+]Present address: Research Laboratory of Electronics, Massachusetts
ance meters; and surface plasmon spectrometers. In this study, we alleviate this problem by utilizing the triboelectric effect for detection of droplets and biological substances as an alternative self-powered microfluidic sensory system. Practice of TENS as biological sensors is a promising approach. Recently there have been a few attempts for triboelectric sensing of catecholamines such as glucose and dopamine (3,4-dihydroxyphenethylamine), which play a major role in central nervous and hormonal system.[50,51]
To the best of our knowledge, we present the first triboe-lectric sensor for detection inside microdroplets, which over-comes shortcomings of droplet-based microfluidic systems as discussed above. The device has two parts: (i) microfluidic chip where the droplets are generated and (ii) triboelec-tric component made of PVDF hollow fiber with extend-able length and flexible mechanics. We demonstrate overall capacity of the device for microfluidic energy harvesting and biochemical detection. In addition, we develop finite element simulation to explain the underlying electrostatic induction mechanism between droplet–dielectric–metal interfaces. Energy harvesting performance of the device in TENG mode is measured as 0.39 V OCV and 120 µA SCC using a PVDF hollow fiber of 300 µm O.D. with deionized (DI) water drop-lets. The maximum instantaneous power generated with the microfluidic TENG is 47 µW. The primary observation is a logarithmic change in output signal with respect to droplet size. When the system is used as a chemical TENS, we are able to detect 10% ethanol mixture in DI water. In addition, we are able to detect eukaryotic cell population in phosphate buffer saline (PBS).
The system is composed of a microfluidic device and a PVDF hollow fiber with copper electrode. The electrode on PVDF hollow fiber is connected to an external circuit to sense the induced potential due to the droplets passing through the sensing region. The microfluidic unit is designed to generate a train of monodisperse and equally spaced microdroplets of aqueous solutions separated by air gaps. The device is fabri-cated in polydimethylsiloxane (PDMS) by conventional soft lithography using an SU-8 mold. It is then sealed on a glass slide by plasma bonding. Microdroplets are generated in the microchannel using a T-junction geometry. Aqueous solu-tions and air are supplied to the system using a pressure con-troller pump. Viscous shear and interfacial forces govern the
atoms spontaneously align in a polar conformation in as-produced PVDF using TSR method.[52] A schematic drawing explaining hollow PVDF fabrication is shown in Figure 1A. Ini-tially, a roll of PVDF film was inserted in a polysulfone (PSU) preform as shown in Figure 1B. The preform was mounted in a fiber tower parallel to the heating furnace. The multimaterial structure was constantly fed through the core of the furnace, where the preform was heated above the glass transition tem-perature of the PSU cladding (Tg≈ 190 °C) and melting point of the PVDF (Tm = 170 °C) core. A pulling stress around 3 MPa was applied parallel to the fiber drawing axis. Produced fibers are shown in Figure 1C. PVDF sheet was molten and cross section of PVDF core was organized into a consolidated ring structure in drawing process that was performed around 240 °C processing temperature. As shown in the cross-sectional scan-ning electron microscopy (SEM) image of a PVDF hollow fiber in Figure 1D, PVDF films were fused thermally into a perfect tubular shape. TSR process allows us to control diameter of the output fiber by controlling the applied force, process tempera-ture, drawing speed, and preform feeding speed. We were able to achieve PVDF hollow fibers at different diameters ranging from 300 µm to 1 mm. In Figure 1E, SEM image of different sizes of PVDF hollow fibers is illustrated.
Polymer cladding of the hollow fibers can be removed mechanically or dissolved selectively in dichloromethane. As shown in Figure 1F,G, an etched PVDF hollow fiber (5.5 cm in length and 300 µm outer diameter and 280 µm inner dia-meter) was inserted to the outlet of the microfluidic channel. The outer diameter of the hollow fiber was adjusted according to the diameter of the microfluidic device outlet. A copper tape (12.7 mm in width) was wrapped around PVDF hollow fiber as an electrode for scavenging charges due to electrostatic induction and contact electrification. In order to prevent cross contamination due to the use of various different solutions, we used separate microchannel and PVDF hollow fibers with iden-tical dimensions in each experiment.
Electric induction mechanism in this system is due to tri-boelectrification between water droplet, PVDF fiber, and the electrode as shown in Figure 2A which can be explained in multiple steps. Initially, positively charged DI water droplet induces negative charges on PVDF before it flows in between copper electrode. However, that does not induce any charge in the electrode since droplet is far from the electrode. As
Communi
C
a
tion
the water droplet approaches the copper electrode, electric induction occurs due to positive electric potential that is gen-erated between the external circuit and the electrode. When the droplet is at halfway in the effective region, equilibrium is attained with maximum output signal. Furthermore, once the droplet exits the sensing region, charges are redistributed due to charge imbalance and consecutively a negative potential dif-ference builds up to drive electrons back to the external circuit. As the individual droplets exits the effective sensor area, charge equilibrium is realized and one pulse cycle is completed.
The triboelectric cycle was modeled using finite element techniques. In this model, since charge decay duration was larger than contact/separation time of droplets, distribution of charges was assumed to be uniform in the sensing region. In the finite element simulation model in Figure 2B, we provide a detailed representation of electric potential for a positively charged droplet passing through the copper electrode. Initially, when the droplet is away from the electrode there is no induced electric potential to drive electrons from the external circuit. Eventually, when the droplet approaches the electrode, positive electric potential starts to accumulate between the electrode and the PVDF layer. The change in the potential strength depends on the size and the position of the droplet in the effective area until it reaches equilibrium. The time scale at which the droplet moves in the hollow fiber was correlated with the signal peak width.
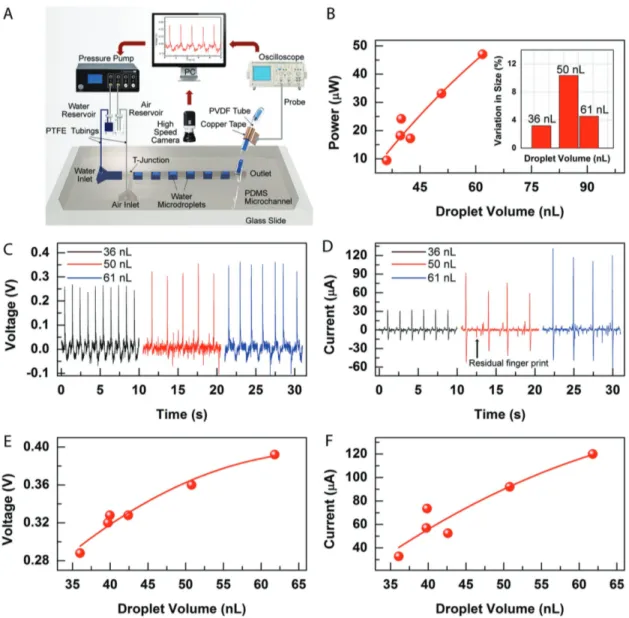
Contact area at the triboelectric interface plays a major role in output signals of TENG devices. Fiber-based micro-fluidic TENG was characterized by measuring the OCV and SCC with respect to change in DI water droplet size using the measurement setup shown in Figure 3A. The effective surface
area, which is the overlapping area of the droplet and copper electrode, is proportional to the droplet volume. Expectedly, maximum current and voltage values are achieved with the longest droplet resulting in a maximum power output of 47 µW in the sensing region. We calculated the generated power as a function of DI water droplet volume as shown in Figure 3B. In Figure 3B (inset), we showed the size variation in individual droplets, which causes variations in ouput signals. OCV and SCC recordings from different volumes of droplets are given in Figure 3C,D. The maximum signals were measured as 392 mV and 120 µA. Increasing droplet volume increases SCC and OCV output (Figure 3E,F). It is important to note that the microfluidic droplet generation unit provides precise control on the size and spacing of droplets by controlling the input pressures, which allows tuning of the signal amplitude and frequency. We have recorded travel of droplets in our system using high frame rate camera for analyzing the synchronism between motion of droplets and peaks, and size variations in water droplets. Droplet shape slightly changes in each pass and causes variations in contact area. This is because we use an air–water fragmental droplet generation technique. Since air is a compressible and water is an incompressible material, slight pressure changes in microfluidic channel causes indi-vidual droplet size and shape variation correlated with voltage and current outputs. We quantified size variation in specific droplets as given in Figure 3B (inset). According to our calcula-tions, size variation was 3.21%, 10.37%, and 4.55% in droplets of 36, 50, and 61 nL volumes, respectively. To understand this variation, we should take a closer look at the droplet generation mechanism. Initially, we start water flow through the channel. Afterward, we start feeding pressurized air to the system. We Figure 1. Fabrication of PVDF hollow fibers and microfluidics chip assembly. A) PVDF hollow fibers were produced using thermal size reduction
tech-nique. A multimaterial preform consists of PVDF and PSU inserted in the vertical oven of the fiber tower and pulled downward by applying tension. Temperature was set above the glass transition temperature of PSU and melting point of PVDF. As PSU cladding shrinks down into fibers by applied force, PVDF films form a self-assemble tubular shape inside the PVDF fiber due to surface tension. B) PVDF films were rolled and inserted in PSU preform, which was produced by rolling PSU films and consolidated above glass transition temperature of PSU at vacuum conditions. C) We were able to produce kilometer-long, polymer encapsulated PVDF tubular channels. D) SEM image of as produced PVDF hollow fibers in PSU cladding. The surface was prepared using ultramicrotome. E) Size of the PVDF hollow fibers was controlled by playing parameters of fiber drawing process. Eventu-ally total reduction factor determines the final dimensions. PVDF hollow fibers were extracted out of their cladding by mechanical pulling or chemical etching. F,G) PVDF hollow fibers were coupled to outlet of droplet generator microfluidic chip. Two different components were released from different inlets of the chip. By adjusting the relative pressure of inlets, the droplets were generated. The droplets were coupled to flow through the PVDF hollow fiber while inducing a potential difference on the Cu electrode. Inset: DI water droplets take biconcave shape due to air pressure surrounding it. Inset: Biconcave shape droplet generated in microfluidic channel. Scale bar is 300 µm.
play with pressures of two coupled channels until we find the optimum relative pressures that makes it possible to generate stable droplets. In this procedures, we selected the most stable and regularly occurring droplets to show the proof of principle concept. We further investigated the process and realized that each droplet leaves some residual water in fiber channel, which causes a preset local electric field. That means, residual water can affect the intensity of the output signals and cause varia-tions. Furthermore, these residuals also leave their fingerprint in voltage and current plots as an interval small peaks between main signals.
Self-powered triboelectric nanosensor (TENS) function of our device was characterized by observing the change in the OCV with respect to change in chemical concentration of ethanol/ water mixture droplets flowing through the PVDF hollow fiber. Water is the best solvent with highest polarity and it is positively charged. Ethanol has lower polarity and charge in comparison with water. Ethanol has been used as a dipping solution for dis-charging materials in triboelectric measurements because of its low charge capacity. Therefore, ethanol concentration in water changes the overall charge of the binary solution. As shown in Figure 4A, output voltage signal decreased with increasing
ethanol concentration in DI water droplet. Measurements in all concentrations were conducted for at least 1 min using a minimum of 30 droplets and mean values were plotted. DI water droplets yielded the highest signal with 1 V, when a PVDF hollow fiber with 250 µm I.D. was coupled to the micro-fluidic chip. A significant change in the voltage was observed after adding ethanol in DI water. OCV signal dropped down to 340 mV, when ethanol concentration in DI water increased up to 50%. Increasing the ethanol concentration to 75% dropped the signal to 139 mV. A 112 mV output voltage was observed, when pure ethanol droplets were used. Average sensitivity of our device was calculated as 5 mV mmol−1 mL−1 ethanol in DI water.
Microfluidic community has been using microdroplets to study the effects of reagents on cell populations. Since these experiments require scanning of a multiparameter domain with several repetitions, performing these studies in contin-uous trains of microdroplets is very advantageous. Cells have a potential difference between inner and outer membranes. The outer membrane of cells has a negative charge, which has a crit-ical function in cell signaling and protein recognition. There-fore, similar to ethanol, we can detect cells in buffer solution Figure 2. Schematics explaining the working principle of TENS device. A) The induced potential was measured on Cu electrode when DI water droplet
passed through the electrode-PVDF shell layer. Initially there was no voltage induced on the electrode because of large distance between electrode and water droplet. An electron flow through the electrode occurred, when droplet went into the boundaries of the electrode. That flow continued until the system was balanced at equilibrium state. When the droplet left the electrode region, symmetry of the same phenomenon occurred, except electrons were flowing through the external circuit in the opposite direction. B) A finite element model for simulating electric potential induced by the droplet. The system consists of Cu electrode, air spacing, PVDF hollow fiber, and water droplet, same as the real device. Results of finite element simulations. (1) There was no induction when the droplet was away from the electrode region. (2,3) Induction was started from the boundaries when droplet flows to the edge of the electrode. (4,5) Maximum induction was obtained until the equilibrium state was reached at the point of no change in the field. (6,7) While droplet was leaving the active electrode region, the field started to decrease at this point, with a symmetric trend of entrance of the droplet. (8) There was not induction when electrode and the droplet are away from each other.
Communi
C
a
tion
with different populations (Figure 4B). The cells have impact on the output signal of our device. We generated droplets of PBS containing Escherichia coli (E. coli) cells (Figure 4B (inset)). PBS is a positively charged aqueous solution. Since cells and PBS are oppositely charged, increasing number of E. coli cells decreases the output voltage as shown in Figure 4B. Cell con-centrations in PBS were confirmed using a hemocytometer. Minimum number of E. coli cells that we can detect with our system was 6.5 × 10⁴ cell mL−1 with 16 mV output signal. The
shape of the droplets was distorted in cell experiments because of drastic change in solution viscosity. Increasing number of cells in PBS solution made it difficult to achieve stable droplet formation due to cell adhesion to the microfluidic channel. We were able to form droplets using 8.6 × 10⁴ cell mL−1 of
E. coli cell concentration in PBS which yielded 10.4 mV. Finally,
we calculated average sensitivity of our device as 0.3 mV per 1000 cell mL−1E. Coli cell. Other cell types can present different
surface adhesion properties, surface area, and surface charges. Figure 3. Experimental setup and signal characterization. A) Device setup for signal measurement from the generated droplet in microfluidic chip.
The chip has water and air inlet connected to a pressure pump. On the other end is the droplet outlet integrated with PVDF hollow fiber. Size tunable droplets were formed in the channel by tuning the air and water pressure line. The droplets were separated with air interfaces periodically. Copper electrode was wrapped around the PVDF hollow fiber for electrical connection. Individual water droplets were generated using the microfluidics chip and were transferred to the hollow fiber in which distinct signals were detected at the effective area by an oscilloscope. Characteristic signals of droplets were recorded on the monitor. High-speed camera is used to visualize the droplets as they move in the channel. B) Correlation between power and droplet volume. The power is linearly dependent on the droplet volume. The power increases with increase in droplet volume. Inset: Size variation of individual droplets. Size variation was calculated as 3.21%, 10.37%, and 4.55% in droplets with 36, 50, and 61 nL volumes, respectively. C–F) OCV and SSC increase with increasing droplet volumes. Small peaks between main voltage and current peaks were observed as a result of residual DI water in the channel which leaves its fingerprint as an interval dwarf peak between main signals. The maximum signals are measured as 392 mV and 120 µA for 61 nL droplet. By controlling the spacing between droplets and their volumes, the signal amplitude and frequency is varied.
Therefore, the system should be calibrated for each specific cell type and the cell suspending medium. As an on-going work, we aim to improve the sensing capability of our system in complex biological system with explicit signal differentiation as a blue-print of an individual substance.
We developed a fiber-based microfluidic TENG and self-pow-ered TENS system for energy harvesting from microdroplets and analyzing droplet-based cell counting and chemical anal-ysis. In TENG mode, the system can generate up to 1 V OCV and 120 µA SCC. Maximum instantaneous power output of our device was 47 µW, when 280 µm diameter fiber was used. Thanks to the low cost and uniform fiber producing technique, energy-harvesting capacity can be enhanced by using extended length of PVDF hollow fibers and multiple number of seri-ally arranged electrodes along the fiber. We demonstrated that droplet size has a significant effect on output signal since the surface area of the droplet plays a major role in charge induc-tion mechanism; increasing droplet size increases the output signal. We were able analyze chemical composition of binary solutions such as ethanol/DI water mixtures. Increasing per-centage of ethanol in DI water revealed a characteristic signal change. We detected 10% ethanol in DI water with a sensitivity of 5 mV mmol−1 mL−1 ethanol. In addition, we demonstrated that our system can be used as a droplet-based platform for cell counting. Increasing number of E. coli cells in the droplets decreases the triboelectric signal due to the change in the total charge of the droplet. We were able to detect 6.5 × 10⁴ cell mL−1 with 16 mV output signal. As the number of the cells increased, droplet generation became challenging because of cell adhesion to channel surface. The maximum detectable cell concentration for our system was 8.6 × 10⁴ E. coli cell mL−1 in PBS solution. A future work to understand biosensing capacity of TENS would be detection of different cell types such as neurons and cancer cells, based on their varying adhesion characteristics, surface area, and membrane charges. Cancer cells and healthy cells have different membrane charges and mechanical char-acteristics.[57,58] Hence, we believe that our technique has great potential in on-chip cancer diagnoses. Growth of nerve and
Experimental Section
Fabrication of Microfluidic Chip: In the
fabrication process of microfluidic device, standard soft lithography was used. First, SU-8 2050 (MicroChem) negative photoresist was patterned on silicon wafer to develop T-junction shape microchannel using photolithography. Afterward, PDMS prepolymer (Dow Corning Slygard, USA) was prepared in a mixture of 10:1 ratio (bare polymer: curing agent—w/w) and was poured on silicon wafer. The mixture was cured at 100 °C for 4 h on hot plate. Cured PDMS was peeled off from the mold and inlet/outlet holes were punched using a biopsy punch. The outlet diamater was determined based on the outer diameter of tubular PVDF in order to ensure sealing. Then, PDMS microchannel was bonded on glass slide using air plasma treatment at 300 W, 24 °C for 10 s. Microchannel width and height were measured using stylus profilometer (KLA Tencor, P6 Surface Profiler) as 300 and 100 µm, respectively.
Fabrication of Hollow PVDF Fiber: TSR technique required starting
with a preform structure, which was a template for fibers. A preform was prepared by rolling 50 µm PSU films (Ajedium Films) and consolidated the rolled films above the glass transition temperature of PSU (225 °C) for 30 min under 2 × 10⁻² Torr vacuum. Rolled structure
was held under same vacuum conditions and at 180 °C for evacuating the trapped air between film layers, and PSU films were degassed overnight before consolidation process. PVDF films (Ajedium Films—Solvay Plastics) were rolled and inserted in the preform after degassing them overnight under 2 × 10⁻² Torr vacuum at 225 °C. Fiber
drawing temperature was around 240 °C. We fed the preform into the tower furnace with 8 mm min−1 and applied 3 MPa tensile stress via
capstan.
Droplet Generation and Characterization: Droplet size was adjusted
by applying different inlet pressures to dispersed and continuous phase in microchannel. Droplet generation was recorded using high-speed camera (Phantom Miro M310). Image processing software (Image J) was used to calculate droplet size. Microchannel cross section has a rectangular shape. However, when droplets were transferred into the PVDF hollow fiber, the shape of droplets changes due to the circular shape of the tubular PVDF. Therefore, we assumed that the volume of the droplet was proportional to the length of droplets in PVDF fiber. Droplet speed inside the rectangular microchannel was measured using high-speed camera. Then, flow rate of a single droplet was calculated by multiplying cross-sectional area of the microchannel with the speed of the droplet. By dividing that flow rate with cross-sectional area of PVDF fiber, the speed of droplet inside the fiber was calculated.
Electrical Characterization: SCC and OCV measurements were
conducted using Stanford SR-570 Current Preamplifier and Tektronix TDS-1012B Oscilloscope. In cell counting experiments, Stanford SR-830 Lock-in Amplifier was used.
ethanol. At around 75% the signal dropped to 139 mV. B) Biological cell detection in PBS droplet. E. Coli cells were confined in the droplet and were sensed as the droplet drifted in the device. A 16 mV output signal was detected with the system for E. coli cell population of 6.5 × 10⁴ cell mL−1.
Communi
C
a
tion
Acknowledgements
The authors thank M. Girayhan Say for his help. C.E. thanks to partial support from FP7 Marie Curie CIG Agreement No. 322019. The research leading to these results had received funding from the European Research Council under the European Union’s Seventh Framework Programme (FP/2007-2013)/ERC Grant Agreement No. 307357. The author Mehmet Kanik was added as corresponding author on December 14, 2016.
Received: August 24, 2016 Revised: September 24, 2016 Published online: November 4, 2016
[1] W. R. Harper, Contact and Frictional Electrification, Clarendon Press, Oxford, UK, 1967.
[2] X. Shen, A. E. Wang, R. M. Sankaran, D. J. Lacks, J. Electrostat. 2016,
82, 11.
[3] H. T. Baytekin, A. Z. Patashinski, M. Branicki, B. Baytekin, S. Soh, B. A. Grzybowski, Science 2011, 333, 308.
[4] H. T. Baytekin, B. Baytekin, T. M. Hermans, B. Kowalczyk, B. A. Grzybowski, Science 2013, 341, 1368.
[5] H. T. Baytekin, B. Baytekin, J. T. Incorvati, B. A. Grzybowski, Angew.
Chem., Int. Ed. Engl. 2012, 51, 4843.
[6] B. Baytekin, H. T. Baytekin, B. A. Grzybowski, J. Am. Chem. Soc.
2012, 134, 7223.
[7] Z. L. Wang, ACS Nano 2013, 7, 9533.
[8] G. Zhu, J. Chen, T. Zhang, Q. Jing, Z. L. Wang, Nat. Commun. 2014,
5, 3426.
[9] G. Zhu, W. Q. Yang, T. Zhang, Q. Jing, J. Chen, Y. S. Zhou, P. Bai, Z. L. Wang, Nano Lett. 2014, 14, 3208.
[10] Z. L. Wang, G. Zhu, Y. Yang, S. Wang, C. Pan, Mater. Today 2012, 15, 532.
[11] X. Wen, W. Yang, Q. Jing, Z. L. Wang, ACS Nano 2014, 8, 7405. [12] Y. Xie, S. Wang, L. Lin, Q. Jing, Z.-H. Lin, S. Niu, Z. Wu, Z. L. Wang,
ACS Nano 2013, 7, 7119.
[13] C. Xu, Z. L. Wang, Adv. Mater. 2011, 23, 873.
[14] W. Yang, J. Chen, Q. Jing, J. Yang, X. Wen, Y. Su, G. Zhu, P. Bai, Z. L. Wang, Adv. Funct. Mater. 2014, 24, 4090.
[15] Y. Yang, G. Zhu, H. Zhang, J. Chen, X. Zhong, Z. H. Lin, Y. Su, P. Bai, X. Wen, Z. L. Wang, ACS Nano 2013, 7, 9461.
[16] J. Zhong, Q. Zhong, F. Fan, Y. Zhang, S. Wang, B. Hu, Z. L. Wang, J. Zhou, Nano Energy 2013, 2, 491.
[17] Y. Yang, H. Zhang, X. Zhong, F. Yi, R. Yu, Y. Zhang, Z. L. Wang, ACS
Appl. Mater. Interfaces 2014, 6, 3680.
[18] M. Kanik, M. G. Say, B. Daglar, A. F. Yavuz, M. H. Dolas, M. M. El-Ashry, M. Bayindir, Adv. Mater. 2015, 27, 2367.
[19] S. Wang, Y. Xie, S. Niu, L. Lin, Z. L. Wang, Adv. Mater. 2014, 26, 2818. [20] S. Niu, Z. L. Wang, Nano Energy 2014, 14, 161.
[21] G. Zhu, B. Peng, J. Chen, Q. Jing, Z. L. Wang, Nano Energy 2014, 14, 126.
[22] S. Niu, Y. Liu, S. Wang, L. Lin, Y. S. Zhou, Y. Hu, Z. L. Wang, Adv.
Mater. 2013, 25, 6184.
[23] F. Galembeck, T. A. L. Burgo, L. B. S. Balestrin, R. F. Gouveia, C. A. Silva, A. Galembeck, Rsc Adv. 2014, 4, 64280.
[24] J. C. Wilcke, Disputatio Physica Experimentalis, de Electricitatibus
Contrariis, Rostock, 1757.
[25] Z. H. Lin, G. Cheng, S. Lee, K. C. Pradel, Z. L. Wang, Adv. Mater.
2014, 26, 4690.
[26] L. Zheng, Z. H. Lin, G. Cheng, W. Wu, X. Wen, S. Lee, Z. L. Wang,
Nano Energy 2014, 9, 291.
[27] H. R. Zhu, W. Tang, C. Z. Gao, Y. Han, T. Li, X. Cao, Z. L. Wang,
Nano Energy 2014, 14, 193.
[28] Q. Liang, X. Yan, Y. Gu, K. Zhang, M. Liang, S. Lu, X. Zheng, Y. Zhang, Sci. Rep. 2015, 5, 9080.
[29] Y. Sun, X. Huang, S. Soh, Chem. Sci. 2015, 6, 3347.
[30] Z.-H. Lin, G. Cheng, L. Lin, S. Lee, Z. L. Wang, Angew. Chem., Int.
Ed. Engl. 2013, 52, 12545.
[31] L. Zheng, G. Cheng, J. Chen, L. Lin, J. Wang, Y. Liu, H. Li, Z. L. Wang, Adv. Energy Mater. 2015, 5, 1.
[32] J. Chen, J. Yang, Z. Li, X. Fan, Y. Zi, Q. Jing, H. Guo, Z. Wen, K. C. Pradel, S. Niu, Z. L. Wang, ACS Nano 2015, 9, 3324.
[33] T. Jiang, L. M. Zhang, X. Chen, C. B. Han, W. Tang, C. Zhang, L. Xu, Z. L. Wang, ACS Nano 2015, 12562.
[34] Y. Xie, S. Wang, S. Niu, L. Lin, Q. Jing, Y. Su, Z. Wu, Z. L. Wang,
Nano Energy 2014, 6, 129.
[35] H. Zhou, S. Yao, Lab Chip 2013, 13, 962.
[36] X. Li, M. H. Yeh, Z. H. Lin, H. Guo, P. K. Yang, J. Wang, S. Wang, R. Yu, T. Zhang, Z. L. Wang, ACS Nano 2015, 9, 11056.
[37] T. Huang, M. Lu, H. Yu, Q. Zhang, H. Wang, M. Zhu, Y. Hu, Y. Zhang, C. Xu, G. Zhu, Z. L. Wang, Y. Qi, Q. Yu, Y. Qi, M. C. McAlpine, X. Yang, Y. Yang, G. Zhu, G. Zhu, G. Zhu, P. Bai, J. Chen, Z. L. Wang, Q. Zhong, X.-S. Zhang, Y. Yang, Y. Yang, J. Zhong, S. Wang, L. Lin, Z. L. Wang, J. Chen, Y. Hu, H. Zhang, Y. Yang, J. Yang, L. Lin, S. Lee, Y. Yang, F.-R. Fan, Z.-Q. Tian, Z. L. Wang, F.-R. Fan, G. Zhu, P. Bai, G. Cheng, Z.-H. Lin, L. Lin, Z.-l. Du, Z. L. Wang, T.-C. Hou, W. Tang, B. Meng, H. X. Zhang, Y. Xie, Y. Su, Y. Dzenis, D. Li, Y. N. Xia, K. Sawicka, P. Gouma, A. Greiner, J. H. Wendorff, W. E. Teo, S. Ramakrishna, Y. B. Zheng, A. F. Diaz, R. M. Felix-Navarro, S. Niu, A. Lerf, H. Y. He, M. Forster, J. Klinowski, T. Szabo, K. Kashiwagi, X. Li, D. H. Reneker, I. Chun, A. Frenot, I. S. Chronakis, Z.-M. Huang, Y. Z. Zhang, M. Kotaki, S. Ramakrishna, W. S. Hummers, R. E. Offeman, Sci. Rep. 2015, 5, 13942.
[38] S.-Y. Teh, R. Lin, L.-H. Hung, A. P. Lee, Lab Chip 2008, 8, 198. [39] A. Huebner, S. Sharma, M. Srisa-Art, F. Hollfelder, J. B. Edel,
A. J. Demello, Lab Chip 2008, 8, 1244.
[40] X. Niu, F. Gielen, J. B. Edel, A. J. deMello, Nat. Chem. 2011, 3, 437.
[41] M. Takinoue, S. Takeuchi, Anal. Bioanal. Chem. 2011, 400, 1705. [42] B. R. Fonslow, B. D. Stein, K. J. Webb, T. Xu, J. Choi, S. Kyu,
J. R. Yates 3rd, Nat. Methods 2013, 10, 54.
[43] X. Casadevall i Solvas, A. J. deMello, Chem. Commun. 2011, 47, 1936.
[44] E. Brouzes, M. Medkova, N. Savenelli, D. Marran, M. Twardowski, J. B. Hutchison, J. M. Rothberg, D. R. Link, N. Perrimon, M. L. Samuels, Proc. Natl. Acad. Sci. USA 2009, 106, 14195.
[45] H. Hu, D. Eustace, C. A. Merten, Lab Chip 2015, 15, 3989.
[46] T. R. Kline, M. K. Runyon, M. Pothiawala, R. F. Ismagilov, Anal.
Chem. 2008, 80, 6190.
[47] J. Q. Boedicker, L. Li, T. R. Kline, R. F. Ismagilov, Lab Chip 2008, 8, 1265.
[48] T. W. Hofmann, S. Hänselmann, J.-W. Janiesch, A. Rademacher, C. H. J. Böhm, Lab Chip 2012, 12, 916.
[49] M. Marcali, C. Elbuken, Lab Chip 2016, 9, 2494.
[50] Y. Jie, N. Wang, X. Cao, Y. Xu, T. Li, X. Zhang, Z. L. Wang, ACS Nano
2015, 9, 8376.
[51] H. Zhang, Y. Yang, T.-C. Hou, Y. Su, C. Hu, Z. L. Wang, Nano Energy
2013, 2, 1019.
[52] M. Kanik, O. Aktas, H. S. Sen, E. Durgun, M. Bayindir, ACS Nano
2014, 8, 9311.
[53] A. Yildirim, M. Yunusa, F. E. Ozturk, M. Kanik, M. Bayindir, Adv.
Funct. Mater. 2014, 24, 4569.
[54] A. F. Abouraddy, M. Bayindir, G. Benoit, S. D. Hart, K. Kuriki, N. Orf, O. Shapira, F. Sorin, B. Temelkuran, Y. Fink, Nat. Mater.