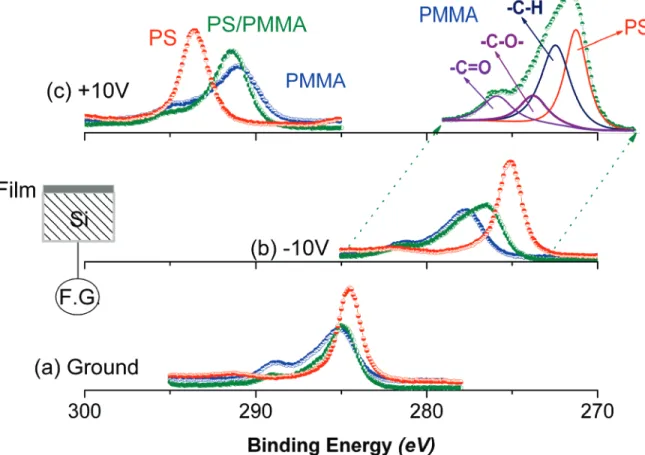
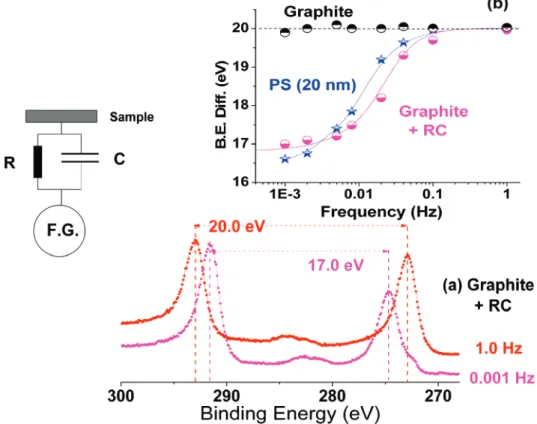
Charging / discharging of thin PS / PMMA films as probed by dynamic x-ray photoelectron spectroscopy
Tam metin
Şekil
Benzer Belgeler
Her past medical history revealed that she has undergone right radical nephrectomy in 2007, due to a 11 x 12 x 13 cm renal mass that was then reported as renal cell carcinoma
The North, on the other hand, ignores the fact that an initially higher investment in physical capital (hence in knowledge stock) at the expense of lower Northern consumption may
In our numerical analysis, we find that Turkey suffers from welfare losses in case of domestic abatement policies and these losses tend to decrease when the EU applies a higher
We explore layered materials, consisting of alternating layers of zinc blende half-metals, by first principles calculations, and find that superlattices of (CrAs) 1 (MnAs) 1 and
13 transcriptome data revealed that the CpG ODN exerted an opposite effect on expressions of some mTOR-related genes, such as Stat3 and Myc (Fig. 3), just as expected given the
In order to make the 쐓 ␣ -products consistent with the introduced formalism of grain structures, we assume that vector fields X x are such that formula 共2.5兲 is valid, i.e., X
The agent’s optimal choice of effort x∗ is increasing in the parameter , provided that his return from effort, Rx , is supermodular in and x.10 Throughout this paper, we
This thesis discusses the extent to which neoliberal globalization has had an impact on citizenship in general, and citizenship in Turkey in particular. Academic debates
