CAUSES OF BANKING CRISES: TESTING INEQUALITY AND FINANCIAL DEREGULATION DIRECTLY
A Master’s Thesis
by
ERAY KAAN KARABULUT
Department of Economics İhsan Doğramacı Bilkent University
Ankara September 2020 ERAY K AA N K ARABULU T C AU S ES OF B AN KI NG C R ISES : TES TI NG B il ke nt Univer sit y 2020 IN EQ UA L IT Y A N D FI NA NCIA L D EREG UL A TI ON DI R ECTLY
To My Family for nursing me with affection and love and their dedicated partnership for success in my life
i
CAUSES OF BANKING CRISES: TESTING INEQUALITY AND FINANCIAL DEREGULATION DIRECTLY
The Graduate School of Economics and Social Sciences of
İhsan Doğramacı Bilkent University
by
ERAY KAAN KARABULUT
In Partial Fulfillment of the Requirements for the Degree of MASTER OF ARTS IN ECONOMICS
THE DEPARTMENT OF ECONOMICS
İHSAN DOĞRAMACI BİLKENT UNIVERSITY ANKARA
iii
ABSTRACT
CAUSES OF BANKING CRISES: TESTING INEQUALITY AND FINANCIAL DEREGULATION DIRECTLY
Karabulut, Eray Kaan M.A., Department of Economics Supervisor: Associate Prof. Dr. Fatma Taşkın
September 2020
I perform an empirical analysis to investigate the direct effect of income inequality and financial deregulation on the occurrence of systemic banking crises based on a panel of 133 countries over the period 1970–2018. Differently from earlier empirical studies, this study focuses both on income inequality and financial deregulation levels. Findings based on a multivariate logit model to estimate the probability of systemic banking crisis do not provide any reliable evidence for the existence of a direct relationship between the
various measures of inequality and the occurrence of banking crises. I also find that there is no direct link between financial liberalization and the occurrence of banking crises. Furthermore, my analysis shows that income inequality and financial deregulation do not act together to directly impact the likelihood of banking crises. However, this study provides evidence that the reduction of banking capital regulations and prudential supervision may increase the likelihood of banking crisis in the short run. Additionally, the results of this study support the previous findings in the literature that the level of private credit is the most robust predictor of the systemic banking crises.
Keywords: Banking Crises, Credit Booms, Financial Deregulation, Financial Liberalization, Income Inequality
iv
ÖZET
BANKA KRİZLERİNİN SEBEPLERİ: EŞİTSİZLİĞİ VE FİNANSAL SERBESTLEŞMEYİ DOĞRUDAN SINAMA
Karabulut, Eray Kaan Yüksek Lisans, İktisat Bölümü Tez Danışmanı: Doçent Dr. Fatma Taşkın
Eylül 2020
Gelir eşitsizliğinin ve finansal serbestleşmenin sistemik banka krizlerine doğrudan etkisini araştırmak amacıyla 133 ülkenin 1970-2018 tarihleri arasında incelendiği bir ampirik analiz gerçekleştirilmiştir. Önceki ampirik araştırmalardan farklı olarak, bu araştırma hem gelir eşitsizliği hem de finansal serbestleşme seviyelerine odaklanmıştır. Banka krizi ihtimalini hesaplamak için çok değişkenli logit modeline dayanan bulgular, gelir eşitsizliği ve sistemik banka krizleri arasında doğrudan bir ilişkinin varlığına dair herhangi bir güvenilir kanıt sağlamamaktadır. Finansal liberalleşme ve banka krizleri arasında da doğrudan bir bağlantı bulunmamıştır. Ayrıca, analizim gelir eşitsizliği ve finansal serbestleşmenin banka krizi ihtimalini doğrudan etkilemek üzerine beraber hareket etmediğini göstermiştir. Ancak bu çalışma banka sermaye yönetmeliklerinin ve ihtiyatlı denetimlerinin hafifletilmesinin kısa vadede banka krizi ihtimalini
arttırabileceğine dair kanıt sağlamaktadır. İlaveten, bu çalışmanın sonuçları özel kredi seviyesinin sistemik banka krizlerini en güçlü tahmin eden unsur olduğuna dair literatürdeki önceki bulguları desteklemektedir.
Anahtar Kelimeler: Banka Kredileri, Ekonomik Kriz, Finansal Deregulasyon, Finansal Serbestleşme, Kazanç Eşitsizliği
v
ACKNOWLEDGEMENTS
I would like to express my sincere gratitude and appreciation to Assistant Professor Banu Pakel, who has the substance of a genius: she convincingly guided and encouraged me to be professional and do the right thing even when the road got tough. Without her patient and persistent help, the goal of this project would not have been realized. Her willingness to give her time so generously has been very much appreciated.
I would like to express my gratitude to, Associate Professor Fatma Taşkın, whose expertise and useful critiques was invaluable in formulating the research questions and methodology. Her insightful feedback pushed me to sharpen my thinking and brought my work to a higher level.
I would like to pay my special regards to Dr. Mustafa Eray Yücel for giving his
invaluable time and effort anytime I need help. It is whole-heartedly appreciated that your great advice and continued support for my study proved monumental towards the success of this study.
I would like to thank Associate Prof. Dr. Burcu Fazlıoğlu for her invaluable comments. I wish to acknowledge the support and great love of my family. Thank you for being always there for me. I would also like to extend my thanks to my friends.
I would also like to thank TÜBİTAK for providing me a valuable support as a part of “TÜBITAK 2211 Yurt İçi Lisansüstü Burs Programı” during my master’s program. Without their support and funding, this project could not have reached its goal.
vi
TABLE OF CONTENTS
ABSTRACT ... iii ÖZET ... iv ACKNOWLEDGEMENTS ... v TABLE OF CONTENTS... viLIST OF TABLES ... vii
CHAPTER 1 INTRODUCTION ... 1
CHAPTER 2 LITERATURE REVIEW ... 4
2.1. THEORETICAL LITERATURE: INEQUALITY, DEREGULATION, CREDIT AND BANKING CRISES . 4 2.2. EMPIRICAL EVIDENCE ... 7
2.2.1. INEQUALITY, HOUSEHOLD CREDIT AND CRISES ... 8
2.2.2. FINANCIAL DEREGULATION AND CRISES ... 10
CHAPTER 3 DATA... 12
CHAPTER 4 EMPIRICAL SPECIFICATION ... 16
CHAPTER 5 RESULTS ... 20
CHAPTER 6 ROBUSTNESS AND SENSITIVITY ANALYSIS ... 24
6.1. LOGIT WITH RANDOM EFFECTS ESTIMATION RESULTS ... 24
6.2 ESTIMATION RESULTS WITH GINI INDEX ... 26
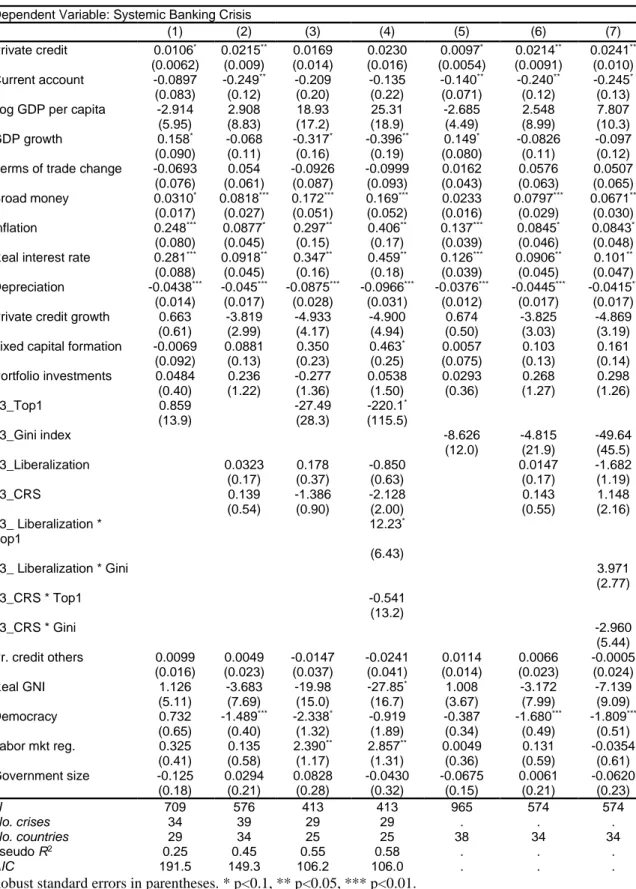
6.3 INCLUDING ADDITIONAL CONTROL VARIABLES ... 30
6.4 EXCLUSION OF THE FIRST FIVE YEARS FOLLOWING A BANKING CRISIS ... 31
6.5 ALTERNATIVE ROBUST STANDARD ERRORS ... 31
6.6 INCLUDING TIME-FIXED EFFECTS ... 31
6.7 LINEAR PROBABILITY MODEL ESTIMATION RESULTS ... 33
CHAPTER 7 DISCUSSION AND CONCLUSION ... 35
REFERENCES ... 39
vii
LIST OF TABLES
1. Table 1: Results for logit estimation with fixed effects for the first lags of top 1% income share and financial deregulation………22 2. Table 2: Results for logit estimation with random effects for the first lags of top
1% income share and financial deregulation……….25 3. Table 3: Results for logit estimation with fixed effects for the first lags of Gini
index and financial deregulation………27 4. Table 4: Results for logit estimation with random effects for the first lags of Gini
index and financial deregulation………28 5. Table 5: Including additional controls: Results for logit estimation with fixed
effects for the third lags of inequality and financial deregulation……….29 6. Table 6: Decade fixed effects: Results for logit estimation with fixed effects for
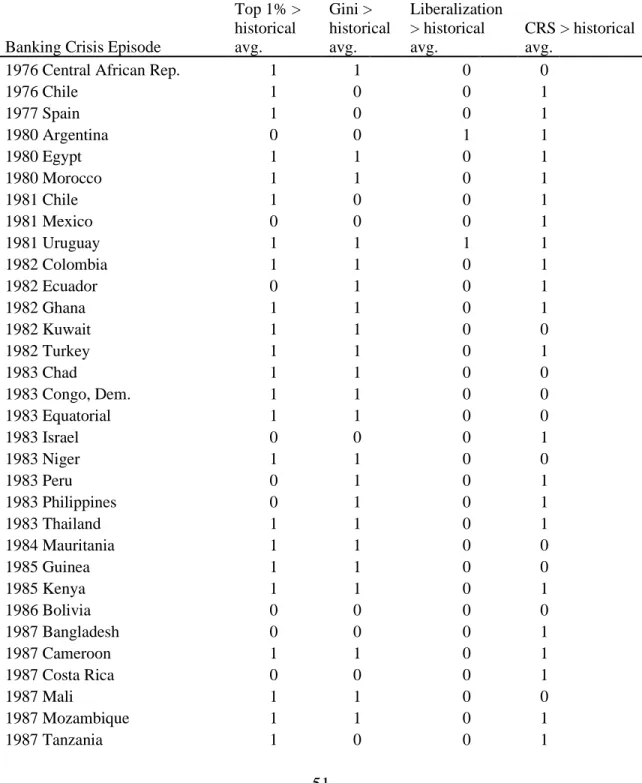
the first lags of Gini index and financial deregulation………….………..32 7. Table 7: Results for Linear Probability Model estimation with fixed effects for the first lags of top 1% income share and financial deregulation ………...………....34 8. Table A1: Data descriptions and sources………...45-46 9. Table A2: Descriptive statistics……….47 10. Table A3: Correlation matrix………..……….48-50 11. Table A4: The list of banking crisis episodes and indicator of whether the
variables of interest are higher than their historical average for a given country in the year preceding the crisis episode, if higher equals 1, otherwise equals 0..51-55 12. Table A5: Average Marginal Effects for logit estimation with fixed effects for the first lags of top 1% income share and financial deregulation ………….……….56
viii
13. Table A6: Results for logit estimation with random effects for the fifth lags of top 1% income share and financial deregulation……….57 14. Table A7: Results for logit estimation with fixed effects for the first lags of top
1% income share and financial deregulation (First 5 years after the onset of banking crises are dropped)………...58 15. Table A8: Results for logit estimation with fixed effects for the fourth lags of top
1% income share and financial deregulation (First 5 years after the onset of banking crises are dropped)………...59 16. Table A9: Results for logit estimation with fixed effects for the fifth lags of top
1% income share and financial deregulation (First 5 years after the onset of banking crises are dropped)………...60 17. Table A10: Results for logit estimation with random effects for the first lags of
top 1% income share and financial deregulation (First 5 observations after the onset of banking crises are dropped)……….61 18. Table A11: Results for logit estimation with fixed effects for the third lags of
inequality and financial deregulation (using bootstrapped robust errors)……….62 19. Table A12: Results for logit estimation with random effects for the first lags of
1
CHAPTER 1
INTRODUCTION
The global crisis in 2008 was a grim reminder of the unpredictable nature of banking crises as it took the world by surprise. At its aftermath, a great deal of study has been focused on its underlying causes and the nature of banking crises and their history (see for instance Milanovic, 2009; Stiglitz, 2012; Gorton, 2012; Krugman, 2007; Kumhof, Rancière & Winant, 2015; Rajan, 2010; Reinhart and Rogoff, 2009, 2013; Van Treeck, 2014; Galbraith, 2012; Palley, 2012 among others). A considerable number of authors argue that economic inequality and deregulated financial markets are the origin of the crisis, pointing out the rise in economic inequalities almost coincidental with financial deregulations and reforms in the several decades leading up to 2008 crisis.
The main argument in these claims is that high and increasing inequality and financial deregulation together contribute to unsustainable credit booms, which is widely recognized as the ultimate driver of banking crises. The differences in the arguments largely stem from the tail of wealth/income distribution which the deregulatory pressure comes from and whether inequality or deregulation comes first. Nonetheless, there is a claim widely argued in theoretical literature that economic inequality and deregulated financial sector can explain the occurrence of banking crises (i.e. Bazillier and Hericourt, 2017; Kumhof et al., 2015; Van Treeck, 2014).
2
The central question in this debate is what channels inequality and financial deregulation work through to affect the occurrence of banking crises.1 This study focuses on whether inequality and financial deregulation directly affect the occurrence of banking crises. Notwithstanding the abundance of debates in the theoretical literature, empirical research on the inequality-financial deregulation-crisis relationship is scant.2 Surprisingly, despite the plethora of empirical studies on the relationship between financial liberalization and banking crises and on the relationship between inequality and banking crises, there is no study, to my knowledge, focuses on how inequality and financial deregulation together directly affect the likelihood of banking crisis.3,4,5 Moreover, the literature on banking crises does not reach a consensus on whether inequality has a direct effect or on the channels that inequality works through. Consequently, there remains a considerable gap between theoretical work and empirical research since the question that whether
inequality and financial deregulation act together to directly affect the incidents of the banking crises has not been empirically answered yet. This study aims to fill this gap by empirically investigating the direct link between inequality, financial deregulation and the occurrence of systemic banking crises.
First, I present a summary of the theoretical and empirical literature providing explanations on the relationship between inequality, financial deregulation and the incidents of systemic banking crises. Then I perform an empirical analysis using
multivariate logit models based on an unbalanced panel of 133 countries over the period
1 See the exhaustive surveys on inequality-deregulation-crisis nexus by Van Treeck & Sturn (2012), Van
Treeck (2014), Bazillier & Hericourt (2017).
2 Empirical literature is rather focused on the early warning systems that determines the indicators of
“financial fragility” (see surveys by Davis and Karim, 2008 and Demirgüç-Kunt and Detragiache, 2005).
3 As for the relationship between financial deregulation and banking crises, see for instance Shehzad and
De Haan, (2009), Angkinand et al. (2010), Lee et al. (2016), Hamdaoui (2017), Amri, Angkinand, and Wihlborg (2011), Majerbi and Rachdi (2015).
4 As for the relationship betweeninequality and banking crises, see for instance Atkinson and Morelli
(2010, 2011, 2015), Bordo and Meissner (2012), Kirschenmann et al. (2016), Roy and Kemme (2012), Bellettini et al. (2019).
5 Only Perugini et al. (2016) investigated the indirect effect of inequality and financial deregulation on
banking crises via private credit expansion, whereas I am aware of no study focusing on the direct effect of these two variables on banking crises. Bellettini et al. (2019), focusing solely on the link between inequality and banking crises, used a credit regulation measure as a control variable. However, it can be argued that this measure is insufficient to account for financial deregulation.
3
1970–2018 to investigate the direct effects of income inequality and financial
deregulation on the likelihood of banking crises. Differently from other studies, I focus both on income inequality and financial deregulation levels, but I also include the
interaction effects between these two. I measure financial deregulation by employing two distinct indicators from Abiad et al. (2008), namely total financial liberalization and banking capital regulations and prudential supervision (CRS).
I find that level of inequality, financial liberalization and the interaction term between inequality and financial deregulation measures are not directly associated with the occurrence of banking crises. But I find weak evidence suggesting that relaxed CRS might increase the likelihood of banking crisis in the short run. Moreover, I find that systemic banking crises are driven most robustly by high levels of private credit. These findings are reinforced by a series of robustness checks, such as using different
estimation methods, using different measures of inequality, inclusion of additional control variables, exclusion of five years after the onset of banking crisis and using alternative error calculation methods.
The contribution of this study to the literature is twofold. First, on the conceptual side, I provide a review and discussion of the existing knowledge on the policy-related
determinants of banking crises, focusing on inequality and financial deregulation. Second, on the empirical side, differently from other studies, I focus on the direct link between financial deregulation, inequality and the occurrence of banking crises. While doing this, I depart from earlier studies by (i) examining the interaction effects between financial deregulation and inequality for the first time, (ii) employing fixed effects logit model, which allows me to account for the unobserved and imperfectly measured factors specific to countries and time periods, (iii) adopting a more encompassing and preferable measure of financial deregulation from Abiad et al. (2008), (iv) considering larger set of control variables found to be potential determinants of banking crises, and (v)
considering much more inclusive and larger country coverage, thereby alleviating sample selection bias.
4
CHAPTER 2
LITERATURE REVIEW
2.1. THEORETICAL LITERATURE: INEQUALITY, DEREGULATION, CREDIT AND BANKING CRISES
As for the theoretical literature considering the structural factors that might have led economies to experience banking crises, there has been a proliferation of analyses on inequality and financial deregulation as the culprits. It is widely argued that not the inequality itself, but households’ and government’s reactions to high income inequality may have caused the financial crisis, i.e. credit booms, current account deficits.
On the supply side, Rajan (2010) and Milanovic (2009, 2010) argue that rising income inequality induced governments to devise new policies aimed at raising demand. The US government responded by deregulating credit markets and expanding the lending of state-owned mortgage agencies to low- and middle-income households. In addition to
government’s reaction to inequality, Milanovic also states that towering accumulations of wealth at the top of the distribution created a glut of funds seeking profitable investment. Overwhelmed by the volume of funds seeking investment relative to profitable
opportunities, financial sector turned to more aggressive and reckless, “basically
throwing money at anyone who would take it” (Milanovic, 2010: 194). Likewise, Stiglitz (2012) argued that high inequality can cause an unsustainable credit boom via negative
5
effects on human capital because of limited access to higher education and via the political process by lobbying. Furthermore, Atkinson and Morelli (2011) points out that banks take bigger risks through securitization when inequality is high.
On the demand side, Stiglitz (2009, 2012) and Fitoussi and Saraceno (2010, 2011) argued that faced with decades-long stagnating real incomes, consumers in the lower part of the distribution sought to keep track with their expected living standard by borrowing.6 The resulting credit bubble and large current account deficits in a deregulated and weakly supervised financial sector then proved unsustainable, and paved the way for the banking crisis.
Frank, Levine and Dijk (2010) tried to explain a similar chain reaction through which changes in permanent income inequality could cause expansion of household debt. Based on Duesenberry's (1949) relative income hypothesis and some behavioral findings on demonstration effects, their model demonstrates the mechanism that households emulate the consumption level and habits of the slightly wealthier, thereby triggering 'expenditure cascades', and eventually causing unsustainable expansion in household debt.
On the other hand, Acemoğlu (2011) posits an alternative hypothesis claiming that it was politics that drove both income inequality and the banking crisis. However, Acemoğlu does not associate income inequality with political influence of the opulent. Additonally, Krugman (2010) claims that both rising inequality and banking crises might be the joint result of a third, causal, factor. It has been argued that the likelihood of crises and inequality can increase as a result of financial deregulation.7 In the meanwhile, financial deregulation may have contributed to the rise in inequality by providing wider range of gains to the financial sector (see Philippon and Reshef, 2008).
6Iacoviello (2008) shows by a quantitative dynamic model that there is a clear relationship between the US
wage inequality and volatility and household debt to disposable income since 1960’s, and this relation explains both the trend and the cycle of household leverage.
7 As for financial deregulation affecting inequality, see for instance Agnello et. al, 2012a, b; Levine, 2005;
Beck et al., 2007; De Haan & Sturm, 2017. As for financial deregulation affecting the likelihood of crises, see for instance Shehzad & De Haan, 2009; Angkinand et al., 2010; Lee et al., 2016; Hamdaoui, 2017.
6
The theories about the link between inequality and crises described above are formalized by Kumhof et al. (2015). They develop a dynamic stochastic general equilibrium (DSGE) model with investors (the top 5 % of income earners) and workers, in which investors own the whole stock of physical capital and derive income from the physical capital and from interest on loans. A decrease in the bargaining power of workers causes higher income inequality as the real wages of workers decline. As workers’ real income declines, they borrow more to maintain their level of consumption. At the same time, sustained gains that are going disproportionately to the affluent investors are reinvested within the financial market in the form of loans to workers. As a result, a trending link between income inequality and leverage occurs, where higher income inequality levels drive the size of the financial sector to expand in relation to the rest of the economy. Finally, as the leverage of the household and financial sector accumulates, the likelihood of a financial crisis increases. When the bargaining power of workers decrease income inequality tends to grow rapidly, whereas their leverage, specifically the debt-to-real income ratio, grows more slowly because borrowing only covers the falling real income of workers as workers only try to maintain their level of consumption, not to increase it. Thus, credit and income inequality have a long-run, trending relationship.
Extending their DSGE model to an open economy, Kumhof et al. (2012) show that, in highly developed financial markets, rising inequality endogenously causes credit growth by increasing current account deficits as the low-income households borrowing from the rich and from foreign lenders to finance their consumption.8 This finding is supported empirically by results from an Autoregressive Distributed Lag analysis of 18 OECD countries during the period 1968–2008, in which an increase in top income shares gave rise to current account deficit. Furthermore, capital inflows can also provide low interest rates and further fuel the bubbles in financial and property markets while also allowing bigger current account deficits.
What unites all the above-mentioned theoretical arguments is that they point out a trending long-run association between inequality, deregulation, leverage, and banking
8 Skidelsky (2009) and Stockhammer (2015) similarly argue that the global saving glut financed extra
7
crises. Moreover, some arguments assert that inequality and financial deregulation may cause current account deficits and lax monetary policies that lead to banking crises. Furthermore, many of the studies claim that inequality and financial deregulation
reinforce each other and act together to increase the likelihood of banking crisis episodes. Thus, these arguments claim that the roots of the banking crises can be found in long-run structural changes in income distribution and government policies that allow for
deregulation.
2.2. EMPIRICAL EVIDENCE
While empirical literature identified a number of policy-related contributing features, there is no consensus on the determinants of the occurrence of banking crises and how they interact with each other. The point that the literature has the greatest consensus is the importance of the link between credit booms that have gone bust and banking crises (i.e. Elekdag & Wu, 2011; Jord`a et al., 2011, 2013a, b; Mendoza & Terrones, 2008;
Schularick & Taylor, 2012). Recent research has taken one step further and highlighted that, particularly in developed countries, household credit boom is the key driver of the boom and bust dynamics (i.e. Büyükkarabacak & Valev, 2010).
Apart from credit booms, a number of structural features are suggested as the underlying causes of banking crises: inequality, quality of institutions, explicit deposit insurance and institutional arrangements such as financial liberalization, financial regulatory structures, quality of supervision, legal systems and exchange rate regimes.9 However, there is no consensus on how those factors interact with each other, and even the direction and significance of the effects of some are still being discussed. For instance, empirical literature provides inconclusive results on the effects of financial reforms on financial stability and crises (i.e. Lee et al., 2016; Hamdaoui, 2017).
Despite the abundance of theoretical arguments on how inequality and financial deregulation might influence the occurrences of banking crisis, only a few empirical studies investigated the channels which those two can work through. Empirical findings
9 See, for example, Angkinand et al. (2010) on the effect of financial liberalization and bank regulation on
8
in the literature, in fact, tend to be ambiguous on the direct link between inequality and the likelihood of a banking crisis, and on the direct link between financial deregulation and the probability of a banking crisis. Most importantly, to my knowledge, despite the abundance of theoretical considerations, the direct link between inequality, deregulation and their interaction effects with banking crises has not been investigated together. Consequently, there is a considerable gap between theoretical work and empirical research on this issue.
2.2.1. INEQUALITY, HOUSEHOLD CREDIT AND CRISES
Income inequality has received increasing attention as a possible underlying driver of banking crises in recent years. Atkinson and Morelli (2010, 2011) carried out two of the first systematic empirical investigations into the direct relationship between income inequality and banking crises. The authors did not detect any conclusive evidence on relation between short-run changes in income inequality and the occurrence of banking crises. Similarly, Bordo and Meissner (2012) conclude that while financial crises are preceded by total bank credit growth in the previous two to five years, change in income inequality is not a significant predictor of credit expansions. More recently, Atkinson and Morelli (2015) test both the “growth” and the “level” hypotheses10 by comparing
inequality before the crisis to a country's own history and to the average of other countries, and did not find any link between inequality and crises.
Other studies, however, find evidence supporting the proposed direct relationship
between inequality and financial crisis. Belletini and Delbono (2013) find that majority of banking crises in their sample was preceded by persistently high long-run levels of Gini coefficient. Gu and Huang (2014) show that income inequality Granger causes credit growth in financialized economies and rising income inequality is one of the significant determinants of banking crises. Roy and Kemme (2012) find that increasing debt of the private sector, real estate bubbles and rise in income inequality in the preceding three years are most robust predictors of banking crises. Kirschenmann et al. (2016) find that
10The “growth” hypothesis claims that the main driver of crises and credit booms is the upward change in
inequality, while the “level” hypothesis claims that the change in inequality would not make an impact unless the level of inequality is already high, and measuring changes eliminates the long-run relationship between the variables of interest.
9
the yearly change in income inequality have some predictive power over and above credit growth.
Furthermore, based on a panel of 18 OECD countries over the period 1970-2007, Perugini et al. (2016) show that high levels of top income shares significantly raise private sector leverage, which, in turn, significantly predicts banking crises. As opposed to the theoretical predictions, they find the interaction term between inequality and their financial liberalization measure insignificant in predicting private credit levels.11
However, Perugini et al. (2016) did not consider the direct link between income
inequality, financial deregulation and banking crises. Most recently, based on a panel of 33 advanced countries during the period 1970-2011, Bellettini et al. (2019) find that high level of income inequality significantly increases the likelihood of banking crisis.
Furthermore, Bellettini et al. (2019) find that their financial liberalization measure is insignificant in directly predicting banking crises.
The measure of financial deregulation in both of these studies, credit regulation index (5A) from the Fraser Institute on the Economic Freedom of the World database
(Gwartney et al., 2016), does not account for capital account and equity market liberalizations and regulations. Moreover, an indicator of supervisory and regulatory aspects of financial reforms is absent in both studies.12 Therefore, it can be argued that their measure may be failing to account for some crucial elements of the structure of financial sector.
In short, the empirical research on the link between inequality and banking crises largely focuses on changes rather than levels, while the theoretical and empirical background (Iacoviello, 2008; Kumhof et al., 2012, 2015; Malinen, 2016) strongly argue that the long-run relationship is crucial between inequality and banking crises. Consequently, the use of the growth rate of income inequality alone removes the long run trend, and may lead to biased inference (Klein, 2015). Therefore, the level of income inequality is the suitable measure for this study.
11 To my knowledge, Perugini et al. (2016) is the only study so far that has considered this interaction.
12 Importance of supervisory and regulatory measures for the relationship between financial reforms and
10
2.2.2. FINANCIAL DEREGULATION AND CRISES
The theoretical literature does not suggest a simple prediction about the effect of financial deregulation on the likelihood of banking crises. On one hand, it is argued that financial liberalization leads to economic growth via financial development, strengthening economic and financial stability. On the other hand, financial deregulation exacerbates financial instabilities since it promotes excessive risk taking. Similarly, the empirical literature cannot get a single conclusive result. The most of the recent publications state that the financial deregulation-banking crisis nexus is still a very relevant and unsettled debate (see for instance Shehzad and De Haan, 2009; Angkinand et al., 2010; Lee et al., 2016; Hamdaoui, 2017).
Some studies observed a positive association between various types of financial liberalization reforms and banking crises (i.e. Kaminsky & Reinhart, 1999; Ranciere, Tornell & Westermann, 2006; Weller, 2001). Demirgüç-Kunt and Detragiache (1998) find that domestic financial liberalizations proxied by the announcement date of interest rate liberalizations are positively associated with subsequent banking crises. They also show that this association is weaker for the countries with a strong institutional
environment. Later they suggest that financial liberalization triggers crisis when it causes excessive risk taking due to increased competition (2001).
On the other hand, more recent studies invalidate the dominant view in the empirical literature that financial liberalization reform of any type hurts the financial stability. Bonfiglioli (2008) shows that de jure openness is not a significant predictor of systemic banking crisis. Baier et al. (2012) and Barth, Caprio and Levine (2004) find evidence suggesting that countries with a high degree of economic freedom are less likely to experience a banking crisis. Moreover, Beck, Demirgüç-Kunt and Levine (2006) suggest that the occurrence of banking crises is less likely when there are fewer regulatory restrictions on bank competition and activities, banking systems are more concentrated, and national institutions encourage more competition. Lee et al. (2016) support the claims that financial liberalization significantly negatively associated with financial crises. Joyce (2011) shows that countries with more open capital regimes are less likely to have
11
banking crisis, but countries with a current account deficit are more likely to experience banking crises.
Consequently, the overall picture that emerges from the empirical literature review suggests that financial liberalization-banking crisis relationship remains inconclusive. The conflicting wide range of results in the literature might be stemming from the omitted variables and from using imperfect measures as a small part of the recent literature show the importance of some missing or uncontrolled conditions, such as supervision, regulation, and a stable environment can make all the difference in the results. Shehzad and De Haan (2009) found that conditional on adequate banking supervision control, liberalization reduces the likelihood of systemic crises for a broad sample of developed and developing countries. Noy (2004) shows that insufficient prudential supervision of the banking sector coupled with financial liberalization causes excessive risk taking by financial intermediaries. As a result, banking crises occur in the medium run. Similarly, Majerbi and Rachdi (2015) find that stricter banking regulation and supervision, better law and order, government stability, lack of corruption and bureaucratic efficiency generally reduces likelihood of banking crisis. Barrell et al. (2010) also find that bank regulation and supervision is negatively linked to banking crisis. Likewise, Angkinand et al. (2010) find that the likelihood of banking crisis is increasing with financial liberalization when the country has weak capital regulations and supervision (CRS).
Moreover, literature on the relationship between financial deregulation and banking crises do not consider inequality at all. However, the literature points out that inequality and financial deregulation affect each other and may affect the likelihood of the crises (see Agnello et. al, 2012a, b; Levine, 2005; Beck et al., 2007; De Haan & Sturm, 2017 among others). Therefore, empirical research omitting inequality when predicting banking crises would be likely to suffer from omitted variable bias. Consequently, the literature on financial deregulation-banking crisis nexus has missed crucial determinants of banking crises when investigating the issue thus far.
12
CHAPTER 3
DATA
I use the onset of the systemic banking crisis dates in Laeven and Valencia (2018), which regarded as the most accurate dataset on banking crises (Chaudron & de Haan 2014).13 In the most recent, comprehensive and quantitative definition of banking crises, Laeven and Valencia (2018) define both systemic and borderline banking crises. They define a banking crisis as systemic if two conditions are met: There are (1) “significant signs of financial distress in the banking system” (indicated by significant bank runs, losses in the banking system, and bank liquidations); and (2) “significant banking policy intervention measures in response to significant losses in the banking system.” The first year that both conditions are met considered as the onset of the systematic banking crisis.14
Level of economic inequality is measured by the top 1% income shares before taxes and transfers collected from the WID, The World Wealth and Income Database (Alvaredo et al.).15 To perform robustness tests, the gross Gini index from the Standardized World
13Other sources of banking crises data are Caprio et al. (2005) and Reinhart and Rogoff (2009).
14 The list of banking crisis episodes and whether the variables of interest are higher than their historical
average for a given country in the year preceding the crisis episode are listed in TableA4 in the Appendix.
15 Few missing observations are imputed by averaging the values preceding and following the missing
13
Income Inequality Database (SWIID) compiled by Solt (2020), is used as an alternative measure of inequality.16
All income measures here are market incomes (pre-tax and transfers), whereas disposable income measure would be preferable since it bears more significantly on household consumption, investment and borrowing decisions. Nevertheless, I chose market income measures for three reasons. First, data on net income measures over time are currently very limited. Second, gross and net income inequality measures mimic similar trends in the distribution of income (see Malinen, 2016: 312, fn. 3). Third, market top income shares provide an excellent insight into income concentration at the top of the
distribution, which is the crucial point in theoretical channels presented above such as the ideas of relative income and consumption cascade effects. This also makes the top
income shares well-suited measure of income inequality for this study. Lastly, this choice also guarantees consistency vis-à-vis the existing inequality-banking crisis literature. Financial deregulation can be described as ‘a set of measures directed to reducing the role of government and relaxing controls on activities of agents in different segments of the financial sector’. I use the following six dimensions from Abiad et al. (2008)17 to capture de jure liberalization of different types of restrictions and controls: (1) credit controls and high reserve requirements, (2) interest rate controls, (3) entry barriers and restrictions on the scope of banks’ activities, (4) securities market policy, (5) capital account restrictions, (6) state ownership in the banking sector. Dimensions (1)-(6) are measured on a scale from 0 to 3 (fully repressed to fully liberalized). Total liberalization index is constructed by summing up the scores for categories (1)-(6), varying between 0 and 18. The seventh dimension of financial reform from Abiad et al. (2008) does not refer to liberalization,
16 The SWIID combines and standardizes the World Income Inequality Database (WIID), dataset of the
Luxembourg Income Studies (LIS), Branko Milanovic’s World Income Distribution dataset, the Socio-Economic Database for Latin America and the ILO’s Household Income and Expenditure Statistics. The SWIID is the most comprehensive database, and standardizes income, so that it allows comparison across countries (Solt, 2015).
17 Abiad et al.’s (2008) dataset is highly comprehensive and internationally comparable and has rather
significant advantages over other datasets. This dataset has greater country and time coverage than other datasets, encompassing 22 advanced countries and 69 emerging and developing countries over the period 1973-2005.
14
but to enhancement of banking capital regulations and prudential supervision (CRS) of the banking sector. I inverse CRS measure, so that it takes values from 1 to 4, where higher score translates into less regulation.
To avert identification of spurious correlations due to omitted variable bias, I include financial and economic control variables that are consistent with those of empirical literature on banking crises. I use inflation, the current account balance as a percentage of GDP and real GDP growth rate as macroeconomic fundamentals. The ratio of broad money to total foreign exchange reserves, which captures the vulnerability of the economy to sudden capital outflows triggered by a run on the currency, and the real interest rate are employed as proxies for the monetary policy environment. The rate of depreciation and the change in terms of trade are employed to account for external shocks to the currency. Broad money, depreciation and the change in terms of trade also
measures country’s vulnerability to currency crises which can precede or coincide with banking crises. I control for government size with the ratio of government consumption to GDP. I control for the size of the economy by GNI. Following the literature, I proxy institutional quality by real GDP per capita in US dollars (i.e. Demirgüç-Kunt & Detragiache, 1998; Angkinand et al., 2010).
I use the level of domestic credit to private sector as percentage of GDP. This measure contains credit to individuals and enterprises from banks and other financial corporations such as finance and leasing companies, money lenders, insurance corporations, pension funds and foreign exchange companies. A credit measure that contains credit extended by non-deposit-taking institutions is preferable since these institutions amplify credit booms in periods of high level of financial liberalization. However, this indicator has one downside that it includes firm credit along with household credit. Following Perugini et al. (2016), indicators of gross fixed capital formation and portfolio investments are added to control for the credit to the non-household private sector. GDP growth also accounts for firms’ credit demand for investment that is driven by expectations on future aggregate demand. Despite the inclusion of these control variables, this is still a suboptimal proxy for household debt since firm credit cannot be accounted for thoroughly, for example retained profits are also used to finance investments. However, data on household debt is
15
unfortunately relatively scarce in terms of country and time coverage. It is imperative to utilize second-best measures due to unavailability of ideal information over time and space in research with such a comprehensive time and geographical coverage.
Following Kumhof et al. (2012), I use private credit from other financial institutions to proxy financial development. This measure excludes credit to the central bank,
development banks, the public sector, credit to state-owned enterprises, and cross claims of one group of intermediaries on another. Thus, it captures the amount of credit
channeled from savers, through financial intermediaries outside the commercial banking sector, to private firms and households, which is the key indicator of the development of intermediation outside deposit money banks. Moreover, the growth rate of real domestic bank credit is included as a proxy for credit booms that usually precede banking crises (Schularik & Taylor, 2012; Perugini et al., 2016)
Level of Democracy (Freedom House/Imputed Polity), whose scale ranges from 0-10 where 0 is least democratic and 10 most democratic is borrowed from Freedom in the World database (Freedom House, 2018). This indicator of the quality of political institutions captures what i.e. Acemoglu and Robinson (2013: 36) have in mind when they argue why the quality of political institutions explains the different economic fates of Mexico and the U.S. and the role of access to finance therein: “Unlike in Mexico, in the United States the citizens could keep politicians in check and get rid of ones who would use their offices to enrich themselves or create monopolies for their cronies. ... The broad distribution of political rights in the United States, especially when compared to Mexico, guaranteed equal access to finance and loans”. Lastly, to account for labor market regulations, I borrow sub-index 5B from the Economic Freedom of the World database (Gwartney et al., 2016).
The control variables are constructed using data from the World Development Indicators,
Global Financial Development databases (World Bank, 2020), International Financial Statistics (IMF), BIS total credit statistics, Penn World Table (Feenstra et al., 2015) and
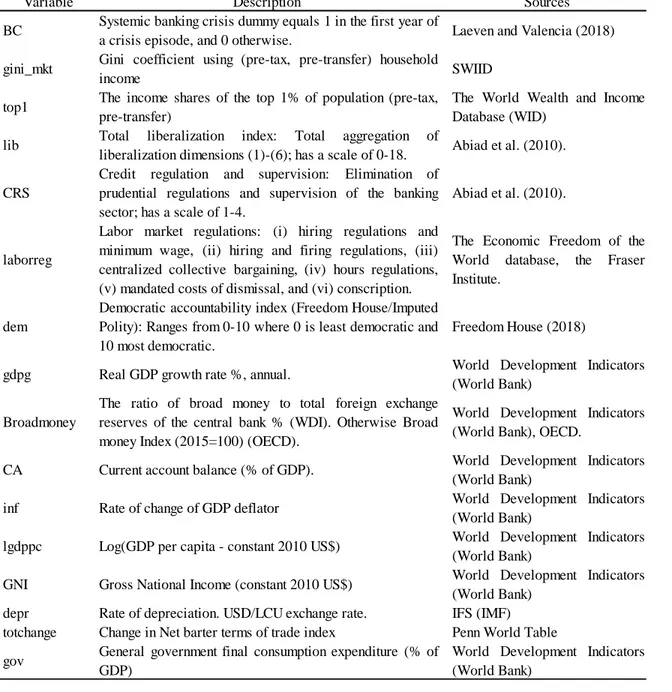
OECD. The description and source of each variable are detailed in Table A1 in the Appendix. The summary statistics and the correlation matrix are displayed in Table A2 and Table A3 in the Appendix, respectively.
16
CHAPTER 4
EMPIRICAL SPECIFICATION
The purpose of this paper is to investigate whether inequality and deregulation directly affects the occurrence of banking crises. Additionally, this study is investigating whether the influence of inequality on the incidence of banking crises depends on financial deregulation, i.e. whether inequality and financial deregulation interacts to further increase the likelihood of banking crisis.
Considering the theoretical discussion, I expect private credit, current account balance to be significant predictors of banking crises. However, whether inequality, deregulation and their interaction directly affect the likelihood of banking crises is shrouded in
mystery since they may be exerting their influence through credit booms, current account deficits and lax monetary policies.
I model the probability of occurrence of a banking crisis using a multivariate logit regression model. The probability that the banking crisis dummy takes a value of one (crisis occurrence) at a point in time t is given by the value of the logistic cumulative distribution evaluated for the data and parameters at that point in time. Thus,
𝑃𝑟𝑜𝑏(𝑌𝑖𝑡 = 1) = F(𝛽𝑋𝑖𝑡) = 𝑒 𝛽′𝑋𝑖𝑡 1 + 𝑒𝛽′𝑋
17
where 𝑌𝑖𝑡 is the banking crisis dummy for country i at time t, 𝛽 is the vector of
coefficients to be estimated, 𝑋𝑖𝑡 is the vector of explanatory variables and F(𝛽𝑋𝑖𝑡) is the cumulative logistic distribution.
Given a sample of observations {(Yit, Xit), t = 1, 2, …, Nt}, the unknown parameters 𝛽 can be estimated by maximizing the sample loglikelihood function of the model:
𝑙𝑜𝑔𝑒𝐿 = ∑ ∑[(𝑌𝑖𝑡𝑙𝑜𝑔𝑒𝐹(𝛽′𝑋𝑖𝑡)) + (1 − 𝑌𝑖𝑡)𝑙𝑜𝑔𝑒(1 − 𝐹(𝛽′𝑋𝑖𝑡))] 𝑇
𝑡=1 𝑛
𝑖=1
Under some regularity conditions, and as the sample size grows to infinity, the resulting Maximum Likelihood Estimator converges to the true value of 𝛽 and is normally distributed. Its distribution will be approximately Gaussian in finite size samples.
The parameters obtained by maximizing this expression are not constant marginal effects of Xi on banking crisis probability as the underlying relationship is non-linear. The marginal effect of explanatory variable 𝑋𝑘,𝑖𝑡on 𝑌𝑖𝑡 is given by:
𝜕𝑃𝑟𝑜𝑏(𝑌𝑖𝑡 = 1)
𝜕𝑋𝑘,𝑖𝑡 = 𝐹(𝛽′𝑋𝑖𝑡)[1 − 𝐹(𝛽′𝑋𝑖𝑡)]𝛽𝑘
Thus, the increase in probability depends on the original probability and thus upon the initial values of all the independent variables and their coefficients. The magnitude depends on the slope of the cumulative distribution function at 𝛽𝑋𝑖𝑡. A change in the explanatory variable can have changing marginal effects on the probability of a crisis depending on the country’s initial crisis probability. Particularly, the effect will be minimal if the crisis probability is either extremely high or low but if crisis probability is around 0.5 then a change in the explanatory variable will have its highest effect. But the sign on the coefficient still indicates the direction of change on the crisis probability. While using binary dependent variable in panel data, two econometric issues may arise. First, the incidental parameter problem biases the fixed effects estimator under a limited time dimension. Second, the number of observations in the estimates decreases since fixed effects omit countries that have not experienced banking crises. Random effects logit models do not face these problems, but the assumption that unobserved
18
heterogeneity is uncorrelated with the independent variables is unrealistic and
incompatible with my dataset. By using fixed country effects, I effectively control for unobserved and imperfectly measured factors specific to countries, rendering the estimation of the coefficients of main interest reasonably reliable.
In order to analyze the direct impacts of inequality, financial deregulation and their interaction on the likelihood of systemic banking crises, I use the logit regression model with fixed effects specified as follows:
𝐵𝐶𝑖,𝑡 = 𝛽𝑋𝑖,𝑡−1+ 𝛽1𝐼𝑛𝑒𝑞𝑖,𝑡−𝑛+ 𝛽2𝑙𝑖𝑏𝑖,𝑡−𝑛+ 𝛽3𝐶𝑅𝑆𝑖,𝑡−𝑛+ 𝛽4(𝑙𝑖𝑏 ∗
𝐼𝑛𝑒𝑞)𝑖,𝑡−𝑛+ 𝛽5(𝐶𝑅𝑆 ∗ 𝐼𝑛𝑒𝑞)𝑖,𝑡−𝑛+ 𝛼𝑖 + 𝜀𝑖,𝑡 (1) where subscripts i refer to countries and t and n refer to years; 𝛼𝑖 is country-specific effects and 𝜀𝑖,𝑡 is an idiosyncratic error term for each country and each period. The dependent variable BC is the crisis dummy, taking a value of 1 if the country i is experiencing a banking crisis and zero otherwise. X is a vector of lagged explanatory variables and β is a vector of unknown coefficients associated with the explanatory variables. lib, Ineq, CRS are the variables of financial liberalization, inequality (top 1% income shares or Gini index) and banking capital regulations and prudential supervision (CRS) in the respective year. I include interaction terms since it is suggested that
inequality and financial deregulation may reinforce each other and act together to increase the likelihood of banking crisis episodes.
Since there is no single measure for financial deregulation that is commonly used by the literature, I account for financial deregulation by two complementary measures from Abiad et al. (2008). In particular, total liberalization index (lib) is included to capture liberalization level of the economy, and the reduction of banking capital regulations and prudential supervision (CRS) is included to capture deregulatory effects as CRS
suggested to be the determining factor for the deregulatory effect of the liberalization reforms in the literature.
Inequality and financial deregulation measures are lagged one to five years since their effects may be felt in longer term. Thus, the same model is run for the first to the fifth lags of variables of interest, namely the measure of inequality, liberalization, CRS, the
19
interaction of inequality with liberalization and the interaction of inequality with CRS, while all control variables are always lagged one period to avoid simultaneity issues. I estimate a baseline and an extended specification including a set of variables widely found in the literature to control for macroeconomic conditions, institutional
characteristics and global environment. The baseline specification includes the domestic credit to private sector (% of GDP), current account balance (% of GDP), real GDP growth rate, log of GDP per capita, inflation, real interest rate, change in terms of trade and the ratio of broad money to total foreign exchange reserves. The extended
specification contains all control variables of baseline specification and depreciation of nominal exchange rate, growth rate of real domestic bank credit, gross fixed capital formation (% of GDP) and net portfolio investment (% of GDP).
20
CHAPTER 5
RESULTS
If a higher level of inequality, financial deregulation and their interaction are directly associated with the occurrence of banking crises, then their coefficients would be statistically significant. First, I test this by means of logit estimation with fixed effects using top 1% income share as an indicator of inequality.
The results displayed in Column (1) in Table 1 show that the coefficient of the top 1% income share has a positive sign, but it is statistically insignificant even at 10 percent level. However, in Column (3) onwards the coefficients of top 1% income share have negative sign, and are statistically insignificant at 10 percent level, except columns (7) and (8) where top 1% income share have negative sign and statistically significant at 10 percent level.
Similarly, top 1% income share coefficients have positive sign in columns (1) and (3), and usually negative in the following columns, and are statistically insignificant even at 10 percent level for all columns when the same model is run for the second to the fifth
21
lags of the variables of interest.18 Therefore, the significance and sign of the coefficient of top 1% income share are not sensitive to the specific choice of lags or inclusion of further controls.
The results in Table 1 show that the coefficients of liberalization index usually have positive sign but are statistically insignificant even at 10 percent level. Similarly, liberalization index coefficients have fluctuating sign and are statistically insignificant even at 10 percent level for all columns when the same model is run for the second to the fifth lags of the variables of interest. Therefore, the significance and sign of the
coefficient of liberalization index are not sensitive to the specific choice of lags or inclusion of further controls.
The results displayed in Table 1 show that the coefficients of CRS have a positive sign. Moreover, CRS coefficients are statistically significant at 5 percent level for Columns (2) and (3), and at 10 percent level for (6). However, CRS is not significant when interaction terms are added, and its significance level drops when additional control variables are added. The same results are achieved when the same model is run for the second lags of the variables of interest. However, after the second lags, CRS coefficients lose their significance.
The results in Table 1 show that the coefficients of the interaction of top 1% income share with liberalization index and the interaction of top 1% income share with CRS have changing signs and are statistically insignificant even at 10 percent level with the
exception that the interaction of top 1% income share with CRS has positive sign and is significant at 10 percent level in column (8). Similarly, the interaction terms are also statistically insignificant at 10 percent level for all columns when the same model is run for the second to the fifth lags of the variables of interest. Therefore, the significance the coefficients of the interaction of top 1% income share with liberalization index and the interaction of top 1% income share with CRS are not very sensitive to the specific choice of lags or inclusion of further controls.
18 Since results for the further lags of the variables of interest are qualitatively similar to the estimations
22
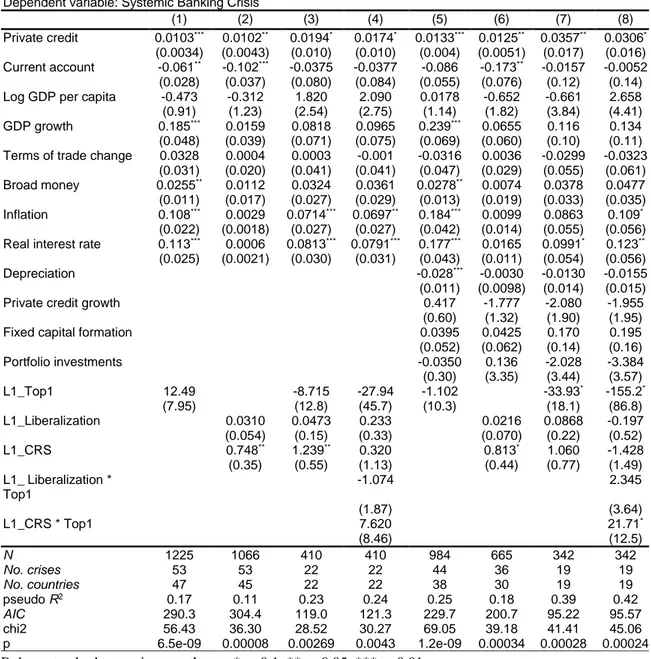
Table 1: Results for logit estimation with fixed effects for the first lags of top 1% income
share and financial deregulation
Robust standard errors in parentheses. * p<0.1, ** p<0.05, *** p<0.01.
Notes: All control variables are lagged one year. Variables of interest are lagged one year (L1). Top1: Top 1% income share (%); Liberalization: Liberalization index (0-18, increasing in degree of liberalization, takes integer values); CRS: Inverse of credit regulation and supervision (1-4, increasing in degree of deregulation, takes integer values). Logit estimation with fixed effects is used for period of 1970-2018.
As for control variables, the level of private credit (%GDP) emerges as always positive and significantly related to the occurrence of banking crises, confirming the findings in Mendoza and Terrones (2008), Schularik and Taylor (2012) and Perugini et al. (2016).
Dependent variable: Systemic Banking Crisis
(1) (2) (3) (4) (5) (6) (7) (8)
Private credit 0.0103*** 0.0102** 0.0194* 0.0174* 0.0133*** 0.0125** 0.0357** 0.0306*
(0.0034) (0.0043) (0.010) (0.010) (0.004) (0.0051) (0.017) (0.016) Current account -0.061** -0.102*** -0.0375 -0.0377 -0.086 -0.173** -0.0157 -0.0052
(0.028) (0.037) (0.080) (0.084) (0.055) (0.076) (0.12) (0.14) Log GDP per capita -0.473 -0.312 1.820 2.090 0.0178 -0.652 -0.661 2.658 (0.91) (1.23) (2.54) (2.75) (1.14) (1.82) (3.84) (4.41) GDP growth 0.185*** 0.0159 0.0818 0.0965 0.239*** 0.0655 0.116 0.134
(0.048) (0.039) (0.071) (0.075) (0.069) (0.060) (0.10) (0.11) Terms of trade change 0.0328 0.0004 0.0003 -0.001 -0.0316 0.0036 -0.0299 -0.0323
(0.031) (0.020) (0.041) (0.041) (0.047) (0.029) (0.055) (0.061) Broad money 0.0255** 0.0112 0.0324 0.0361 0.0278** 0.0074 0.0378 0.0477
(0.011) (0.017) (0.027) (0.029) (0.013) (0.019) (0.033) (0.035) Inflation 0.108*** 0.0029 0.0714*** 0.0697** 0.184*** 0.0099 0.0863 0.109*
(0.022) (0.0018) (0.027) (0.027) (0.042) (0.014) (0.055) (0.056) Real interest rate 0.113*** 0.0006 0.0813*** 0.0791*** 0.177*** 0.0165 0.0991* 0.123**
(0.025) (0.0021) (0.030) (0.031) (0.043) (0.011) (0.054) (0.056)
Depreciation -0.028*** -0.0030 -0.0130 -0.0155
(0.011) (0.0098) (0.014) (0.015)
Private credit growth 0.417 -1.777 -2.080 -1.955
(0.60) (1.32) (1.90) (1.95)
Fixed capital formation 0.0395 0.0425 0.170 0.195
(0.052) (0.062) (0.14) (0.16) Portfolio investments -0.0350 0.136 -2.028 -3.384 (0.30) (3.35) (3.44) (3.57) L1_Top1 12.49 -8.715 -27.94 -1.102 -33.93* -155.2* (7.95) (12.8) (45.7) (10.3) (18.1) (86.8) L1_Liberalization 0.0310 0.0473 0.233 0.0216 0.0868 -0.197 (0.054) (0.15) (0.33) (0.070) (0.22) (0.52) L1_CRS 0.748** 1.239** 0.320 0.813* 1.060 -1.428 (0.35) (0.55) (1.13) (0.44) (0.77) (1.49) L1_Liberalization * Top1 -1.074 2.345 (1.87) (3.64) L1_CRS * Top1 7.620 21.71* (8.46) (12.5) N 1225 1066 410 410 984 665 342 342 No. crises 53 53 22 22 44 36 19 19 No. countries 47 45 22 22 38 30 19 19 pseudo R2 0.17 0.11 0.23 0.24 0.25 0.18 0.39 0.42 AIC 290.3 304.4 119.0 121.3 229.7 200.7 95.22 95.57 chi2 56.43 36.30 28.52 30.27 69.05 39.18 41.41 45.06 p 6.5e-09 0.00008 0.00269 0.0043 1.2e-09 0.00034 0.00028 0.00024
23
Current Account Deficit is found to be significant only in some of the columns for all lags of variables of interest.
Additionally, the coefficients of inflation, broad money, real interest rate and real GDP growth are positive and usually significant for all lags of variables of interest except the estimation with the first lag of variables of interest, where they are only significant for some columns. Moreover, the rate of nominal depreciation is negative and usually significant for all lags of variables of interest except the estimation with the first lag of variables of interest, where it is only significant for some column (5). Furthermore, the coefficients of log GDP per capita, the change in terms of trade and growth of real bank credit are usually insignificant. These results are generally in line with the literature, i.e. Demirgüç-Kunt and Detragiache (1998, 2005); Davis and Karim (2008).
Lastly, the coefficient of gross fixed capital formation is found to be usually positive and rarely significant, while the coefficient of portfolio investments is negative and
occasionally emerges as significantly associated with the occurrence of banking crises. Therefore, channeling credit to the investment of productive purposes might lower the likelihood of banking crises.
Average marginal effects of the coefficients in Table 1 are displayed in Table A5 in the Appendix. The variables of interest do not have any significant effect on the probability of banking crisis.
Overall, these results suggest that a higher level of inequality, financial deregulation and their interaction are not directly associated with the occurrence of banking crises. But higher level of relaxed banking capital regulations and prudential supervision (CRS) might increase the likelihood of banking crisis in the short run.
24
CHAPTER 6
ROBUSTNESS AND SENSITIVITY ANALYSIS
In this section, I estimate a set of different specifications to test the robustness and sensitivity of the results found out in the previous section.
6.1. LOGIT WITH RANDOM EFFECTS ESTIMATION RESULTS
Using fixed-effects estimates eliminates all observations for the countries that have never experienced a banking crisis because the country specific dummy and the banking crisis dummy become perfectly correlated for countries never experienced a banking crisis. Elimination of these countries may take away much cross-country variation and may lead to a biased sample and coefficients. By using random effects, variation in the independent variables is entirely used towards explaining the likelihood of occurrence of banking crises. Therefore, I provide the results of the logit estimation with random effects using my baseline and extended specifications. White-Huber robust standard errors clustered by country are employed in these estimations. Using random effects estimator increases the number of observations by at least one thirds.
The results displayed in Table 2 show that the coefficients of top 1% income share insignificant for all columns. This result is also applicable to the second and third lags. Similar to the results with fixed effect estimation, liberalization is always insignificant for all lags, and CRS has positive and significant coefficient at 1 percent level for all
25
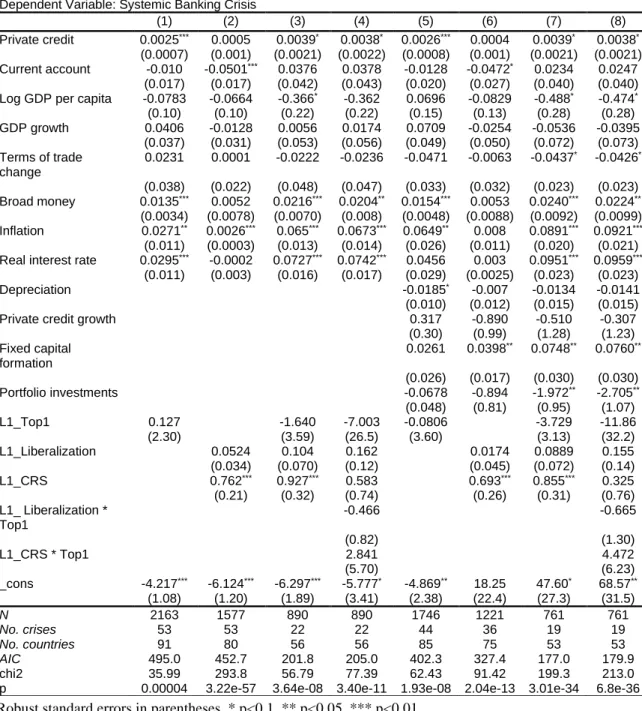
Table 2: Results for logit estimation with random effects for the first lags of top 1%
income share and financial deregulation
Robust standard errors in parentheses. * p<0.1, ** p<0.05, *** p<0.01.
Notes: All control variables are lagged one year. Variables of interest are lagged one year (L1). Top1: Top 1% income share (%); Liberalization: Liberalization index (0-18, increasing in degree of liberalization, takes integer values); CRS: Inverse of credit regulation and supervision (1-4, increasing in degree of deregulation, takes integer values). Logit estimation with random effects is used for period of 1970-2018.
specifications except the ones with interaction terms. Moreover, the interaction terms are always insignificant for the first three lags.
Dependent Variable: Systemic Banking Crisis
(1) (2) (3) (4) (5) (6) (7) (8)
Private credit 0.0025*** 0.0005 0.0039* 0.0038* 0.0026*** 0.0004 0.0039* 0.0038*
(0.0007) (0.001) (0.0021) (0.0022) (0.0008) (0.001) (0.0021) (0.0021) Current account -0.010 -0.0501*** 0.0376 0.0378 -0.0128 -0.0472* 0.0234 0.0247
(0.017) (0.017) (0.042) (0.043) (0.020) (0.027) (0.040) (0.040) Log GDP per capita -0.0783 -0.0664 -0.366* -0.362 0.0696 -0.0829 -0.488* -0.474*
(0.10) (0.10) (0.22) (0.22) (0.15) (0.13) (0.28) (0.28) GDP growth 0.0406 -0.0128 0.0056 0.0174 0.0709 -0.0254 -0.0536 -0.0395 (0.037) (0.031) (0.053) (0.056) (0.049) (0.050) (0.072) (0.073) Terms of trade change 0.0231 0.0001 -0.0222 -0.0236 -0.0471 -0.0063 -0.0437* -0.0426* (0.038) (0.022) (0.048) (0.047) (0.033) (0.032) (0.023) (0.023) Broad money 0.0135*** 0.0052 0.0216*** 0.0204** 0.0154*** 0.0053 0.0240*** 0.0224** (0.0034) (0.0078) (0.0070) (0.008) (0.0048) (0.0088) (0.0092) (0.0099) Inflation 0.0271** 0.0026*** 0.065*** 0.0673*** 0.0649** 0.008 0.0891*** 0.0921*** (0.011) (0.0003) (0.013) (0.014) (0.026) (0.011) (0.020) (0.021) Real interest rate 0.0295*** -0.0002 0.0727*** 0.0742*** 0.0456 0.003 0.0951*** 0.0959***
(0.011) (0.003) (0.016) (0.017) (0.029) (0.0025) (0.023) (0.023)
Depreciation -0.0185* -0.007 -0.0134 -0.0141
(0.010) (0.012) (0.015) (0.015)
Private credit growth 0.317 -0.890 -0.510 -0.307
(0.30) (0.99) (1.28) (1.23) Fixed capital formation 0.0261 0.0398** 0.0748** 0.0760** (0.026) (0.017) (0.030) (0.030) Portfolio investments -0.0678 -0.894 -1.972** -2.705** (0.048) (0.81) (0.95) (1.07) L1_Top1 0.127 -1.640 -7.003 -0.0806 -3.729 -11.86 (2.30) (3.59) (26.5) (3.60) (3.13) (32.2) L1_Liberalization 0.0524 0.104 0.162 0.0174 0.0889 0.155 (0.034) (0.070) (0.12) (0.045) (0.072) (0.14) L1_CRS 0.762*** 0.927*** 0.583 0.693*** 0.855*** 0.325 (0.21) (0.32) (0.74) (0.26) (0.31) (0.76) L1_Liberalization * Top1 -0.466 -0.665 (0.82) (1.30) L1_CRS * Top1 2.841 4.472 (5.70) (6.23) _cons -4.217*** -6.124*** -6.297*** -5.777* -4.869** 18.25 47.60* 68.57** (1.08) (1.20) (1.89) (3.41) (2.38) (22.4) (27.3) (31.5) N 2163 1577 890 890 1746 1221 761 761 No. crises 53 53 22 22 44 36 19 19 No. countries 91 80 56 56 85 75 53 53 AIC 495.0 452.7 201.8 205.0 402.3 327.4 177.0 179.9 chi2 35.99 293.8 56.79 77.39 62.43 91.42 199.3 213.0 p 0.00004 3.22e-57 3.64e-08 3.40e-11 1.93e-08 2.04e-13 3.01e-34 6.8e-36
26
However, there are some small differences in the results of random effect estimations and fixed effect estimations in the fourth and fifth lags of the variables of interest. Therefore, fifth lag of random effects logit estimation is reported in Table A6 in the Appendix. The coefficients of top 1% income share are positive and significant at 10 percent level in column (4) for the fourth lag and for columns (4) and (8) for fifth lag in Table A6 in the Appendix. Moreover, CRS is a positive and significant predictor of banking crisis consistently for all lags. Lastly, the interaction term between top 1% income share and CRS is negative and significant at 10 percent level for fourth and fifth lags.
Overall, results for logit random effect specification yields qualitatively very similar results with the fixed effects estimation for first three lags, whereas there are some associations between top 1% income share, CRS, their interaction term and the occurrence of banking crisis in fourth and fifth lags. However, these relationships are weak relationships as they exist only at 10 percent level, and they are not consistent with the findings from fixed effect estimation. Consequently, findings from fixed effects logit estimation are largely robust to using random effects logit model.
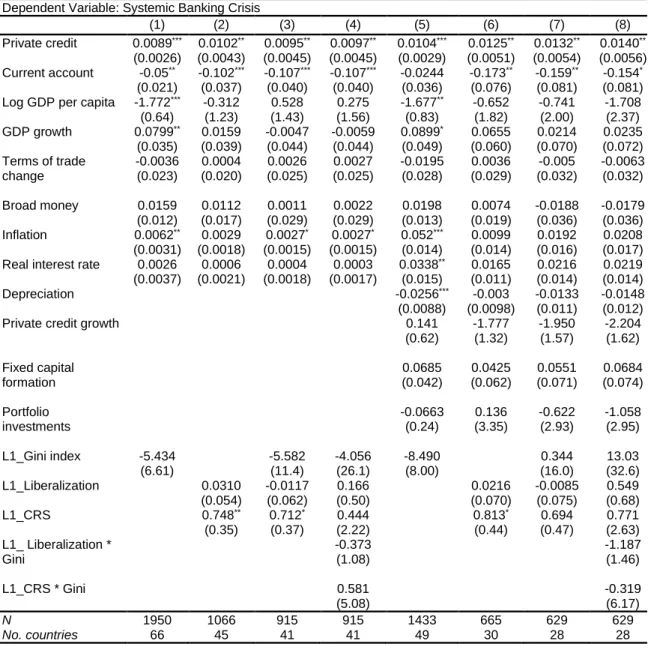
6.2 ESTIMATION RESULTS WITH GINI INDEX
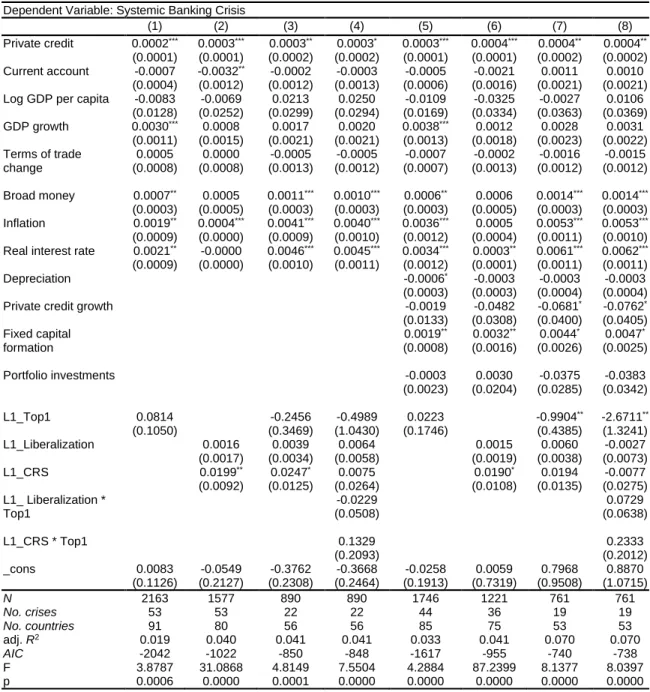
One of the major concerns when investigating the effects of inequality is the dependence of the results on the specific indicator of inequality used in the estimations. To test the sensitivity of the choice of inequality measure, I estimate my baseline and extended specifications by employing Gini index as a measure of inequality. Using Gini index instead of top 1% income share provides higher the number of observations and slightly broader country coverage in the estimations.
The results are presented in Table 3 and confirm the earlier findings. Findings are very similar to the ones with top 1% income shares for all lags of the variables of interest. Only main difference is that the estimations with the Gini index produces the coefficient of CRS that is significant in higher levels of significance in the first two lags.
Furthermore, I also estimate my baseline and extended specifications with random effects model and by employing Gini index as a measure of inequality. Table 4 reports random effects estimation results for the first lags of variables of interest. The results again
27
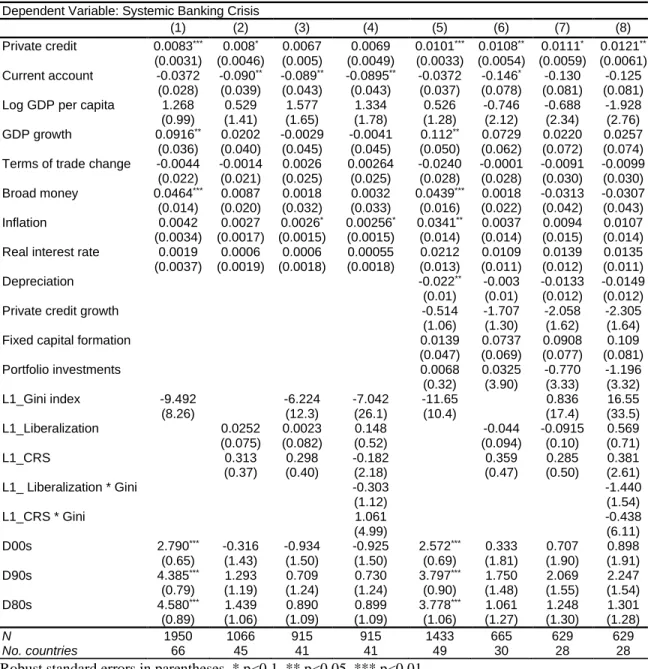
Table 3: Results for logit estimation with fixed effects for the first lags of Gini index and
financial deregulation
Robust standard errors in parentheses. * p<0.1, ** p<0.05, *** p<0.01.
Notes: All control variables are lagged one year. Variables of interest are lagged one year (L1). Gini: Gini index (0-100); Liberalization: Liberalization index (0-18, increasing in degree of liberalization, takes integer values); CRS: Inverse of credit regulation and supervision (1-4, increasing in degree of
deregulation, takes integer values). Logit estimation with fixed effects is used for period of 1970-2018.
support the earlier findings. Random effects estimation qualitatively replicates the outcomes of fixed effects estimation for the variables of interest, while there are some differences in control variables’ coefficients.
Dependent Variable: Systemic Banking Crisis
(1) (2) (3) (4) (5) (6) (7) (8)
Private credit 0.0089*** 0.0102** 0.0095** 0.0097** 0.0104*** 0.0125** 0.0132** 0.0140**
(0.0026) (0.0043) (0.0045) (0.0045) (0.0029) (0.0051) (0.0054) (0.0056) Current account -0.05** -0.102*** -0.107*** -0.107*** -0.0244 -0.173** -0.159** -0.154*
(0.021) (0.037) (0.040) (0.040) (0.036) (0.076) (0.081) (0.081) Log GDP per capita -1.772*** -0.312 0.528 0.275 -1.677** -0.652 -0.741 -1.708
(0.64) (1.23) (1.43) (1.56) (0.83) (1.82) (2.00) (2.37) GDP growth 0.0799** 0.0159 -0.0047 -0.0059 0.0899* 0.0655 0.0214 0.0235 (0.035) (0.039) (0.044) (0.044) (0.049) (0.060) (0.070) (0.072) Terms of trade change -0.0036 (0.023) 0.0004 (0.020) 0.0026 (0.025) 0.0027 (0.025) -0.0195 (0.028) 0.0036 (0.029) -0.005 (0.032) -0.0063 (0.032) Broad money 0.0159 0.0112 0.0011 0.0022 0.0198 0.0074 -0.0188 -0.0179 (0.012) (0.017) (0.029) (0.029) (0.013) (0.019) (0.036) (0.036) Inflation 0.0062** 0.0029 0.0027* 0.0027* 0.052*** 0.0099 0.0192 0.0208 (0.0031) (0.0018) (0.0015) (0.0015) (0.014) (0.014) (0.016) (0.017) Real interest rate 0.0026 0.0006 0.0004 0.0003 0.0338** 0.0165 0.0216 0.0219
(0.0037) (0.0021) (0.0018) (0.0017) (0.015) (0.011) (0.014) (0.014)
Depreciation -0.0256*** -0.003 -0.0133 -0.0148
(0.0088) (0.0098) (0.011) (0.012)
Private credit growth 0.141
(0.62) -1.777 (1.32) -1.950 (1.57) -2.204 (1.62) Fixed capital formation 0.0685 (0.042) 0.0425 (0.062) 0.0551 (0.071) 0.0684 (0.074) Portfolio investments -0.0663 (0.24) 0.136 (3.35) -0.622 (2.93) -1.058 (2.95) L1_Gini index -5.434 -5.582 -4.056 -8.490 0.344 13.03 (6.61) (11.4) (26.1) (8.00) (16.0) (32.6) L1_Liberalization 0.0310 -0.0117 0.166 0.0216 -0.0085 0.549 (0.054) (0.062) (0.50) (0.070) (0.075) (0.68) L1_CRS 0.748** 0.712* 0.444 0.813* 0.694 0.771 (0.35) (0.37) (2.22) (0.44) (0.47) (2.63) L1_ Liberalization * Gini -0.373 (1.08) -1.187 (1.46) L1_CRS * Gini 0.581 -0.319 (5.08) (6.17) N 1950 1066 915 915 1433 665 629 629 No. countries 66 45 41 41 49 30 28 28