Analyzing Turkish E-government Websites by Eye
Tracking
Duygu Albayrak
Computer Technology & Information Systems Bilkent University
Ankara, Turkey [email protected]
Kürşat Çağıltay
Computer Education & Instructional Technology Middle East Technical University
Ankara, Turkey [email protected]
Abstract—Usability studies provide essential information about users’ views and perceptions of efficiency, effectiveness and satisfaction of given online services. Nowadays, e-government web sites become popular. Therefore, there is a need for usability testing to specify the usability problems and to make the services of the e-government more usable. The purpose of this study is to investigate usability of some Turkish e-government services. The study examined usability of five Turkish e-government web sites: Ministry of National Education – Student Information System (e-okul), Ministry of Justice – National Judicial Network Project (UYAP), Turkish National Police: Vehicle Search System, Social Security Institute: Service Details and General Directorate of Land Registry and Cadastre. It was conducted with nine participants. This study is a case study with mixed design methodology, in which both quantitative and qualitative approaches were employed and combined. Quantitative data were collected through an eye-tracker, a pre-test questionnaire of participants’ demographics and previous utilization of e-government web sites and a post-test questionnaire. Qualitative data were collected through both semi-structured individual interviews and observation during test. The study results identify the usability problems encountered while using government services. The study concludes with specific recommendations for improvement of e-government services in Turkey.
Keywords— e-government; eye-tracking in usability; Turkey; usability
I. INTRODUCTION
Parallel to widespread use of internet technologies by academic and business organizations, there is an increased utilization of e-government applications. E-government aims to enhance access to and delivery of government services to benefit citizens. Definition of e-government ranges from –use of information technology to free movement of information to overcome physical bounds of traditional paper and physical based systems to “the use of technology to enhance the access to and delivery of government services to benefit citizens, business partners and employees” [1].
E-government research is summarized in [2]. In this study we use e-government definition made by Fang [3]: “E-government is defined as a way for “E-governments to use the most innovative information and communication technologies, particularly web-based Internet applications, to provide citizens and businesses with more convenient access to
government information and services, to improve the quality of the services and to provide greater opportunities to participate in democratic institutions and processes” [3]. According to Fang [3], e-government includes transactions between government and business, government and citizen, government and employee, and among different units and levels of government. E-business and e-commerce are subsets of e-government. The focus of this study is government-citizen related transactions.
Government organizations perceive web sites as promising means to increase the involvement of the citizens and to advance their efficiency [4].Usability problems are one of the reasons why e-government web sites are underused [5]. When users do not tolerate poor usability, they prefer to go elsewhere or it takes more time for the users to complete transactions. Thus, usability has become an important component of web site deployment as a key platform for e-government [6].
According to ISO 9241 [7] usability is defined as “the effectiveness, efficiency and satisfaction with which specified users achieve specified goals in particular environments”. Usability is also defined as a quality evaluation that assesses how easy user interfaces are to use [8]. According to Nielsen [8], learnability, efficiency, memorability errors and satisfactions are five quality components of usability.
The number of studies conducted on different aspects of web usability has increased in the past decade [9], [10], [11], [12], [13], [14], [15], [16], [17]. However, the number of studies regarding e-government usability is still limited.
Parallel to the increased demand for usability analysis of web sites, and it is becoming more common to include eye-tracking techniques in such studies [18]. Use of eye eye-tracking tools adds different aspects to the usability studies by providing objective and quantitative evidence to investigate user’s cognitive processes, such as visual and attention processes [19].
II. E-GOVERNMENT USABILITY
The usability of e-government websites is considered to be more important as compared to the commercially- inspired web sites since they are developed with a certain official character [20]. Government agencies aim to operate more
2013 Joint Conference of the 23nd International Workshop on Software Measurement (IWSM) and the Eighth International Conference on Software Process and Product Measurement (Mensura)
effectively and efficiently in the future by means of usability improvements. To improve usability, it should be measured. There is a recent trend in conducting studies that measure e-government usability.
Although the importance of e-government web site usability is clear, usability is often disregarded in developing e-government sites, and governments rarely conduct usability tests for the citizens [21], [22]. Usability of e-government systems has been mostly limited to the analysis of government websites at various levels of government [22]. Since e-government websites are complex communication products, they should be as simple to as possible. Donker-Kuijer et al. [23] presented usable guidelines for usable websites by analyzing five e-government heuristics.
Using a common set of performance metrics from user participation, Lee and Cho reported the results of an evaluative study of the Korean e-government portal from the usability perspectives [21]. Results of the study suggested that there are wide variations in the usability for the services provided and significant work should be performed to make e-government services more usable.
Pakistani government websites were studied by Saeed et al. [24]. As a result of their study, the authors stated that the usability level of Pakistani e-government sites studied were not good and needs further improvements. To measure usability of e-government sites in the study, surveys were used.
Turkish e-government websites were examined by Akıncı and Cagiltay [25] by eye-tracker. According to their results, participants failed to complete the given task and gave up working on to task due to poor design of submenus in e-government website. Moreover, the study results showed that some links of e-government web sites did not work or some were directed to blank pages.
According to Dijk et.al. [5] the usage of web heuristics is common in many government organizations. Soufi and Maguire used a three level model as a heuristic tool to evaluate a case study e-government web site [26]. Svaji et al. [27] focused on understanding the effectiveness of heuristics evaluation as a methodology for defect detection. The results showed the effectiveness of the heuristic evaluation as a usability testing methodology in capturing defects, and in prioritizing development and design efforts.
In another study to measure quality of e-government web sites automated tools were utilized [28]. The quality of e-government web sites of five Asian countries was measured by means of web diagnostic tools online. As a result, the authors confirmed that the e-government websites of the studied Asian countries neglected performance and quality criteria.
For some older adults, the Web may be the only option of accessing government resources. Becker studied e-government usability for older adult people [29]. Fifty state and 50 federal e-government home pages were evaluated in terms of usability.
III. EYE-TRACKING UTILIZATION IN USABILITY TESTS
Eye-tracking research has been increasingly used to supplement usability tests in both commercial, academic practice. [18]. Eye tracking provides great benefits revealing information that could otherwise be guessed [30]. Eye tracking alone is not a complete engineering approach, though it can make a significant contribution to the assessment of usability.
A summary of 21 usability studies incorporating eye-tracking was presented by Jacob and Karn [31]. They reviewed a variety of research on eye movements in human computer interaction. The study of eye movements pre-dates the pervasive use of computers by almost a century. In 1970s, eye movement research and eye tracking flourished, with great advances in both eye tracking technology and psychological theory to link eye tracking data to cognitive processes.
Since 1990s, researchers are involved in eye tracking studies to answer questions about usability [31]. Albanesi et al. [30] presented an innovative approach to semi-automatic usability inspection based on eye-tracking [30]. Recently the number of studies conducted on use of eye tracking for testing web usability has increased.
IV. METHOD
A. Purpose of the Study
The purpose of the study is to identify usability of the following five Turkish e-government web sites (Ministry of National Education – Student Information System (e-okul), Ministry of Justice – National Judicial Network Project (UYAP), Turkish National Police: Vehicle Search System, Social Security Institute: Service Details and General Directorate of Land Registry and Cadastre), to collect quantitative data on participants' performance (e.g., time on task, error rates), and to determine participant's satisfaction with the e-government web sites.
B. Design of the Study
This study is a case study with mixed design methodology, in which both quantitative and qualitative approaches were employed and combined into the research methodology of a single study [32]. This study employed both triangulation and explanatory method type of mixed method design to validate and compare quantitative findings with qualitative ones and used qualitative data to expand on or explain findings of quantitative data.
C. Participants of the Study
In this study, convenience sampling was used. Nine participants enrolled in the study. According to Nielsen [33], more than 75% of the usability problems can be found with five participants. As this number approaches 15, almost all of the usability problems can be identified [34]. Therefore, nine participants are sufficient to identify major usability problems on the inspected e-government web sites.
All of the participants are experienced web users. Average age of the participants is 33 (max = 41 and min = 28). Of all the nine participants, recordings of two participants’ for some
of the e-governments web sites were eliminated because of the accuracy problems in the eye tracking data. One of the participants could not perform the tasks of “Ministry of Justice – National Judicial Network Project (UYAP)” due to the system problem. Except her, all of the participants were utilized all e-government web sites with different orders. D. Procedures of the Study
The participants attended the experiment in single session. All participants completed a pre-test questionnaire to figure out previous utilization of e-government pages. Later, the participants were informed about the test, think-aloud protocol and the eye tracking system. After brief explanation of the study, participants were asked to complete a series of routine tasks and they were encouraged to take time as much as they needed to do the tasks. During the tests, participants were encouraged to speak aloud as much as possible while completing the task, and the participants’ performances were observed and recorded by the researcher. Participants’ eyes movements, number of mouse clicks, time for completing a task were captured by eye-tracking technology.
Major phases of the study consist of quantitative and qualitative phases. The data collection phases of the study can be divided as beginning, during and after the study (see Table I).
TABLE I. DATA COLLECTION PROCEDURES OF THE STUDY
Phase of the Study Data Collection Procedures
Beginning x Pre-test Questionnaire about pervious use of
e-government web sites.
During x Eye-tracking
x Think-aloud protocol x Note Taking (observations)
End x Post-test Questionnaire
x Interview
E. Data Collection and Instruments
In this study data were collected through both quantitative and qualitative methods. The experiments were conducted in METU-CEIT Technology Enhanced Learning Research Application Laboratory at Middle East Technical University. Eye movements of participants were recorded by Tobii 1750 Eye Tracker that records gaze locations at the rate of 120 MHz. In addition to the eye tracker data, the participants were observed while they were working on the tasks.
Data was collected by eye tracker, questionnaires and interviews. Nine participants tested the usability of the five Turkish e-government pages, with the help of eye-tracking technology, supported by observation of the participants, a pre-test questionnaire, which was used to assess participants’ previous experience with the e-government pages, a post-test questionnaire and a semi-structured individual interviews about the participants’ perceptions at the end of the study. All data collection instruments were in Turkish.
At the end of the study, post-test questionnaire about the participants’ perceptions was conducted. Post-test, System Usability Scale (SUS) was adopted from Brooke [35].
Qualitative data were collected by observation during eye-tracking test and semi-structured, face-to-face 10 minutes interviews. After eye tracking recording sessions, individual interviews were conducted with every participant to collect data about participants’ perceptions of e-government web sites.
F. Data Analysis
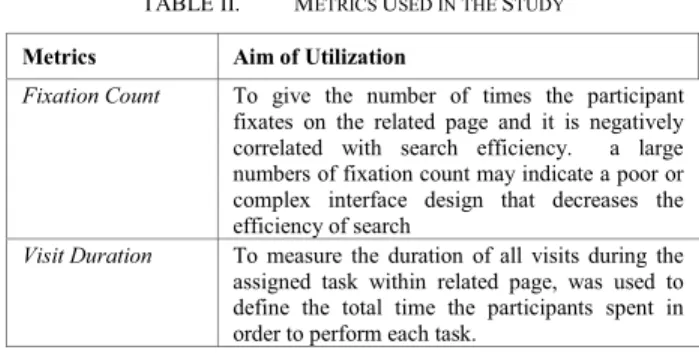
The quantitative data analysis consisted of descriptive statistics. Tobii Studio software was used to analyze the data collected by eye tracker. Sessions were recorded and analyzed to identify the fixation count and visit duration. Table II presents the used metrics and their utilization aim in this study.
TABLE II. METRICS USED IN THE STUDY
Metrics Aim of Utilization
Fixation Count To give the number of times the participant fixates on the related page and it is negatively correlated with search efficiency. a large numbers of fixation count may indicate a poor or complex interface design that decreases the efficiency of search
Visit Duration To measure the duration of all visits during the assigned task within related page, was used to define the total time the participants spent in order to perform each task.
Qualitative data were interviews and note taken during eye-tracking test. Qualitative data were analyzed together with eye-tracking data. After test, the participants and researcher was conducted in the form of a semi-structured interview in which the interviewee reflected on his feeling and perceptions about usability of e-government web sites. This interview acted as an informal exchange of observations and views. Hence, no formal interview schedules were utilized. The interviews were tape-recorded after obtaining consent from the interviewees, and later, they were transcribed verbatim for data analysis.
V. RESULT A. Pre-test Questionnaire Results
In this study, the pre-test questionnaire was used to evaluate participants’ previous utilization and involvement details in Turkish e-government web pages. According to the results of the pre-test questionnaire, five participants out of nine used e-government web sites before the study. All of them said that they used Social Security Institute before the study. Two participants declared that social security institute and Ministry of National Education- Student information services are the services that they used most. While none of the participant stated that they used ministry of Justice services before the study.
B. Eye Tracker, Intreview and Observation Results
All participants are given a total of 27 tasks with different order according to the e-government web pages. One of the
participants who declared that she used the e-government services before the study was not successful in entering the e-government web site.
1) Ministry of National Education – Student Information System (e-okul)
One participant’s recording was eliminated due to the accuracy problems in the eye tracking data. In the interview, most of the participants stated that like the interface and menu of e-okul and they stated that due to interface they easily completed the task. Table III shows average values for time to complete, visit durations and fixation count details of all participants for each task.
TABLE III. EYE TRACKER DATA FOR E-OKUL
Tasks Average time
to complete
Visit Duration (sec)
Fixation Count
Enter the sytem 00:01:01.5 0.49 38
Find 1st Lecture on
Tuesday 00:00:34.0 19.51 85 Number of not Attended
Hours 00:00:18.8 4.47 81 Highest Grade from 1st
Exam 00:00:47.2 0.59 14
Logout 00:00:07.2 1.30 9
The participants spent more time on finding the highest grade from the 1st exam than they did on the other tasks of e-okul (See Table III). However, the averages of visit duration and fixation count have maximum value for finding the 1st lecture on Tuesday. Moreover, Heat map of the tasks shows that participants focus on more than one area to complete the task (See Fig. 1). Higher number of visit duration and more than one focus on heat map can be interpreted that the participants searched on the pages while performing the task while higher fixation count value can be regarded as less search efficiency on the page. Finding total number of not attended hours is another task that the averages of visit duration and fixation count is high and participants have problem in completing. It was seen from the hotspot data in heat map that the participants focused on distributed areas mostly on left side menu which is not the area to complete the task. Two participants logout from e-government and did not logout form e-okul. Since this e-service is different than others, it opens a pop-up screen for the service. Users had difficulty to find logout of pop-up screen.
Fig. 1. Heat Map for finding 1st lecture on Tuesday
2) Ministry of Justice
Participants completed seven tasks in Ministry of Justice. Eight participants entered the system successfully. Independent from participant and system’s usability a serious defect was determined. Although there is a trial registered for a participant, the system delivered a message as “Adınıza açılmış ya da müdahil olduğunuz dava kaydı bulunamamıştır. = There is no trial for your name”. This message appeared twice during the tests. Four participants were unsuccessful to find their status. Higher number of visit duration and fixation count (See Table IV) for number of respondent can conclude that participants have difficulty to complete the task. Finding number of complaints tasks’ heat map demonstrates that participants searched all web sites up to down to complete the task (See Fig 2.)
TABLE IV. EYE TRACKER DATA FOR MINISTRY OF JUSTICE
Tasks Average time
to complete
Visit Duration (sec)
Fixation Count
Enter the sytem 00:00:46.9 0.49 38.00
Find Type of Trial 00:00:17.1 1.20 4.71
Find Trial No 00:00:21.3 0.40 2.75
Find Status of Trial 00:00:22.1 0.33 5.00
Find Your Status 00:00:35.7 0.28 5.67
Number of Respondent 00:00:28.3 0.36 7.25
Number of Complainant 00:00:14.3 13.81 31.71
Fig. 2. Heat Map for Finding Number of Complaint
3) Turkish National Police: Vehicle Search System One participant was failed to enter the system due to system error. This is a serious problem which occurred for more than one participant. However, except for one of them, system started to work properly in second try. Table V shows average values for time to complete, visit durations and fixation count details of all participants for each task.
The participants spent more time on finding administrative problems (See Table V). High number of visit duration and fixation count value for the task, enter system can be an evidence for less search efficiency on the pages. Moreover, two participants stated second color as color and three participants said wrong model. However, according to the observation and interview results, all of them thought that they
completed the task correctly. Another problem in search vehicle system is that after a plate is queried and when the participant returns back to search page, the previously search plate number is visible in the screen.
TABLE V. EYE TRACKER DATA FOR VECHICLE SEARCH SYSTEM
Tasks Average time
to complete
Visit Duration (sec)
Fixation Count
Enter the sytem 00:00:58.3 4.51 102.14
Find Specific Plate 00:00:48.9 26.77 62.29
Find Color and Model 00:00:46.0 29.70 84.60
Find Administrative
Problems 00:00:30.8 52.91 63.31 Logout 00:00:12.5 0.58 1.33
4) Social Security Institute: Service Details
Based on post-test interviews, eye-tracking system data analysis and the notes taken during the test, it can be stated that finding the SGK service details page is the most time consuming, and difficult to use one. A task was searched within incorrect organizations. Two of the participants searched this task not within SGK, but within “Çalışma ve Sosyal Güvenlik Kurumu”. Two participants were unsuccessful and they stated wrong date for start of work. Moreover, higher fixation count value for finding 1st day of work (See Table IV) can be interpreted as less search efficiency on the page.
TABLE VI. EYE TRACKER DATA FOR SOCIAL SECURITY INSTITUTE
Tasks Average time
to complete
Visit Duration (sec)
Fixation Count
Enter the sytem 00:00:54.7 4.51 102.14
Find First Day of Work 00:00:54.7 0.37 10.50
Find Number of Days
Worked 00:00:26.9 0.84 2.33 Print Service Details 00:00:13.5 0.50 1.67
Logout 00:00:03.3 0.49 1.17
5) General Directorate of Land Registry and Cadastre Average time to entering the system, highest of all 27 task, is 1 min and 2.20 second (See Table VII). None of the participants found the link to enter the system in their first visits. Fig 3. presents how participants searching to enter the system and participants focus on wide distributed area.
According to the data collected by the eye tracker, average visit duration is 11.63 second for 16 for finding land register. Largest number of visit for this task is 4 and four participants complete the task at their first visit. According to small value of fixation counts, visit durations and observations, participants easily found the area of home. However, due to background picture, they had difficulty to read the value.
Fig. 3. Heat Map for Finding Number of Complaint
TABLE VII. EYE TRACKER DATA FOR GENERAL DIRECTORATE OF LAND
REGISTRY AND CADASTRE
Tasks Average time
to complete
Visit Duration (sec)
Fixation Count
Enter the sytem 00:01:02.2 0.45 9.38
View Land Register 00:00:25.8 11.63 52.50
Find Area of Home 00:00:08.8 0.39 1.13
Find Parcel of Land 00:00:15.8 0.42 1.50
Logout 00:00:10.03 0.42 2.00
C. Post-Test Questionnaire Results
Participants’ SUS were measured through five-point Likert type items. This study used Bangod, Kortum and Miller study’s [36] acceptability ranges and adjective rating for SUS scores (See Table VIII). Two participants declared Turkish e-government web sites usability as poor while one participant found services good. Six participants stated Turkish e-government web sites usability as okay.
TABLE VIII. EYE TRACKER DATA FOR VECHICLE SEARCH SYSTEM
Participants SUS Score Acceptability Ranges Adjective Ratings P1 55.00 Low Marginal Ok P2 70.00 Acceptable Ok P3 77.50 Acceptable Good
P4 47.50 Not acceptable Poor
P5 57.50 Low Marginal Ok
P6 70.00 Acceptable Ok
P7 65.00 High Marginal Ok
P8 52.50 Low Marginal Ok
P9 47.50 Not Acceptable Poor
Average 60.28 Low Marginal Ok
VI. CONCLUSION AND DISCUSSION
In this study, usability of five Turkish e-government websites was examined. The result of this study revealed major problems with Turkish e-government websites, pointing out a variety of improvements on the pages. It is possible to
give some design suggestions according to problems participants have encountered. Some of the problems and suggestions are:
x The most important problem was detected in Ministry of Justice service. One of the participants did not see the trial on the system due to system error. However, system message stated that you do not have any trial. When there is a technical problem in the system, a different message should be given to the participants.
x Finding the requested service, especially the long list in the query page made the task difficult. As a solution to this, some participants suggested that subtitles or submenus should be opened when requested for the queries.
x Some of the e-government web sites did not work or give frequently system error. This system error should be solved. x The previously searched results should be cleaned from the
page and a clean form should be presented to the users. x Some fields are not easy to read due to pictures that are
presented behind the text. This problem can be solved when the background pictures are removed.
x There should be a help section for users. REFERENCES
[1] Basu, S. (2004). E-government and developing countries: an overview. International Review of Law, Computers & Technology, 18(1), 109– 132. doi:10.1080/13600860410001674779
[2] Yıldız, M. (2007). E-government research: Reviewing the literature, limitations, and ways forward. Government Information Quarterly, 24(3), 646–665. doi:10.1016/j.giq.2007.01.002
[3] Fang, Z. (2002). E-Government in Digital Era : Concept , Practice , and Development. International Journal of the Computer, the Internet and Management, 10(2), 1–22.
[4] Mahler, J., & Regan, P. M. (2007). Crafting the message: Controlling content on agency Web sites. Government Information Quarterly, 24(3), 505–521. doi:10.1016/j.giq.2006.06.008
[5] Dijk, J. V., Pieterson, W., Deuren, A. V., & Ebbers, W. (2007). E-Services for Citizens : The Dutch Usage Case, Lecture Notes in Computer Science , 4656, 155-166.
[6] Wood, F. B., Siegel, E. R., Lacroix, E., Lyon, B. J., Benson, D. A., Cid, V., & Fariss, S. (2003). A Practical Approach to E-Government Web Evaluation, IT Professional , 5 (3), 22-28.
[7] ISO. ISO/DIS 9241-11 Ergonomic requirements for office work with visual display termi- nals (VDTs) – Part 11: Guidance on usability, International Organization for Standardization (1998)
[8] Nielsen, J. (1994). Usability Engineering. Morgan Kaufmann Publishers. ISBN 0-12-518406-9.
[9] Becker, S. A., & Berkemeyer, A. (2002). Rapid Application Design and Testing of Web Usability, IEEE Multimedia 9(4) 38–46.
[10] Baravalle, A., & Lanfranchi, V. (2003). Remote Web usability testing. Behavior research methods, instruments, & computers: a journal of the Psychonomic Society, Inc, 35(3), 364–368.
[11] Shahizan, H., & Norshuhada, S. (2003). Assessing the Usability of Political Web Sites in Malaysia : A Benchmarking Approach, Lecture Notes in Computer Science, 2911, 468-479.
[12] Rafla, T., Robillard, P. N., & Desmarais, M. (2006). Investigating the impact of usability on software architecture through scenarios: A case study on Web systems, 79, 415–426. doi:10.1016/j.jss.2005.10.014 [13] Segawa. S., Sugimura M., & Ishigaki K. (2005). New Web-Usability
Evaluation Method : Scenario-Based Walkthrough, FUJITSU Sci. Tech. J. 41 (1), 105–114.
[14] Pereira, A., Silva, L., & Meira, W. (2006). Evaluating the Impact of Reactivity on the Performance of Web Applications, 425–432.
[15] Green, D., & Pearson, J. M. (n.d.). Development of a Web Site Usability Instrument Based on ISO 9241-11, (40), 66–73.
[16] Wang, X., & Liu, J. (2007). Usability Evaluation of B2C Web Site. 2007 International Conference on Wireless Communications, Networking and Mobile Computing, 3832–3835. doi:10.1109/WICOM.2007.949 [17] Mackey, T. P. (2008). Exploring the relationships between Web
usability and students ’ perceived learning in Web-based multimedia (WBMM ) tutorials, 50, 386–409. doi:10.1016/j.compedu.2006.08.006 [18] Ehmke, C., & Wilson, S. (2007). Identifying Web Usability Problems
from Eye-Tracking Data, 119–128.
[19] Duchowski, A. T. 2007. Eye Tracking Methodology: Theory and Practice, 2nd ed. Springer-Verlag.
[20] Tariq, A. (2008). User Centred Design for Engineering E-Government Web Usability, 128.
[21] Lee, S., & Cho, J. E. (2007). Usability Evaluation of Korean e-Government Portal, 64–72.
[22] Yıldız, M. (n.d.). Usability in Local e-government: Analysis of Turkih Metropolitian Municipality, 1–23. (unpublished work)
[23] Donker-Kuijer, M. W., De Jong, M., & Lentz, L. (2008). Heuristic web site evaluation: exploring the effects of guidelines on experts' detection of usability problems. Technical Communication, 55(4), 392-404. [24] Saeed S., Wahab F. & Sobia Aslam Cheema, S. A. (2013). Role of
Usability in E-Government and E-Commerce Portals: An Empirical Study of Pakistan. Life Science Journal 2013, 10(1), 8–13.
[25] Akıncı D. & Cagiltay K. (2004). Edevlet Web Sitelerini Kullanmak yada Kullanmamak: Vatandaş Açısından Kullanılabilirlik sorunları ve Öneriler. In Çağıltay K. (Eds), İnsan Bilgisayar Etkileşimi ve Kullanılabilirlik Mühendisliği: Teoriden Pratiğe. ODTÜ Yayıncılık. [26] Soufi, B., Maguire, M., Building, H., & Way, H. (n.d.). Achieving
Usability Within E-Government Web Sites Illustrated by a Case Study, 777–784.
[27] Sivaji, A., Abdullah, A., & Downe, A. G. (2011). Usability Testing Methodology: Effectiveness of Heuristic Evaluation in E-Government Website Development. 2011 Fifth Asia Modelling Symposium, 68–72. doi:10.1109/AMS.2011.24
[28] Jati, H., & Dominic, D. D. (2009). Quality Evaluation of E-government Website Using Web Diagnostic Tools: Asian Case. 2009 International Conference on Information Management and Engineering, 85–89. doi:10.1109/ICIME.2009.147
[29] Becker, S. A. (2005). E-government usability for older adults. Communications of the ACM, 48(2), 102. doi:10.1145/1042091.1042127
[30] Albanesi, M. G., Gatti, R., Porta, M., & Ravarelli, A. (2011). Towards semi-automatic usability analysis through eye tracking. Proceedings of the 12th International Conference on Computer Systems and Technologies - CompSysTech ’11, 135. doi:10.1145/2023607.2023631 [31] Jacob, R. J. K., & Karn, K. S. (2003). Eye Tracking in Human –
Computer Interaction and Usability Research : Ready to Deliver the Promises.
[32] Tashakkori, A., & Teddlie, C. (1998). Mixed Methodology: Combining qualitative and quantitative approaches. Thousand Oaks, London, New Delhi: Sage Publications.
[33] Nielsen, J. (1994). Estimating the number of subjects needed for a thinking aloud test. International Journal of Human-Computer Studies,
41(3), 385-397. Retrieved from http://www.sciencedirect.com/science/article/pii/S1071581984710652.
[34] Nielsen, J., & Landauer, T. K. (1993). A mathematical model of the finding of usability problems. In Proceedings of the INTERACT '93 and CHI '93 Conference on Human Factors in Computing Systems (CHI
'93), 206-213. Retrieved from http://doi.acm.org/10.1145/169059.169166
[35] Brooke, J. (1996). SUS: A "quick and dirty" usability scale. In P. W. Jordan, B. Thomas, B. A. Weerdmeester, & A. L. McClelland (Eds.), Usability Evaluation in Industry. London: Taylor and Francis.
[36] Bangod A., Kortum P, & Miller J. (2009) Determining What Individual SUS Scores Mean: Adding an adjective Rating Scale, Journal of Usability studies, 4(3), 114-123.