ISSN 1392-8619 print/ISSN 1822-3613 online http://www.tede.vgtu.lt
2010
16(2): 173–187
doi: 10.3846/tede.2010.11
Is ChIna Integrated wIth her major tradIng partners: evIdenCe on fInanCIal and real IntegratIon
mehmet huseyin Bilgin1, Chi Keung marco lau2, manuela tvaronavičienė3
1 Kadir Has University, 34083 Cibali-Fatih, Istanbul, Turkey (corresponding author) 2 The Hong Kong Polytechnic University, Hung Hom, Kowloon, Hong Kong 3 Vilnius Gediminas Technical University, Saulėtekio al. 11, LT-10223 Vilnius, Lithuania
E-mail: 1[email protected]; 2[email protected]; 3[email protected]
Received 12 January 2010; accepted 27 April 2010
abstract. Applying the new panel unit root test developed in this paper, we can overcome the pitfalls of old-fashioned panel unit root tests making it possible for researchers testing individual series for a unit root while taking contemporaneous cross-sectional dependence and structural break into account. The proposed test was used to investigate the status of financial and real integration of China, Japan, UK, the European Union, and the United States based on the empirical validity of real interest parity, uncovered interest parity, and relative purchasing power parity. We found strong evidence in favor of those parity conditions and hence concluded that financial and real integration between China and the other four countries was well established using the new developed panel unit root test while the traditional tests (either univariate or panel) fail to do so.
Keywords: financial and real integration, uncovered interest parity, real interest parity, purchasing power parity, foreign trade, China.
reference to this paper be made as follows: Bilgin, M. H.; Lau, C. K. M.; Tvaronavičienė, M. 2010. Is China integrated with her major trading partners: Evidence on financial and real integration, Technological and Economic Development of Economy 16(2): 173–187.
1. Introduction
Recently a vast amount of studies have focused on the effect of trade flow issues after China entered the World Trade Organization (WTO), for example Wang (2003) and Ma (2001), Wei et al. (2000), Noland et al. (1998), and Fernald et al. (1999), among others. Despite claims about significance of institutional conditions (Tvaronavičienė et al. 2009), there is a lack of
thoroughgoing quantitative analyses focusing on the empirical issues of real and financial links between separate countries. Financial links, e.g. between China and her major trading partners were elaborated by e.g. Cheung, He and Ng (1994), Glick and Hutchison (1990), Chinn and Frankel (1994), De Brouwer (1999), Kumhof (2001), and Cheung et al. (2003, 2006). Lane and Schmukler (2007) concentrated on the international financial integration of China and India. In his senior thesis, Lei (2006) analyzed the real and financial integra-tion between China and Taiwan basing his research on the empirical validity of real interest parity, uncovered interest parity and relative purchasing power parity. Moreover, Chan et al. (2007) investigated the real and financial integration among East Asian economies. They incorporated the ASEAN-5, South Korea and mainland China with the US and Japan taken as base countries. The authors have chosen a SURADF panel approach, which complies with one of perceptions expressed by other authors (e.g. Kahraman and Kaya 2010). Additionally, Cheung et al. (2006) assessed and compared the linkages between China and the other Chi-nese economies of Hong Kong and Taiwan against the linkages with Japan and the US. They characterized the time series behavior of three criteria of integration, namely real interest parity, uncovered interest parity, and relative purchasing power parity.
In this paper, we examine the empirical validity of real interest parity, uncovered interest parity, and purchasing power parity. These three parity conditions define the key links between markets. As Cheung et al. (2003, 2006) mentioned those parity conditions are traditionally used to quantify the degree of integration in capital, financial, and goods markets. However, the unit root tests applied in their studies are not appropriate in the sense that they ignore the issues of contemporaneous cross-sectional dependence and structural break in the arbitrage process, and therefore resulted in misleading conclusions.
It is important to study the real and financial integration of China with her major trading partners of developed countries for several reasons. Firstly, the international competitiveness of a country has become increasingly crucial for survival in a globalized world; the current paper assesses the competitiveness of the Chinese economy from the perspective of the degree of integration in the commodity and financial markets, and hence sheds light on its international competitiveness. Secondly, it is of current interest for researchers to know if China can pull the world, especially the developed countries out of recession in occurrence of economic shocks, for example like the current financial crisis. Many observers hope China can be the engine of the world economy, however, despite the fact that China’s phenomenal growth continues a strong link between China and developed economies is a necessary condition for China to become the engine of the world economy.
Furthermore, the financial aspect is also one of the strong motivations of this study. We attempt to analyze how financial reforms and the liberalization of capital accounts of China affect the financial integration of China with her major trading partners. As Lane and Schmukler (2007) mentioned, China’s international balance sheet is highly skewed. In fact, in 2008, China became the third largest FDI recipient country (after the United States and France) in the world. Moreover, China has become an important source of outward invest-ment. There are also large amounts of capital flows and portfolio investments in China and from China to her major trading partners. These all make analyzing the financial integration of China with her major trading partners important.
The rest of this paper is organized as follows. Section 2 lays out a conceptual framework for analyzing the components of financial and real integration. Section 3 presents empirical evidence for the validity of those three parity conditions. Some concluding remarks are of-fered in Section 4.
2. a Conceptual framework for analyzing integration
Following the idea of Cheung et al. (2006) the evidence of real market integration exists when relative purchasing power parity holds while there is evidence for financial integration where uncovered interest parity holds. Moreover, if both real and financial parity exists simultane-ously the real interest parity has to hold. The concept of real interest parity is based on ex ante real interest rate. Hence, theoretically we expected Real Interest Parity (RIP) differential between two countries:
rt j r i i s s e d t j e f t j d t j f t j e t j e d t j e f t , , , , , , , , , , , , ( ) [ − ≡ − − ∆ − π −π − ∆ jj e ], (1) where rt j e d , , , it j d , , and πt j e d , ,
are the j period expected real interest rate, expected nominal interest rate, and expected inflation in domestic country respectively. The d and f denotes domestic and foreign countries respectively where e and j indicate expectation and j period maturity, j equal to t + 1 in our case. Expected depreciation is defined as:
∆st t s s e t t e t ,+1≡ ,+1− ⋅ ⋅12 100, (2) where st j e
, is the expected nominal foreign exchange rate in logarithm between two countries
at time t + 1 while st is the nominal foreign exchange rate in logarithm at time t. Annualized
domestic expected inflation rate at time t is given by:
πt j e d t t d e t p p , , , , ( ) , ≡ +1− ⋅ ⋅12 100 (3)
where pt td e,,+1 and pt are the price in logarithm expected at time t + 1 and the price in
loga-rithm at t respectively.
In ex ante sense; the term (it j, i, s, ) d
t j f
t j e
− − ∆ is the expected Uncovered Interest Parity
(UIP) differential while [ , ]
, , , , πt j π e d t j e f t j e s
− − ∆ is the expected relative Purchasing Power
Par-ity (RPPP) differential.
Unfortunately, in practice data on expected parity differentials are unavailable so we adopt ex post parity differentials instead assuming rational expectations hold. We have:
rt j r i i s s d t j f t j d t j f t j t j d t j f t j , − , ≡( , − , −∆ , ) [− π, −π, −∆ , ]. (4)
The above equations imply that a necessary condition for real interest parity to hold is that uncovered interest parity and relative purchasing power parity have to hold simultaneously. The existence of uncovered interest parity implies financial integration as supported by arbi-trage activities. On the other hand, evidence in support of relative purchasing power parity implies real market integration. Therefore, real interest parity is a function of both financial and real market integration (Frankel 1991). In the following section, we will provide empirical results on the real and financial integration between China and her main trading partners.
3. empirical methodology and results 3.1. summary statistics
Monthly (end-of-period) data on one-month inter-bank interest rates, nominal bilateral exchange rates and consumer price indices are gathered for China, the European Union, Japan, the United Kingdom, and the United States, from January of 1997 to January of 2005. Appendix 1 provides detailed description about data sources.
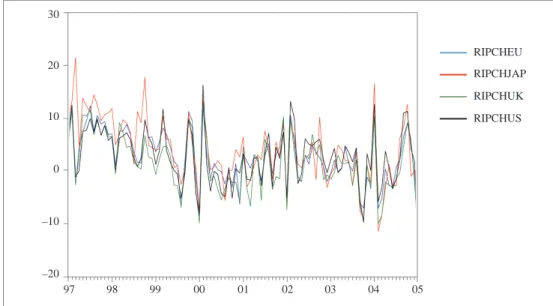
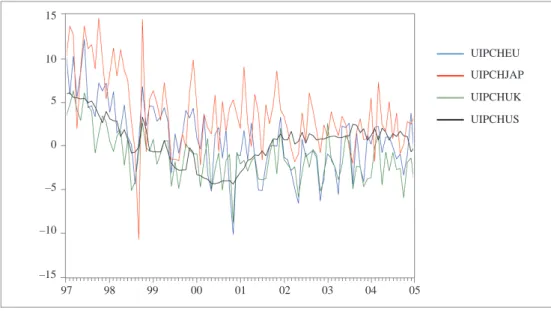
The parity differential of PPP, UIP, and RIP are plotted in Figs. 1–3 in annualized percent-ages. Some preliminary phenomena can be observed on the degree of integration though time. First, in Figs. 1 and 2, we can observe that the RIP and UIP differentials are decreasing from 1997:01 to 1999:12, and then fluctuate around mean zero. Second, in Fig. 3, PPP dif-ferential fluctuate around mean zero without large volatility for the whole sample period. Third, in Figs. 1, 2, and 3, we observe that the parity differential of all countries shows signs of co-movement over the same sample period.
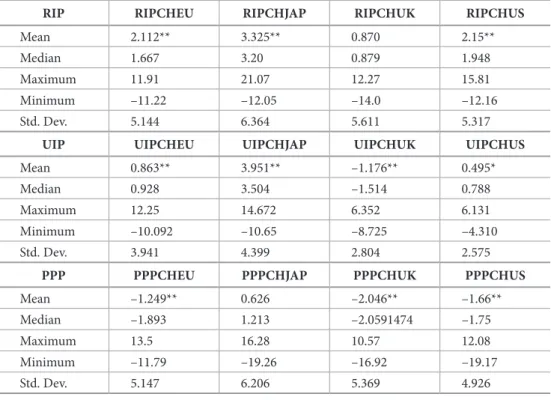
Table 1 presents descriptive statistics of parity differentials. Some preliminary results can also be derived from the degree of integration. For example, China and the US exhibit the smallest mean, range (maximum minus minimum), and standard deviation for UIP differential. If we use these descriptive statistics to infer the degree of integration, we may conclude that China and the US maintain the highest degree of financial integration while evidence for the RIP and PPP differential are not clear. We should note that mean for the UIP differential is the highest for Japan among the four countries, implying that the finan-cial market is not well integrated between China and Japan. Moreover, the mean of the PPP differential is the highest for the UK, implying that the commodity market is also not well integrated between China and UK.
fig. 1. Real interest rate parity
30 20 10 0 –10 –20 97 98 99 00 01 02 03 04 05 RIPCHEU RIPCHJAP RIPCHUK RIPCHUS
fig. 2. Uncovered interest rate parity
fig. 3. Purchasing power parity
15 10 5 0 –5 –10 97 98 99 00 01 02 03 04 05 UIPCHEU UIPCHJAP UIPCHUK UIPCHUS –15 20 10 0 –10 –20 97 98 99 00 01 02 03 04 05 PPPCHEU PPPCHJAP PPPCHUK PPPCHUS
The central idea of mean reversion was used as a conceptual context to assess the par-ity conditions. The idea resides on the possibilpar-ity that real interest parpar-ity differentials are temporary and therefore may exist in the short run, however real interest differentials may revert to their equilibrium value over a longer period. In contrast, if real interest differentials
are not stationary shocks then they will lead to short run (temporary) as well as long run (permanent) deviation from the hypothetical equilibrium value. Therefore, “Parity Condi-tions” will be evaluated using several unit root tests and “Parity CondiCondi-tions” are supported whenever parity differentials are found to be stationary.
3.2. Univariate augmented dicky-fuller (adf) test
Consider a series at time t,
∆qt =α0+bqt−1+δ∆qt−1+εt, (5)
where ∆qt is the series of interested items in first difference. ∆qt−1 is the augmenting term
and εt is the IID error term, i.e. εt ~id( ,0σ ) 2
. Equation (5) are estimated by Ordinary Least Square (OLS) and the unit root null hypothesis is rejected when the ADF-statistic is found to be significant for the null: b = 0 against the alternative b < 0.
table 1. Descriptive statistics
rIp rIpCheU rIpChjap rIpChUK rIpChUs
Mean 2.112** 3.325** 0.870 2.15**
Median 1.667 3.20 0.879 1.948
Maximum 11.91 21.07 12.27 15.81
Minimum –11.22 –12.05 –14.0 –12.16
Std. Dev. 5.144 6.364 5.611 5.317
UIp UIpCheU UIpChjap UIpChUK UIpChUs
Mean 0.863** 3.951** –1.176** 0.495*
Median 0.928 3.504 –1.514 0.788
Maximum 12.25 14.672 6.352 6.131
Minimum –10.092 –10.65 –8.725 –4.310
Std. Dev. 3.941 4.399 2.804 2.575
ppp pppCheU pppChjap pppChUK pppChUs
Mean –1.249** 0.626 –2.046** –1.66**
Median –1.893 1.213 –2.0591474 –1.75
Maximum 13.5 16.28 10.57 12.08
Minimum –11.79 –19.26 –16.92 –19.17
Std. Dev. 5.147 6.206 5.369 4.926
* The sample mean is significant at the 5% level. ** The sample mean is significant at the 1% level.
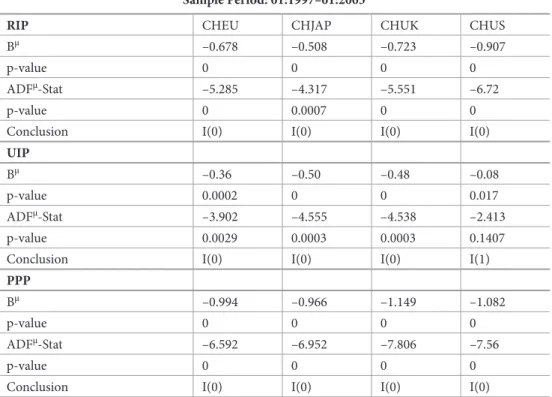
table 2. Summary of ADF unit root test for parity conditions sample period: 01:1997–01:2005
rIp CHEU CHJAP CHUK CHUS
Bμ –0.678 –0.508 –0.723 –0.907
p-value 0 0 0 0
ADFμ-Stat –5.285 –4.317 –5.551 –6.72
p-value 0 0.0007 0 0
Conclusion I(0) I(0) I(0) I(0)
UIp
Bμ –0.36 –0.50 –0.48 –0.08
p-value 0.0002 0 0 0.017
ADFμ-Stat –3.902 –4.555 –4.538 –2.413
p-value 0.0029 0.0003 0.0003 0.1407
Conclusion I(0) I(0) I(0) I(1)
ppp
Bμ –0.994 –0.966 –1.149 –1.082
p-value 0 0 0 0
ADFμ-Stat –6.592 –6.952 –7.806 –7.56
p-value 0 0 0 0
Conclusion I(0) I(0) I(0) I(0)
note: Regression with linear time trend provides the same conclusion and results are available upon request.
Table 2 presents ADF t-statistics for parity differentials. Since one lagged augmentation term was sufficient to clear up any problems of residual serial correlation, inferences are based on this specification. It indicates that all parity differentials except the UIP differential for the pair of China and the US may be stationary with 5% significance level1. Some implications for financial and real integration can be drawn from the above reported results. With regard to real integration, we conclude that real integration was well established between China and the other four countries; however, there is evidence of financial integration between China and the other countries with the US being an exception. As Ng and Perron (1995) concluded the selection of lag length is important when using unit root test. If the number of lags included in Eq(5) is too large the power of the test will suffer and the null hypothesis of a unit root will be accepted too often. We also estimate Eq(5) by using AIC as lag selection criteria, and not surprising all series are found to be are I (1) series because the number of augmented terms selected is too large2.
1 Unit root test is also imposed on the first differenced data of the UIP differential between China and
the US. The result shows that it’s I(0) therefore we can exclude the possibility of explosive root.
3.3. some more powerful unit root tests
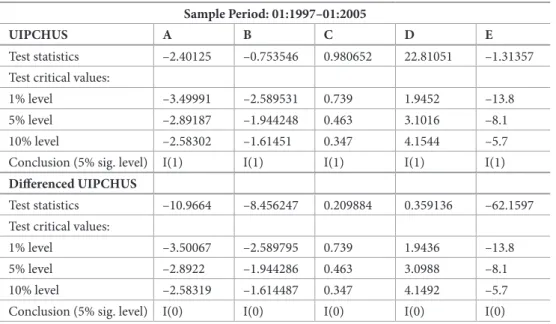
However, it’s well documented in the literature that the ADF test has low power against the stationary alternative. Maddala and Kim (1998) among others have criticized univariate unit root tests for having low power against stationary alternative. This problem becomes even more severe when the sample sizes used are relatively small. Two solutions are being con-sidered so far in the literature. The first approach is to adopt the modified version of UADF tests advocated by Elliott et al. (1996), Perron and Ng (1996), Park and Fuller (1995) based on a weighted symmetric estimator, the max test suggested by Leybourne (1995) and also Kwiatkowski et al. (1992) suggested that taking stationarity as the Null can improve power. Table 3 therefore provides the result of some popular univariate unit root tests as alterna-tives to ADF test on UIP differential between China and the US. Unfortunately, the results of those tests are similar to ADF test in concluding that the UIP differential between China and the US is nonstationary.
table 3. Alternative unit root tests for China interest rate & UIPCHUS sample period: 01:1997–01:2005
UIpChUs a B C d e
Test statistics –2.40125 –0.753546 0.980652 22.81051 –1.31357
Test critical values:
1% level –3.49991 –2.589531 0.739 1.9452 –13.8
5% level –2.89187 –1.944248 0.463 3.1016 –8.1
10% level –2.58302 –1.61451 0.347 4.1544 –5.7
Conclusion (5% sig. level) I(1) I(1) I(1) I(1) I(1)
differenced UIpChUs
Test statistics –10.9664 –8.456247 0.209884 0.359136 –62.1597
Test critical values:
1% level –3.50067 –2.589795 0.739 1.9436 –13.8
5% level –2.8922 –1.944286 0.463 3.0988 –8.1
10% level –2.58319 –1.614487 0.347 4.1492 –5.7
Conclusion (5% sig. level) I(0) I(0) I(0) I(0) I(0)
note: A – Phillips-Perron tes B – Elliott-Rothenberg-Stock DF-GLS test C – Kwiatkowski-Phillips-Schmidt-Shin test-H0:I(0) D – Elliott-Rothenberg-Stock test E – Ng-Perron test
The second approach is to explore more information by combining time (T) and space (N) dimension. This kind of panel unit root tests were advocated by Levin and Lin (1993), Im et al. (1997), Maddala and Wu (1999) and Taylor and Sarno (1998) among others. This paper follows the second approach and presents a panel data estimation procedure that is of
more practical importance to researchers. The primary motivation behind the application of panel data unit root tests, as opposed to standard univariate unit root tests is to explore more information by combining time and space dimension to get more powerful procedures. The general model for N series and T time periods that of interest is
∆ ∆ ∆ q b q q t T q b q t t t t N t N N N 1, 1 1 1, 1 1 1, 1 1, 1 , , , , = + + + = … = + − − α δ µ α ,,t−1+δN∆qN t,−1+µN t, t= …1, , .T (6) Based on the mean of the individual ADF t-statistics of each member in the panel, Im et al. (1997) assume that all series have a unit root under the null hypothesis while there are at least one series is stationary as its alternative. That is:
H b b i N H b b i N IPS i IPS i i 0 1 1 0 1 2 0 1 2 , , : , , , , : , , , = =
(
= …)
= < for = … and β =00 for i=N1+ …1, ,N.
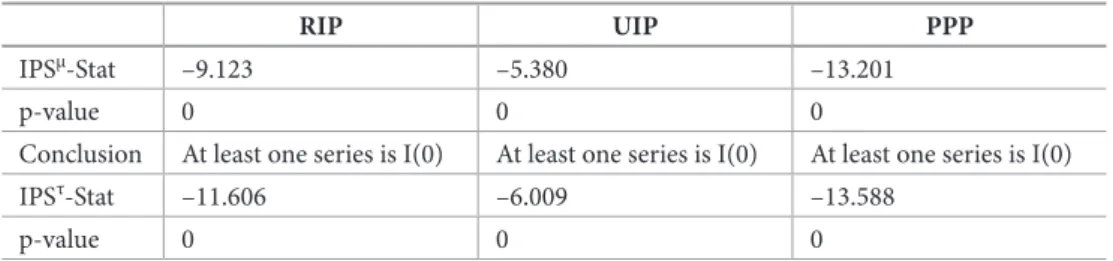
Table 4 reports IPS statistics, which indicates that at least one series is I(0) but fails to indicate which one is indeed I(0) series.
table 4. Summary statistics of IPS panel data unit root test
rIp UIp ppp
IPSμ-Stat –9.123 –5.380 –13.201
p-value 0 0 0
Conclusion At least one series is I(0) At least one series is I(0) At least one series is I(0)
IPSτ-Stat –11.606 –6.009 –13.588
p-value 0 0 0
However, the IPS panel data unit root test has three drawbacks. Firstly, the IPS test as-sumes the data generating process are generated independently across individuals so that the error term µN t, is not cross-correlated. Unfortunately, when shocks occurred in one
country, it is likely that the degree of parity differential will be affected in other countries. When this assumption of no cross-correlation was violated, the IPS test statistics follow an unknown distribution and therefore the statistical inferences are not reliable. Secondly, if a panel contains both I(0) and I(1) series, rejecting the null hypothesis can only suggest that there is at least one stationary series in the panel, but they do not indicate how many and which particular panel members are stationary. Thirdly, ignoring the possibility of structural break in the DGP may bias the IPS test towards the unit root null hypothesis of I(1).
The time series of parity differentials may exhibit structural break as indicated in Figs 1–3. The consequence of ignoring the presence of structural break could be serious when testing unit root. Perron (1989) and Amsler and Lee (1995) concluded that the null hypothesis of unit root was accepted too often when structural break occurs in the true Data Generating Process (DGP). Therefore, there is consensus that the failure of taking into account structural breaks is likely to be one reason that leads to the low power of unit root tests.
3.4. The seemingly Unrelated structural Change adf (sUsadf) test
One solution to the above problems is to develop a panel data unit root test that takes into account of contemporaneous cross-sectional dependence and structural break. The test proposed is named as Seemingly Unrelated Structural Change ADF (SUSADF) test. Firstly, Seemingly Unrelated Regressions (SUR) can take contemporaneous cross-correlation into account when testing the null hypothesis of having a unit root as developed by Breuer et al. (2001) and Lau (2009). Unavoidably, the bootstrapping technique must be used in order to get the empirical distribution of SUSADF statistics. The new test proposed in this paper au-tomatically indicates how many and which particular panel members are stationary if there are any while taking into account structural break. In our setup, we take into account the obvious break point at January-2000 when testing the null hypothesis of having a unit root in the parity differentials. SUSADF test is based on the following regression:
∆q1,t =α1+ ⋅ + ⋅t T d Dum1 2000: + ⋅ ⋅td T Dum1 2000: +b q1 1,t−1+δ1∆q1,t−1++ = = + ⋅ + ⋅ + ⋅ ⋅ µ α 1 1 2000 1 2 1 , , : : , , t N t N t T q t T d Dum td T Dum ∆ 0000 +b qN N t,−1+δN∆qN t,−1+µN t,, (7)
where t is the estimated coefficient on time trend T, d is the estimated coefficient the dummy variable, Dum with break point at January 2000, td is the estimated coefficient on the inter-action term of time trend and the dummy variable. Contemporaneous cross-correlation is allowed for the error terms. We have the following null hypothesis that individual series i has a unit root against its alternative of stationarity.
H0,SUSADF :bi =0, H1,SUSADF :bi =<0
(
i=1 2, ,…N)
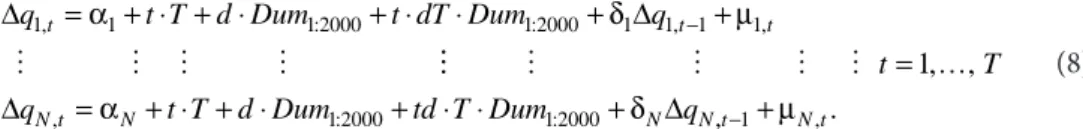
.Table 5 presents SUSADF test statistics. Since all parity differentials are found to be I(0) we conclude that real and financial integration was well established between China and other four countries. The critical values adopted in Table 5 were obtained from 10000 simulations. Critical values must be simulated with sample error covariance structure, the coefficients on the lagged difference estimated based on I(1) environment (Null hypothesis) assuming no drift unit root process. That is:
∆q1,t =α1+ ⋅ + ⋅t T d Dum1 2000: + ⋅t dT Dum⋅ 1 2000: +δ1∆q1,t−1+µ1,t t T qN t N t T d Dum td T Dum N qN = = + ⋅ + ⋅ + ⋅ ⋅ + 1 1 2000 1 2000 , , , : : ∆ α δ ∆ ,,t−1+µN t,. (8) First, model (8) was estimated applying Seemingly Unrelated Regression. The estimated
vector of parameters such as and was gathered. We next bootstrap randomly
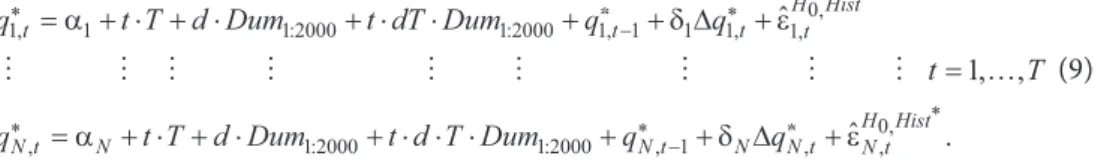
to get the cross correlated artificial vector of residuals, . Finally we use to generate artificial series, q∗. The artificial series, q∗ is generated as:
(9)
With these bootstrapped series we can obtain the bootstrapped estimates like ,
after estimating model (4), where is the SUSADF statistics under the null hypothesis environment. After 10000 simulations, we have a distribution table under I(1) environment and hence the critical values of this SUSADF test.
table 5. SUSADF test-parity conditions (structural break 2000:1)
CheU Chjap ChUK ChUs
rIp bs –1.07 –1.205 –1.12 –1.2 p-value 0 0 0 0 Time –0.2060 –0.0486 –0.013 0.032 p-value 0.519 0.185 0.711 0.359 Dummy 6.378 12.61 8.667 9.186 p-value 0.025 0 0.007 0.003 dummy*time –0.116 -0.359 –0.234 –0.2076 p-value 0.168 0 0.014 0.025 SURADFs-Stat –12.774[0.0] –11.217[0.0.] –13.405[0.0] –14.534[0.0]
Conclusion I(0) I(0) I(0) I(0)
UIp bs –0.9834 –0.9822 –1.1368 –0.3079 p-value 0 0 0 0 Time 0.0179 –0.0208 –0.00059 0.0291 p-value 0.369 0.425 0.969 0.003 Dummy 9.456 7.559 7.4318 3.6338 p-value 0 0.003 0 0.003 dummy*time –0.1985 –0.2654 –0.2262 –0.0974 p-value 0 0.001 0 0.004 SURADFs-Stat –9.132[0.0] –6.765[0.0] –9.142[0.0] –3.797[0.098]
Conclusion I(0) I(0) I(0) I(0)
ppp bs –1.024 –1.08 –1.176 –1.174 p-value 0 0 0 0 Time 0.0380 0.02 –1.477 6.474 p-value 0.303 0.643 0.656 0.027 Dummy 3.758 –2.81 –1.477 6.474 p-value 0.242 0.458 0.656 0.017 dummy*time –0.098 0.0216 0.0126 –0.21 p-value 0.309 0.848 0.899 0.017 SURADFs-Stat –10.831[0.0] –9.631[0.0] –13.16[0.0] –12.87[0.0]
Conclusion I(0) I(0) I(0) I(0)
4. Concluding remarks
In this paper, we developed a new panel unit root test to overcome the pitfalls of the old-fashioned panel unit root tests like that of IPS panel unit root test by making it possible for researchers to test individual series for a unit root while taking contemporaneous cross-sec-tional dependence and structural break into account. The SUSADF test avoids researchers drawing conclusions only about the panel as a whole and making bias towards the null hy-pothesis of having a unit root when structural breaks exists. Using the SUSADF unit root test we examine the status of real and financial integration of China within Japan, the European Union, United Kingdom, and the United States based on the empirical validity of real interest parity, uncovered interest parity, and relative purchasing power parity.
We found that real and financial integration between China and other four countries was well established. Lei (2006) also mentioned that the unit-root tests indicate higher degrees of real and financial integration in the long run. However, the tests for autocorrelation give evidence against instantaneous financial integration. Moreover, the findings of Chan et al. (2007) demonstrate financial integration among the ASEAN-5 and South Korea with their major trading partners. Conversely, they found that the real and financial integration among China-US and China-Japan are not yet empirically recognized notwithstanding the recent surge of capital flows into the mainland. Cheung et al. (2006) found that Hong Kong is highly integrated with the mainland. They also found that evidence is positive for integration with the US. Finally, their regression results suggest that the degree of financial and real integration depend upon the extent of capital controls, FDI linkages as well as exchange rate volatility.
There are several implications for policy makers and investors when planning economic policies and investment decisions. Firstly, the high degree of integration of China into global real and financial markets raises international competitiveness of China, and the imposition of tariff and non-tariff barriers on particular commodities will not have significant impact on the overall degree of integration in the Chinese markets. However, we should note that the mean of the UIP differential is the highest for Japan among the four countries, imply-ing that the financial market is not well integrated between China and Japan. Moreover, the mean of the PPP differential is the highest for UK, implying that the commodity market is also not well integrated between China and UK. This implies that governments should work closely to improve the degree of integration on the real and financial markets so as to achieve a win-win situation.
Secondly, China may pull the world, especially the developed countries out of recession in occurrence of economic shocks, for example like, the current financial crisis, provided that China could be the engine of the world economy in future. We found evidence that China maintains a strong link with developed economies, a necessary condition for China to become the engine of the world economy. Since both commodity and financial markets are integrated between China and developed economies, this implies Chinese real and fi-nancial markets are relatively efficient, and therefore the Chinese markets may have growth potentials for both corporate and individual investors. Finally, the process of integration with other economies will continue, and requires more political engagement and cooperation. We suggest further research on the determinants of integration, such that resources could devote to those determinants in an efficient way.
appendix 1-data sources
The data are gathered from China Information Bank, Data-Stream (electric version), and In-ternational Financial Statistics (IFS). The monthly series retrieved from the China Information Bank are the China 1-month interbank offer rate (before Jan, 2002), Euro-RMB exchange rate (before Dec, 1998), and China CPI. The monthly series retrieved from the Data Stream are the 1-month interbank interest rate of Europe (code no. EMINT1M), Japan (code no.JPIBO1M), UK (code no..BBGBP1M), US (code no.BBUSD1M), and China (CHIB1MO-available only after Jan, 2002), the exchange rate of Euro-RMB (code no. CHEURSP-available only after Dec, 1998), the Japanese Yen-RMB (code no. CHXRJPYE), the UK-China exchange rate (code no. CHIYUAN), the US-China exchange rate (code no. CHIYUA$), and the EU CPI (code no. EMCP…F). The monthly series retrieved from the IFS are the CPI of Japan (code no. 15864…ZF), the UK (code no. 11264…ZF), and the US (code no. 11164…ZF) from January 1997 to January 2005. The X-12 routine (with multiplicative factors on the levels) available in Eviews5.0 was used to seasonally adjust all the CPI series.
references
Amsler, C.; Lee, J. 1995. An LM test for a unit root in the presence of a structural change, Econometric
Theory 11(2): 359–368. doi:10.1017/S026646660000921X
Breuer, J. B.; McNown, R.; Wallace, M. S. 2001. Misleading inferences from panel unit-root tests with an illustration from purchasing power parity, Review of International Economics 9(3): 482–493. doi:10.1111/1467-9396.00294
Chan, T.-H.; Ahmad, Z. B.; Evan, L. 2007. Real Financial Integration among the East Asian Economies: A SURADF Panel Approach, MPRA Paper No. 2021. Available from Internet: <http://mpra.ub.uni-uenchen.de/2021/1/MPRA_paper_2021.pdf>.
Cheung, Y.-W.; Chinn, M. D.; Fujii, E. 2006. The Chinese economies in global context: the integration process and its determinants, Journal of the Japanese and International Economies 20(1): 128–153. doi:10.1016/j.jjie.2004.12.001
Cheung, Y.-W.; Chinn, M. D.; Fujii, E. 2003. China, Hong Kong, and Taiwan: a quantitative assessment of real and financial integration, China Economic Review 14(3): 281–303.
doi:10.1016/S1043-951X(03)00023-3
Cheung, Y.-W.; He, J.; Ng, L. 1994. Pacific-basin stock markets and real activity, Pacific-Basin Finance
Journal 2(2–3): 349–373. doi:10.1016/0927-538X(94)90024-8
Chinn, M.; Frankel, J. 1994. Financial links around the pacific rim: 1982–1992, in Exchange Rate Policy
and Interdependence: Perspective from the Pacific Basin. Edited by R. Glick and M. Hutchison.
Cam-bridge University Press, Chapter 2: 17–26.
De Brouwer, G. 1999. Financial integration in East Asia. Cambridge University Press. doi:10.1017/CBO9780511493355
Elliott, G.; Rothenberg, T. J.; Stock, J. H. 1996. Efficient tests for an autoregressive unit root, Econometrica 64(4): 813–836. doi:10.2307/2171846
Frankel, J. 1991. Quantifying international capital mobility, in National Saving and Economic Performance. Edited by D. Bernheim and J. Shoven. University of Chicago Press, 227–260.
Fernald, J.; Edison, H.; Loungani, P. 1999. Was China the first domino? Assessing links between China and other Asian economies, Journal of International Money and Finance 18(4): 515–535.
Glick, R.; Hutchison, M. 1990. Financial liberalization in the pacific basin: implications for real interest rate linkages, Journal of the Japanese and International Economies 4(1): 36–48.
doi:10.1016/0889-1583(90)90011-T
Im, K. S.; Pesaran, M. H.; Shin, Y. 1997. Testing for Unit Roots in Heterogeneous Panels. Mimeo, University of Cambridge.
Kahraman, C.; Kaya, İ. 2010. Investment analyses using fuzzy probability concept, Technological and
Economic Development of Economy 16(1): 43–57. doi:10.3846/tede.2010.03
Kumhof, M. 2001. International capital mobility in emerging markets: New evidence from daily data,
Review of International Economics 9(4): 626–640. doi:10.1111/1467-9396.00304
Kwiatkowski, D.; Phillips, P. C. B.; Schmidt, P; Shin, Y. 1992. Testing the null hypothesis of stationarity against the alternative of a unit root: How sure are we that economic time series have a unit root?
Journal of Econometrics 54(1–3): 159–178. doi:10.1016/0304-4076(92)90104-Y
Lane, P. R.; Schmukler, S. L. 2007. The evolving role of China and India in the international financial system, Open Economies Review 18(4): 499–520. doi:10.1007/s11079-007-9044-6
Lau, C. K. M. 2009. A more powerful panel unit root test with an application to PPP, Applied Economics
Letters 16(1): 75–80. doi:10.1080/13504850701735815
Lei, W. C. 2006. China and Taiwan: Real and financial integration Pre- and Post- China’s exchange rate
reform. Senior Thesis, University of Washington. Available from Internet: <
http://www.econ.wash-ington.edu/features/documents/Lei.pdf >.
Levin, A.; Lin, C.-F. 1993. Unit Root Tests in Panel Data: New Results. Discussion Paper, University of California, San Diego, No. 93–56.
Leybourne, S. J. 1995. Testing for unit roots using forward and reverse dickey-fuller regressions, Oxford
Bulletin of Economics and Statistics 57(4): 559–571.
Ma, Jun. 2001. Quantifying the effect of China’s WTO Entry, Global Markets Research (Hong Kong: DeutscheBank, December).
Maddala, G. S.; Wu, S. 1999. A comparative study of Unit Root Tests with panel data and a new simple test, Oxford Bulletin of Economics and Statistics 61(1): 631–652. doi:10.1111/1468-0084.61.s1.13 Maddala, G. S.; Kim, I. M. 1998. Unit Roots, Cointegration and Structural Change. Cambridge University
Press.
Ng, S.; Perron, P. 1995. Unit Root Tests in ARMA models with data dependent methods for the selection of the truncation lag, Journal of the American Statistical Association 90: 268–281. doi:10.2307/2291151
Noland, M.; Liu, L.-G.; Robinson, S.; Wang, Z. 1998. Global Economic Effects of the Asian Currency
De-valuations. Washington, D. C.: Institute of International Economics.
Park, H. J.; Fuller, W. A. 1995. Alternative estimators and Unit Root Tests for the autoregressive process,
Journal of Time Series Analysis 16(4): 415–429. doi:10.1111/j.1467-9892.1995.tb00243.x
Perron, P. 1989. The great crash, the oil price shock and the unit root hypothesis, Econometrica 57(6): 1361–1401. doi:10.2307/1913712
Perron, P.; Ng, S. 1996. Useful modifications to some Unit Root Tests with dependent errors and their asymptotic properties, The Review of Economic Studies 63(3): 435–463. doi:10.2307/2297890 Taylor, M. P.; Sarno, L. 1998. The behavior of real exchange rates during the Post Bretton woods period,
Journal of International Economics 46(2): 281–312. doi:10.1016/S0022-1996(97)00054-8
Tvaronavičienė, M.; Grybaitė, V.; Tvaronavičienė, A. 2009. If institutional performance matters: develop-ment comparisons of Lithuania, Latvia and Estonia, Journal of Business Economics and Managedevelop-ment 10(3): 271–278. doi:10.3846/1611-1699.2009.10.271-278
Wang, Z. 2003. The impact of China’s WTO Accession on Patterns of World Trade, Journal of Policy
Modeling 25(1): 1–41.
Wei, S.-J.; Liu, L.; Wang, Z.; Woo, W. T. 2000. The China money puzzle: Will devaluation of the Yuan help or hurt the Hong Kong dollar? China Economic Review 11(2): 171–188.
doi:10.1016/S1043-951X(00)00014-6
ar KInIja IntegrUota sU savo pagrIndInIaIs preKYBos partnerIaIs: ĮrodYmŲ apIe fInansInĘ Ir realIĄjĄ IntegraCIjĄ paIeŠKos
m. h. Bilgin, C. K. m. lau, m. tvaronavičienė Santrauka
Straipsnyje ieškoma įrodymų apie finansinę ir realiąją integraciją tarp Kinijos bei jos tarptautinės prekybos partnerių. Autorių patobulinta ekonometrikos metodo (panel unit root test) versija leidžia ekonomistams atsižvelgti į nagrinėjamų šalių tarpšakinių ryšių bei ekonomikos struktūrų specifiką. Finansinei bei realiai integracijai tarp Kinijos ir pagrindinių jos prekybos partnerių, t. y. Japonijos, Jungtinės Karalystės, Europos Sąjungos bei Jungtinių Amerikos Valstijų, vertinti buvo naudoti tokie kintamieji, kaip nepadengtų palū-kanų paritetas, palūpalū-kanų normų paritetas bei santykinis perkamosios galios paritetas. Tyrimo rezultatai patvirtino prielaidą apie gana didelę minėtų paritetų svarbą ir leido konstatuoti, kad Kinija yra gana stipriai finansiškai bei realiai integruota su savo pagrindinėmis prekybos partnerėmis.
reikšminiai žodžiai: finansinė ir reali integracija, nepadengtų palūkanų paritetas, palūkanų normų paritetas, perkamosios galios paritetas, užsienio prekyba, Kinija.
mehmet huseyin BIlgIn. Dr, Associate Professor, chair of the Department of International Finance at Kadir Has University. His scientific interests include macroeconomics, international economics, labor economics, and Turkish economy. Author of more than 20 papers in peer reviewed scientific journals and other publications.
Chi Keung marco laU. Dr, Lecturer at Hang Sang School of Commerce. His scientific interests include macroeconomics, finance, econometrics, and international economics. Author of 15 papers in peer reviewed scientific journals and other publications.
manuela tvaronavIčIenė. Dr, Professor at Vilnius Gediminas Technical University. Research interests include international economics, FDI, foreign trade, economic growth. Author of more than 40 papers in peer reviewed scientific journals and other publications.