Scene Classification Using Bag-of-Regions Representations
∗Demir G¨okalp and Selim Aksoy
Department of Computer Engineering
Bilkent University
Bilkent, 06800, Ankara, Turkey
{dgokalp,saksoy}@cs.bilkent.edu.tr
Abstract
This paper describes our work on classification of out-door scenes. First, images are partitioned into regions us-ing one-class classification and patch-based clusterus-ing al-gorithms where one-class classifiers model the regions with relatively uniform color and texture properties, and cluster-ing of patches aims to detect structures in the remaincluster-ing regions. Next, the resulting regions are clustered to ob-tain a codebook of region types, and two models are con-structed for scene representation: a “bag of individual re-gions” representation where each region is regarded sep-arately, and a “bag of region pairs” representation where regions with particular spatial relationships are considered together. Given these representations, scene classification is done using Bayesian classifiers. We also propose a novel re-gion selection algorithm that identifies rere-gion types that are frequently found in a particular class of scenes but rarely exist in other classes, and also consistently occur together in the same class of scenes. Experiments on the LabelMe data set showed that the proposed models significantly out-perform a baseline global feature-based approach.
1. Introduction
Scene classification is a fundamental problem in image understanding. Automatic techniques for associating scenes with semantic labels have a high potential for improving the performance of other computer vision applications such as browsing (natural grouping of images instead of clusters based only on low-level features), retrieval (filtering images in archives based on content) and object recognition (the probability of an unknown object/region that exhibits sev-eral local features of a ship actually being a ship can be in-creased if the scene context is known to be a coast with high ∗This work was supported in part by the TUBITAK Grant 104E077 and
European Commission Sixth Framework Programme Marie Curie Interna-tional Reintegration Grant MIRG-CT-2005-017504.
confidence but can be decreased if no water related context is dominant in that scene).
The scene classification problem has two critical compo-nents: representing scenes and learning models for semantic categories using these representations. Early work on scene classification used low-level global features extracted from the whole image or from a fixed spatial layout, and used these representations to classify images into a small number of categories such as indoor/outdoor, city/landscape, etc. More recent approaches introduced intermediate represen-tations that exploit local statistics in images. These interme-diate representations often make use of interest point detec-tors and model scenes as a collection of points labeled by a codebook constructed by quantizing these interest points using local invariant features. For example, Fei-Fei and Per-ona [4] represented a scene as a collection of local patches, denoted as codewords obtained by unsupervised learning. Each patch was represented as part of a “theme” and the theme distributions as well as the codeword distribution over the themes were learned without supervision.
Since local patch histograms, a.k.a. bag-of-words repre-sentations, disregard the spatial layout of the patches in an image, Lazebnik et al. [6] partitioned an image into increas-ingly fine grids and computed histograms of patches found inside each grid cell. The resulting spatial pyramid showed improvements over orderless bag-of-words representations but the spatial information encoded by this model is quite restrictive because it assumes that similar parts of scenes very often appear in similar grid cells. To introduce con-ceptual information, Money et al. [8] used the bag-of-words representation with probabilistic aspect models. They used the fact that specific learned aspects correlate with the se-mantic classes and can resolve some cases of visual poly-semy. They used the contextual models for man-made vs. natural patch classification. As an alternative model for spa-tial information, Boutell et al. [3] developed a scene config-uration using regions and their pairwise relationships. As an alternative model for codebook-based approaches, Gemert et al.[12] represented scenes using occurrence histograms
of local regions’ similarities to prototype concepts. In con-trast to a codebook approach, they used the similarities to all vocabulary elements to generalize beyond individual code-words. All of these approaches show that local patches can provide important information about the content of a scene but their weakness also comes from being local. They need to be combined into a spatial context where local and global information are used together for a more robust per-formance.
This paper describes our work on classification of out-door scenes. As the first step, images are partitioned into regions using one-class classification and patch-based clus-tering algorithms. Next, the resulting regions are clustered to obtain a codebook of region types. Then, two models are constructed for scene representation: 1) each region is regarded separately and a “bag of individual regions” repre-sentation is generated, 2) regions that satisfy certain spatial relationships are considered together and a “bag of region pairs” representation is obtained. Given these representa-tions, scene classification is done using Bayesian classifiers that model both individual regions and their pairwise spatial dependencies. With the observation that segmentation may produce several spurious regions and the resulting regions are not equally informative in distinguishing one scene class from the others, we also propose a novel selection algorithm that identifies region types that are frequently found in a par-ticular class of scenes but rarely exist in other classes, and consistently occur together in the same class of scenes.
The rest of the paper is organized as follows. Segmenta-tion of images into regions is described in SecSegmenta-tion 2. Rep-resentation of scenes using “bag of individual regions” and “bag of region pairs” are presented in Section 3. Algo-rithm for selection of discriminative regions is proposed in Section 4. Bayesian models for scene classification are de-scribed in Section 5. Experiments on the LabelMe data set are presented in Section 6, followed by conclusions in Sec-tion 7.
2. Finding local regions
Image segmentation is a very active but still unsolved problem in computer vision. Numerous algorithms were shown to work well on specific images; however, these re-sults have not been generally applicable except for mod-erately sized images with only a few objects of interest, a simple background, and relatively homogeneous and com-pact structures. Our experiments with popular segmenta-tion algorithms such as normalized cuts and JSEG showed that different settings of the parameters often undersegment or oversegment regions of interest (especially man-made structures) and it seems to be impossible to find a fixed set of parameters that produces reasonable results for a large data set.
Our segmentation approach combines pixel-based
low-level color and texture information with patch-based local structure information. We assume that a very precise seg-mentation of an image is not required for the scene classi-fication problem. This assumption relieves the requirement that a single technique must model and optimize both lo-cal uniformity such as color homogeneity and more global structure information that is crucial for segmenting man-made objects such as buildings. We propose a two-step algorithm where, first, one-class classifiers segment the re-gions that consist of pixels with relatively uniform color and texture properties (Section 2.1), then, clustering of patches aims to detect structures in the remaining regions (Section 2.2). Such combination becomes possible because both techniques have the capability of segmenting only some parts of an image and rejecting the rest when the corre-sponding models do not fit well, as opposed to most of the popular techniques that result in a complete partitioning of the whole image.
2.1. One-class region segmentation
In traditional multi-class classification, classifiers are trained using example patterns for each class to learn a model that estimates decision boundaries in the feature space. This corresponds to a complete (exhaustive and ex-clusive) partitioning of the feature space where each part of the space corresponds to a particular class and is separated from the others. On the other hand, the goal of one-class classification [11] is to accurately describe one class of pat-terns (called the target class) against the rest of the patpat-terns (called outliers). Hence, a test sample is either detected as belonging to the target class or it is rejected.
Many standard pattern recognition techniques tackle this type of problem using two-class classifiers. However, in real world classification problems, sampling a sufficient number of training data from each of the classes is not al-ways possible. Since these techniques require complete de-scriptions of both classes, they may not generalize well for the diverse (outlier) class. On the other hand, one-class clas-sifiers try to overcome this problem by modeling only the target class and assuming a low uniform distribution for the outlier class. After a probability density is estimated using the training patterns of the target class, a threshold is set on the tails of this distribution and a specified amount of the target data is rejected. This results in a decision boundary that separates the target class from the rest in the feature space.
In this work, we collected training examples for six gion types: sky, water, tree, sand, rock and road (these re-gion types were selected because they are common in out-door scenes). Then, we trained a separate classifier for each region type using pixel-based RGB, HSV and Gabor tex-ture featex-tures. For each classifier, we used a Gaussian mix-ture with four components to model the distribution of the
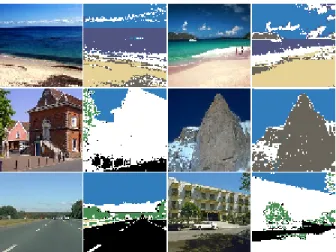
Figure 1. Examples for one-class classifier-based segmentation. 1st and 3rd columns are original images, 2nd and 4th columns show the segmentation. Pixels marked as white are unlabeled.
target class and use a rejection threshold of 0.05 to define the corresponding decision boundaries. Both the number of components and the rejection threshold were selected em-pirically. In the testing phase, for each pixel in an image, each classifier outputs a label as target or outlier. If all six classifiers output the outlier label, that pixel is decided to be definitely different from all six semantic classes and is left unlabeled. On the other hand, if there are classifiers with targetlabels, that pixel is assigned to the class that has the highest target probability among all classes. An important aspect of this labeling process is that only some parts of an image that belong to the semantic region types are labeled as foreground whereas the remaining parts are discarded as background unlike the common approach where the whole image is labeled. Another advantage is that a new region type can be added by training its one-class classifier with-out affecting the previously trained classifiers.
Finally, neighboring pixels with identical class labels are merged to form a segmentation. Morphological operations are used to filter out very small foreground regions and also merge very small background regions to their neighboring foreground regions. Resulting connected components pro-vide the first level of segmentation. We observed that using different color models improved the classification perfor-mance and adding texture information enabled better han-dling of classes such as sky and water or sand and rock that have similar colors. Figure 1 shows examples for one-class classifier-based segmentation of images.
2.2. Patch-based region segmentation
The goal of one-class region segmentation is to extract only the regions that have relatively homogeneous pixel content. Examples for such regions were given in the
pre-Figure 2. Keypoints that belong to the same structure but appear in different rotations.
vious section. Other regions that may be important for un-derstanding the scene context may not have homogeneous color or texture content but may exhibit a structure such as man-made objects like buildings or cars. We use patch-based local structure information to extract such regions.
The first step for modeling structure is the detection of localfeatures. For this purpose, we use the keypoint de-tector described in [7]. A common approach for generat-ing a feature descriptor for each keypoint is to compute a gradient orientation histogram [7] within its neighborhood. Even though this descriptor has been shown to be invariant to scale and rotation, and thus useful for matching parts of a specific object under such distortions, keypoints with simi-lar descriptors can also be found in different structures and this visual polysemy causes a problem in classification of these structures [8].
We believe that color information can be used to de-crease this problem. First, the keypoint detector is applied to each image within the regions rejected by the one-class classifiers. This helps filtering out spurious keypoints that are often detected in textured areas such as trees or water and in shadows. Then 16 × 16 patches are extracted around each resulting keypoint. Each patch is divided into four 4×4 quadrants and averages of RGB and HSV values of pixels are computed for each quadrant. This results in a descriptor with 24 features for each keypoint. We do not use texture in-formation in these descriptors because 4 × 4 neighborhoods are considered too small.
We assume that keypoints belonging to the same struc-ture have similar descriptors. Therefore, all keypoints in all images are clustered and keypoints belonging to the same cluster are given the same label. We use the k-means clus-tering algorithm with k empirically selected as 25 after ex-perimenting with different values. An important step in the clustering process is to preserve rotation invariance because keypoints from different parts of the same structure can have similar features but in different quadrants as shown in Figure 2. This invariance is achieved by considering four possible rotations of the quadrants in the computation of the Euclidean distance between the descriptors of two
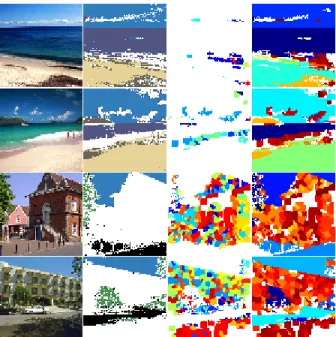
key-Figure 3. Example segmentations. 1st column shows original im-ages. 2nd column contains the one-class segmentations. 3rd col-umn shows the grown patches. 4th colcol-umn contains false color labeling of the final segmentations.
points, and taking the rotation corresponding to the smallest distance as the degree of similarity between these keypoints. Finally, after the keypoints are labeled according to the clustering of their patch-based color descriptors, neighbor-ing ones with the same label are grouped to form regions. We designed an iterative morphological dilation operation, similar to morphological reconstruction by dilation, where each keypoint is iteratively grown within the area restricted by the unlabeled regions of one-class segmentation and the growth support regions of other keypoints with different la-bels. In other words, the neighborhood around each key-point can grow until it reaches the boundary of one-class segmentation or the neighborhood of another keypoint with a different label for a specified number of iterations. Key-points that have the same label and whose neighborhoods merge after this growing process form spatially contiguous regions. Examples for final segmentations are shown in Fig-ure 3.
3. Scene representation
After an image is segmented into several regions, its con-tent is modeled in terms of the concon-tents of these regions and their spatial relationships. Regions are modeled using their color content (texture features can easily be added if needed) and their spatial relationships are modeled accord-ing to their vertical overlap. Details of this representation are given below.
Figure 4. Examples for region clusters. Each row represents a dif-ferent cluster.
3.1. Region codebook construction
Each region is modeled using the multivariate histogram of the HSV values of its pixels with 8 bins used for the H channel and 3 bins for each of S and V channels, resulting in a 72-dimensional feature vector. Then, a codebook of re-gion types is constructed using the k-means algorithm for vector quantization. The number of codewords (k) was set to 50 in the experiments presented in this paper (in Section 4 we describe a region selection algorithm to automatically determine which of these regions are important for classi-fication). The output of this step is a discrete type label assigned to each region. Note that the labels assigned to regions during the supervised one-class classification step are only used to find the corresponding connected compo-nents during region segmentation. The codebook construc-tion stage involves a more detailed labeling of the regions. Examples for region clusters are shown in Figure 4.
3.2. Spatial modeling of regions
Color information can be very useful in discriminating objects/regions in a scene if they have very distinct colors. However, just like any other low-level features, color can-not distinguish conceptually different objects/regions if they fall to nearby locations in the feature space.
An important element of image understanding is the spa-tial information. For example, finding a region with domi-nant blue color (that may be water) and a neighboring beige region (that may be sand) with another blue region (that may be sky) above them can increase the possibility of being a coast scene for that image. Furthermore, two scenes with similar regions can have very different interpretations if the regions have different spatial arrangements. Hence, spa-tial information can be used to resolve ambiguities in scene classification.
Different methods have been proposed to model region spatial relationships [1, 2, 5, 3]. However, it becomes a
combinatorial problem if one tries to model all possible relationships between regions in an image [1]. Therefore, we decided to use only the vertical relationship of “above-below” because it arguably provides a better characteriza-tion of the content. For example, flipping a photograph hor-izontally does not usually alter its semantics but flipping it vertically or rotating it greatly perturb its perception [9].
To determine the vertical relative position of two regions, we use their projections on both axes. If there is an overlap between the projections on the x-axis, their projections on the axis are compared. If they have no overlap on the y-axis or if the overlap is less than 50 percent of the area of the smaller region, we conclude that the one with a greater centroid ordinate is above the other one. If these overlap criteria are not met, it is concluded that no significant ver-tical relative arrangement exists between these two regions. The result of this step is a list of region pairs that satisfy the “above-below” relationship for each image.
3.3. Scene features
After each region is assigned a type label and the pair-wise spatial relationships are computed, each scene is rep-resented as a “bag-of-regions”. We consider two settings for this bag-of-regions representation:
1. each region is regarded separately and a “bag of indi-vidual regions” representation is generated, and 2. regions that satisfy the above-below relationship are
grouped together and a “bag of region pairs” represen-tation is constructed.
These representations are used for scene classification as described in Section 5.
4. Region selection
Feature selection is an important task in pattern recog-nition problems involving a lot of features. The selection process not only can reduce the cost of recognition, but also can result in a better classification accuracy due to finite sample size effects. Our motivation for applying a selection procedure to the set of regions resulting from segmentation and codebook construction processes follows the observa-tions that segmentation may produce several spurious re-gions and the resulting rere-gions are not equally informative in distinguishing one scene class from the others.
Given the set of regions in the codebook as in Section 3.1 and a set of example images for all scene classes of interest, our goal is to identify such region types that
1. are frequently found in a particular class of scenes but rarely exist in other classes, and
2. consistently occur together in the same class of scenes.
Research with similar motivation can be found in other do-mains such as remote sensing image classification or key-word extraction. For example, we modeled contextual in-formation in remote sensing images using regions and their spatial relationships [1]. First, we generated candidate re-gion groups that were combinatorially formed using all pos-sible relationships between all pospos-sible region types. Then, we defined a class separability criterion based on the within-class and between-within-class variances of the number of occur-rences of these groups in example images belonging to dif-ferent scenes. Finally, unknown scenes were classified us-ing a Bayesian framework based on the occurrence of se-lected region groups in these scenes.
Somol and Pudil [10] developed a generic multi-subset search algorithm that finds a set of subsets of features (each subset corresponding to a particular class) by taking into account the relations between features in each subset as well as between subsets. They applied this algorithm to the keyword extraction problem by promoting keyword pairs in different subsets if each one was frequent in one class but rare in the other class, and by preventing of keywords in the same subset co-occurring within the documents be-longing to the same class. This approach is related to the term frequency-inverse document frequency (tf -idf ) con-cept where tf gives a high weight to terms that appear in a document many times and idf tends to filter out common terms that also appear in many other documents.
However, the importance of the selection process is often ignored in related recent work on patch-based object recog-nition and scene classification where the number of patches (a.k.a. visterms, local invariant features) is heuristically set to a large number such as 1,000. One particular example for discriminative patch selection is [13] where, first, a graph-based optimization approach was used to find a subset of patches from the positive training images where every se-lected patch was distant from the patches in the negative training images but was highly similar to other patches in the positive training images. Then, each of the selected patches was evaluated, in isolation, based on its perfor-mance in separating the positive and negative training im-ages using a threshold on distances between patch features. This approach was evaluated in an object class recognition scenario where negative training images did not contain any instance of the target object whereas positive images con-tained exactly one instance, and gave higher recognition rates than the cases where no selection was used.
We formulate the feature selection process as a multi-subset search problem as in [10] with the major difference being the definition of the optimization criteria for finding the best set of subsets of regions (because the motivations, requirements and inputs for keyword selection are different from our region selection setting). Let T be the set of region
types in the codebook (|T | = k) and
Xd= {Sj|j = 1, . . . , c} (1)
be a set of subsets, also called a multi-subset, of these types where
Sj= {tjn|n = 1, . . . , cj; tjn∈ T } (2)
is the subset for the j’th class, c is the number of classes, and cjis the size of the j’th subset. The size of the
multi-subset Xdis |Xd| =
Pc
j=1|Sj| = d.
Given a criterion J (·) that describes the quality of a multi-subset, the goal is to find such subset Xdfor which
the criterion is maximum. A suboptimal solution to this problem can be found using the sequential forward selec-tion algorithm that starts with an empty set X0and
itera-tively finds a new set Xi+1by adding a new feature to the
set Xisuch that
J (Xi+1) = max j=1,...,c t∈T \Sj
J ({S1, . . . , Sj−1, Sj∪ {t}, Sj+1, . . . , Sc})
(3)
until the multi-subset Xdwith the required size is obtained.
Our definition of J (·) combines two components (as in [10]): J (Xd) = X j=1,...,c n=1,...,cj Aj(tjn) X i=1,...,c i6=j m=1,...,ci Ej,i(tjn, tim) ! (4)
where Aj(t) describes the intra-subset importance of region
type t within Sjand Ej,i(t, ¯t) describes the inter-subset
re-lation between region types t ∈ Sjand ¯t ∈ Si.
Given I as the whole set of training images, Ijas the
set of training images for the j’th class, and Hl(t) as the
frequency of the t’th region type in the l’th image, we define these components as follows (different from [10]):
Aj(t) = X l∈Ij Hl(t) ! 1 +X l∈Ij X ¯ t∈Sj\{t} min{Hl(t), Hl(¯t)} ! 1 + X i=1,...,c i6=j X l∈Ii Hl(t) ! (5)
promotes region types that are frequently found in exam-ples for a particular class (the first term in the numerator) and consistently occur together with other region types se-lected for the same class in the same examples (the second term in the numerator) while demoting types that are also similarly frequent in examples for other classes (term in the denominator), whereas Ej,i(t, ¯t) = X l∈Ij max{Hl(t) − Hl(¯t), 0} ! × X l∈Ii max{Hl(¯t) − Hl(t), 0} ! (6)
promotes pairs of region types of which each one is frequent in examples of one class but is rarely found in examples of the other class. This setting does not depend on a specific classifier unlike most of the traditional feature selection al-gorithms because it performs selection only based on the frequencies of region types in example images for different classes.
5. Bayesian scene classification
A scene represented as a bag-of-regions with associated region labels can be classified using the Bayesian decision rule according to posterior probabilities. The scene with the set of regions {x1, . . . , xm} is assigned to the class
wj∗= arg max
j=1,...,cp(wj|x1, . . . , xm) (7)
where wj represents the j’th class, c is the number of
classes, and m is the number of regions in the scene. Using the Bayes rule, the posterior probabilities can be computed as
p(wj|x1, . . . , xm) =
p(x1, . . . , xm|wj)p(wj)
p(x1, . . . , xm)
. (8) Assuming equal priors for all classes, the classification problem reduces to the computation of class-conditional probabilities p(x1, . . . , xm|wj). Given the label for each
re-gion as xi= u where u ∈ {1, . . . , k}, the class-conditional
probability would normally have kmterms when estimated
jointly. To simplify this estimation, we make two separate assumptions:
1. Each region is assumed to be independent of others given the class.
2. Regions are assumed to have pairwise spatial depen-dencies but the pairs are assumed to be independent of others given the class.
The first assumption corresponds to a “bag of individ-ual regions” representation whereas the second assumption corresponds to a “bag of region pairs” representation. Us-ing multinomial density models, the probability values are computed using the maximum likelihood estimates where a total of k parameters need to be estimated for each class in the first model and a total of k2parameters need to be
estimated for each class in the second model.
When region selection is performed before classification, the “bag of individual regions” and “bag of region pairs” representations are both computed using only the regions selected after the process described in Section 4.
6. Experiments
The proposed algorithms were evaluated using a subset of the MIT LabelMe data set that contains 7 scene cate-gories: coast, forest, highway, inside city, mountain, open
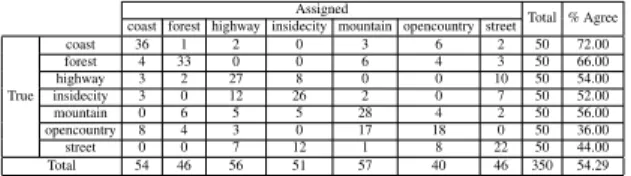
Table 1. Confusion matrix for the bag of individual regions repre-sentation without region selection.
Assigned
Total % Agree coast forest highway insidecity mountain opencountry street
True coast 36 1 2 0 3 6 2 50 72.00 forest 4 33 0 0 6 4 3 50 66.00 highway 3 2 27 8 0 0 10 50 54.00 insidecity 3 0 12 26 2 0 7 50 52.00 mountain 0 6 5 5 28 4 2 50 56.00 opencountry 8 4 3 0 17 18 0 50 36.00 street 0 0 7 12 1 8 22 50 44.00 Total 54 46 56 51 57 40 46 350 54.29
Table 2. Confusion matrix for the bag of region pairs representa-tion without region selecrepresenta-tion.
Assigned
Total % Agree coast forest highway insidecity mountain opencountry street
True coast 39 0 2 0 4 5 0 50 78.00 forest 1 34 0 4 3 8 0 50 68.00 highway 0 0 35 7 0 0 8 50 70.00 insidecity 2 3 10 20 2 3 10 50 40.00 mountain 2 3 2 0 37 6 0 50 74.00 opencountry 3 6 3 2 16 20 0 50 40.00 street 1 1 5 7 2 5 29 50 58.00 Total 48 47 57 40 64 47 47 350 61.14
country, and street. From a total of 1,050 images, 700 were used for training (100 images for each scene category) and 350 used for testing (50 images for each category). Each image was segmented as described in Section 2, and the “bag of individual regions” and “bag of region pairs” rep-resentations were computed using a codebook of 50 region types as described in Section 3. The number of region types in the codebook were also reduced to 20 using the selection algorithm described in Section 4, and the bag of regions representations were also computed for this codebook.
The experiments were done for four different cases: • using bag of individual regions representation, • using bag of region pairs representation,
• using bag of individual regions representation after se-lection,
• using bag of region pairs representation after selection. The confusion matrices for these cases are given in Tables 1–4. The correct classification rates of 54.29%, 61.14%, 57.43% and 62.00% show that spatial modeling has a very important contribution to classification. Furthermore, the selection algorithm that resulted in a smaller region code-book improved the results both for the bag of individual re-gions and for the bag of region pairs representations. The confusion matrices also show that most of the misclassifi-cations occur in semantically similar categories. In partic-ular, the open country and inside city categories have the largest error rate. When we analyze the confusion matri-ces in detail, we can see that the former is mostly confused with mountain, coast and forest categories, whereas the lat-ter is mostly confused with highway and street categories, but these errors can be acceptable in most cases. Examples for correct and wrong classifications using the bag of re-gion pairs representation after rere-gion selection are given in Figures 5 and 6.
Table 3. Confusion matrix for the bag of individual regions repre-sentation after region selection.
Assigned
Total % Agree coast forest highway insidecity mountain opencountry street
True coast 38 2 2 1 3 4 0 50 76.00 forest 4 36 0 0 7 2 1 50 72.00 highway 2 2 32 6 0 2 6 50 64.00 insidecity 3 1 12 22 2 0 10 50 44.00 mountain 2 3 5 0 32 6 2 50 64.00 opencountry 9 8 3 1 14 14 1 50 28.00 street 0 0 9 6 2 6 27 50 54.00 Total 58 52 63 36 60 34 47 350 57.43
Table 4. Confusion matrix for the bag of region pairs representa-tion after region selecrepresenta-tion.
Assigned
Total % Agree coast forest highway insidecity mountain opencountry street
True coast 42 0 0 1 3 4 0 50 84.00 forest 1 38 0 2 4 4 1 50 76.00 highway 1 1 31 4 2 2 9 50 62.00 insidecity 3 4 12 19 1 1 10 50 38.00 mountain 1 5 0 0 40 3 1 50 80.00 opencountry 8 5 1 2 9 25 0 50 50.00 street 2 1 8 12 2 3 22 50 44.00 Total 58 54 52 40 61 42 43 350 62.00
Table 5. Correct classification rates for different statistical classi-fiers using global HSV histograms.
Linear Gaussian classifier 32.86% Quadratic Gaussian classifier 29.43% k-nearest neighbor classifier 37.43% Parzen window classifier 40.00% Support vector machines 34.29%
We also compared the performances of the region-based approaches with those of different statistical classifiers us-ing global HSV histograms (usus-ing 8 × 3 × 3 bins) as the tra-ditional baseline approach for scene categorization. The re-sults are summarized in Table 5. We can conclude that even the worst region-based result is significantly better than the best global feature-based performance.
7. Conclusions
We described a new method for scene classification where images were partially segmented into regions us-ing one-class classification and patch-based clusterus-ing al-gorithms, the resulting regions were clustered to obtain a codebook of region types, and pairwise region spatial rela-tionships were modeled using vertical projections. We con-structed two models for scene representation: a “bag of in-dividual regions” representation where each region was re-garded separately, and a “bag of region pairs” representation where spatially related regions were considered together. Given these representations, scene classification was done using Bayesian classifiers. We also proposed a novel region selection algorithm to identify such region types that were frequently found in a particular class of scenes but rarely existed in other classes, and consistently occurred together in the same class of scenes. Experiments on the LabelMe data set showed that the proposed models significantly out-perform global feature-based techniques.
Future work involves building additional local descrip-tors to improve modeling of structural information for
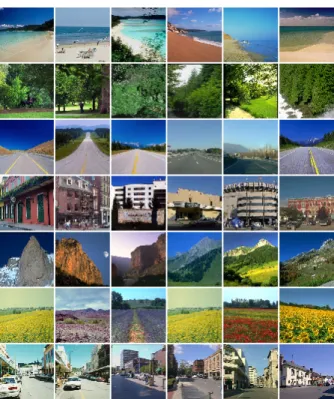
im-Figure 5. Examples for correctly classified scenes. Rows corre-spond to the rows of the confusion matrices.
age segmentation, alternative techniques for region code-book construction, and evaluation of the region selection algorithm in larger data sets. We believe that incorporat-ing spatial information and a discriminative selection pro-cess to the formulation of the scene classification problem will provide greater improvements in both quantitative and qualitative performance.
References
[1] S. Aksoy, K. Koperski, C. Tusk, G. Marchisio, and J. C. Tilton. Learning Bayesian classifiers for scene classification with a visual grammar. IEEE Transactions on Geoscience and Remote Sensing, 43(3):581–589, March 2005. [2] I. Bloch. Fuzzy spatial relationships for image processing
and interpretation: A review. Image and Vision Computing, 23(2):89–110, February 2005.
[3] M. R. Boutell, J. Luo, and C. M. Brown. Factor graphs for region-based whole-scene classification. In CVPR, Semantic Learning Workshop, New York, NY, June 17–22, 2006. [4] L. Fei-Fei and P. Perona. A Bayesian hierarchical model for
learning natural scene categories. In CVPR, volume 2, pages 524–531, San Diego, CA, June 20–25, 2005.
[5] S. Kumar and M. Hebert. A hierarchical field framework for unified context-based classification. In ICCV, volume 2, pages 1284–1291, Beijing, China, October 17–21, 2005. [6] S. Lazebnik, C. Schmid, and J. Ponce. Beyond bags of
features: Spatial pyramid matching for recognizing natural
Figure 6. Examples for wrongly classified scenes. Rows corre-spond to the rows of the confusion matrices.
scene categories. In CVPR, volume 2, pages 2169–2178, New York, NY, June 17–22, 2006.
[7] D. G. Lowe. Distinctive image features from scale-invariant keypoints. International Journal of Computer Vision, 60(2):91–110, November 2004.
[8] F. Monay, P. Quelhas, J.-M. Odobez, and D. Gatica-Perez. Integrating co-occurrence and spatial contexts on patch-based scene segmentation. In CVPR, Beyond Patches Work-shop, New York, NY, June 17–22, 2006.
[9] J. R. Smith and C.-S. Li. Image classification and query-ing usquery-ing composite region templates. Computer Vision and Image Understanding, 75(1/2):165–174, July/August 1999. [10] P. Somol and P. Pudil. Multi-subset selection for keyword
extraction and other prototype search tasks using feature se-lection algorithms. In ICPR, volume 2, pages 736–739, Hong Kong, August 20–24, 2006.
[11] D. M. J. Tax. One-Class Classification. PhD thesis, Delft University of Technology, Delft, The Netherlands, 2001. [12] J. C. van Gemert, J. Geusebroek, C. J. Veenman, C. G. M.
Snoek, and A. W. M. Smeulders. Robust scene categoriza-tion by learning image statistics in context. In CVPR, Seman-tic Learning Workshop, New York, NY, June 17–22, 2006. [13] A. Vashist, Z. Zhipeng, A. Elgammal, I. Muchnik, and
C. Kulikowski. Discriminative patch selection using combi-natorial and statistical models for patch-based object recog-nition. In CVPR, Beyond Patches Workshop, New York, NY, June 17–22, 2006.