THE EFFECT OF CONTEXT-DEPENDENT
LIGHTNESS ON CONTRAST DETECTION
AND IDENTIFICATION, AND ITS NEURAL
CORRELATES
a dissertation submitted to
the graduate school of engineering and science
of bilkent university
in partial fulfillment of the requirements for
the degree of
doctor of philosophy
in
neuroscience
By
Zahide Pamir Karatok
October 2017
THE EFFECT OF CONTEXT-DEPENDENT LIGHTNESS ON CONTRAST DETECTION AND IDENTIFICATION, AND ITS NEURAL CORRELATES
By Zahide Pamir Karatok October 2017
We certify that we have read this dissertation and that in our opinion it is fully adequate, in scope and in quality, as a dissertation for the degree of Doctor of Philosophy.
H¨useyin Boyacı(Advisor)
Hacı Hulusi Kafalıg¨on¨ul
Miri Besken
Cengiz Acart¨urk
Didem Kadıhasano˜glu
Approved for the Graduate School of Engineering and Science:
Ezhan Kara¸san
ABSTRACT
THE EFFECT OF CONTEXT-DEPENDENT
LIGHTNESS ON CONTRAST DETECTION AND
IDENTIFICATION, AND ITS NEURAL CORRELATES
Zahide Pamir Karatok Ph.D. in Neuroscience Advisor: H¨useyin Boyacı
October 2017
Perceived contrast of a grating varies with its background (or mean) luminance: of the two gratings with the same photometric contrast the one on higher lumi-nance background appears to have higher contrast. On the other hand, context often causes a large perceived difference between equiluminant regions (e.g., si-multaneous brightness contrast). Does perceived contrast also vary with context-dependent background lightness even when the luminance remains constant? In this study, the effect of context-dependent lightness on contrast perception was investigated using psychophysical and functional magnetic resonance imag-ing (fMRI) methods. First, we measured appearance judgments of participants and demonstrated that context-dependent lightness of background influences the perceived contrast of rectified gratings. Perceived contrast of gratings superim-posed on equiluminant but perceptually lighter background is higher compared to ones on perceptually darker backgrounds. However, this pattern is valid only for incremental, not for decremental contrast.
Literature indicates a significant difference between visual processing near and above threshold. Also, behaviorally it has been shown that appearance and threshold tasks are mediated by different mechanisms. Therefore, here, we also measured the effect of context-dependent lightness on contrast detection and discrimination thresholds using a 2-IFC procedure. Results indicate that both detection and discrimination thresholds are lower for the gratings superimposed on perceptually lighter backgrounds. Differently from the appearance results, the effect was observed both for incremental and decremental contrast.
In an fMRI study, we investigated whether activity in any brain region cor-relates with background-lightness-dependent contrast perception. Although our stimulus was physically identical, we observed difference in BOLD response within pre-defined region of interests (ROIs) in different visual areas. Both for incremen-tal and decremenincremen-tal contrast, activation, especially in V1, was greater when the
iv
grating was superimposed on lighter background for all the contrast levels tested. Variation in V1 activity with varying contrast links better with the detection and discrimination thresholds than the appearance results. Therefore, this study might offer a neural evidence for dissociation between the mechanisms underly-ing detection (threshold) and identification (appearance) measures. However, the relationship between the threshold and fMRI data does not really agree with the previous findings in literature. These results indicate that the neural activation caused by the detection mechanism may change depending on the absolute or perceived value of the contrast.
Keywords: Contrast, lightness, context, detection, identification, threshold, ap-pearance.
¨
OZET
BA ˜
GLAMA DAYALI AC
¸ IKLI ˜
GIN KONTRAST
SAPTAMA VE TANIMLAMA ¨
UZER˙INDEK˙I ETK˙IS˙I VE
BU ETK˙IN˙IN N ¨
ORAL KORELASYONLARI
Zahide Pamir Karatok N¨orobilim, Doktora Tez Danı¸smanı: H¨useyin Boyacı
Ekim 2017
Basit bir g¨orsel uyaranın algılanan kontrastı, ¨uzerinde bulundu˘gu fonun lumi-nansına (veya ortalama luminansa) ba˘glı olarak de˘gi¸sir. Fiziksel olarak e¸sit kontrasta sahip iki uyarandan y¨uksek luminanslı fonda g¨osterilen uyaranın kon-trastı daha y¨uksek algılanmaktadır. Bir di˘ger yandan, ba˘glam sıklıkla luminansı e¸sit uyaranların algılanan de˘gerlerinin (¨orne˘gin a¸cıklık) farklı olmasına sebep olur (e¸s zamanlı parlaklık kontrastı uyaranı gibi). Bu bilgiler algılanan kon-trastın fonun luminansı sabit tutuldu˘gunda ba˘glamın etkisiyle de˘gi¸sen a¸cıklık de˘gerine ba˘glı olarak de˘gi¸sip de˘gi¸smeyece˘gi sorusunu do˘gurmaktadır. Bu soruyu yanıtlamak amacıyla, bu ¸calı¸smada, psikofizik ve fonksiyonel manyetik rezo-nans g¨or¨unt¨uleme (fMRG) y¨ontemleri kullanılarak, ba˘glama dayalı a¸cıklı˘gın kon-trast algısı ¨uzerindeki etkisi ara¸stırılmı¸stır. Bunun i¸cin ilk olarak ba˘glama dayalı a¸cıklı˘gın algılanan kontrastı nasıl etkiledi˘gi ¨ol¸c¨ulm¨u¸s ve bir kontrast barının algılanan kontrastının ¨uzerinde bulundu˘gu fonun a¸cıklık de˘gerinden etk-ilendi˘gi g¨osterilmi¸stir. Buna g¨ore, fiziksel olarak tamamen birbirinin aynı ol-malarına kar¸sın, a¸cıklık de˘geri y¨uksek olan fon ¨uzerindeki barın kontrastı daha y¨uksek olarak de˘gerlendirilmi¸stir. Sonu¸clara g¨ore, g¨orsel sistemin a¸cıklık de˘gerini algılanan kontrast de˘gerinin hesaplanmasında kullandı˘gı g¨or¨ulm¨u¸st¨ur. Fakat bu etki, sadece luminansı artan kontrast barları (pozitif kontrast) kullanıldı˘gında g¨or¨ulm¨u¸s; luminansı azalan kontrast barları (negatif kontrast) kullanıldı˘gında ise kaybolmu¸stur.
Literat¨urde, bir uyaranın algılanan de˘gerinin ve e¸sik de˘gerinin farklı mekaniz-malar tarafından belirlendi˘gine dair bulgular mevcuttur. Bu nedenle, bu ¸calı¸smada ayrıca ba˘glama dayalı a¸cıklı˘gın kontrast saptama ve ayırsama e¸si˘gini nasıl etkiledi˘gi uyumsal iki aralıklı zorunlu se¸cim y¨ontemi kullanılarak ara¸stırılmı¸stır. Sonu¸clar, kontrast barlarının a¸cıklı˘gı y¨uksek olan fon ¨uzerine yerle¸stirildi˘ginde a¸cıklı˘gı d¨u¸s¨uk olan fon ¨uzerine yerle¸stirilmelerine kıyasla sezim
vi
ve ayırsama e¸si˘ginin daha d¨u¸s¨uk oldu˘gunu g¨ostermi¸stir. Algılanan kontrast deneylerinden farklı olarak burada hem pozitif hem negatif kontrast barları ba˘glama dayalı a¸cıklıktan etkilenmi¸stir.
fMRG ¸calı¸smasında, beyindeki n¨oral aktivasyonun ba˘glama dayalı a¸cıklık etk-isini yansıtıp yansıtmadı˘gı ara¸stırılmı¸stır. G¨osterilen fon ve kontrast barları fizik-sel olarak tamamen birbirinin aynı olmasına kar¸sın g¨orsel alanlarda ¨onceden belir-lenmi¸s ilgi b¨olgeleri i¸cinde bu uyaranlara verilen tepki farklılık g¨ostermi¸stir. Buna g¨ore, ¨ozellikle V1 b¨olgesinde, test edilen t¨um kontrast de˘gerleri i¸cin kontrast bar-larının, a¸cıklı˘gı daha y¨uksek olan fonlara yerle¸stirildi˘gi durumda daha y¨uksek BOLD aktivasyonuna sebep oldu˘gu g¨ozlenmi¸stir. V1’deki aktivasyon de˘gi¸simi algılanan kontrast de˘gerlerine kıyasla e¸sik de˘gerleriyle daha uyumludur. Bu ne-denle, bu ¸calı¸smanın saptama ve tanımlama g¨orevlerinin farklı mekanizmalar tarafından y¨ur¨ut¨uld¨u˘g¨une dair n¨oral bir kanıt oldu˘gu d¨u¸s¨un¨ulmektedir. Fakat, bu ¸calı¸smadaki e¸sik ile fMRI verileri arasındaki ili¸ski, literat¨urdeki daha ¨onceki bulgularla tam olarak uyumlu de˘gildir. Bu sonu¸clar saptama mekanizmasının yarattı˘gı n¨oral aktivasyonun kontrastın mutlak veya algılanan de˘gerlerine ba˘glı olarak da de˘gi¸sebilece˘gi sonucuna i¸saret etmektedir.
Acknowledgement
I am grateful to many people who made this thesis possible. First of all, I would like to express my deepest appreciation to my advisor H¨useyin Boyacı for his precious support and guidance in all aspects of my graduate studies. It was a priceless opportunity for me to be able to work with him and to learn from him. He has always made me feel that he believes in me and this has kept me motivated throughout this challenging journey.
I would like to thank to Hulusi Kafalıg¨on¨ul not only for his valuable time and comments on this thesis but also for always being there whenever I need advise that extends beyond my Ph.D. studies. I appreciate all the wisdom and experiences he shared with me.
I would also like to thank to Miri Besken for her critical comments and discus-sions throughout the thesis progress committees; and to the other jury members Cengiz Acart¨urk and Didem Kadıhasano˘glu for allocating their valuable times to read and comment on this thesis.
I would like to thank to my dear friend Buse Merve ¨Urgen for making UMRAM more than a work place for me. I am grateful for her companionship, endless support, and intellectual comments on my studies. I want to thank to Emre Kale for helping me whenever I felt desperate on technical issues. I also want to thank to all other friends in UMRAM for their friendship, good memories, and their support in my studies.
I am grateful to my family for their continuous and unconditional support. Fi-nally, I would like to express my warm gratitude to my beloved husband Mustafa Karatok for sharing all the burden and happiness with me. I feel privileged to have him in my life, and to be embraced by his love and support.
I want to acknowledge The Scientific and Technological Research Council of Turkey (TUB˙ITAK) for supporting me through BiDEB (2211-E) scholarship, and this study through 1001 Grant (funding ID: 113K210 and 116K380).
Contents
1 Introduction 1
1.1 Background . . . 1
1.2 Scope and Motivation of the Present Study . . . 5
2 Perceived Contrast in Context 8 2.1 Introduction . . . 8
2.2 Measurement of the Lightness Effect . . . 9
2.2.1 Methods . . . 10
2.2.2 Results . . . 12
2.2.3 Intermediate Summary and Discussion . . . 13
2.3 Measurement of Perceived Contrast . . . 14
2.3.1 Methods . . . 14
2.3.2 Results . . . 17
2.3.3 Intermediate Summary and Discussion . . . 19
2.4 Effect of Background Luminance Differences on Perceived Contrast 19 2.4.1 Methods . . . 20
2.4.2 Results . . . 21
2.4.3 Intermediate Summary and Discussion . . . 23
2.5 Measurement of Lightness of the Gratings . . . 23
2.5.1 Methods . . . 24
2.5.2 Results . . . 24
2.6 Summary and Discussion . . . 25
3 Contrast Detection Threshold Measurement Using Illusory
CONTENTS ix
3.1 Methods . . . 28
3.1.1 Participants . . . 28
3.1.2 Stimuli and Design . . . 28
3.1.3 Data Analysis . . . 30
3.2 Results . . . 31
3.3 Summary and Discussion . . . 33
4 Contrast Detection Threshold Measurement Using Simultaneous Brightness Contrast Illusion 35 4.1 Measurement of Perceived Contrast . . . 36
4.1.1 Methods . . . 36
4.1.2 Results . . . 38
4.1.3 Intermediate Summary and Discussion . . . 39
4.2 Measurement of Contrast Detection Threshold . . . 40
4.2.1 Methods . . . 40
4.2.2 Results . . . 44
4.2.3 Intermediate Summary and Discussion . . . 44
4.3 Summary and Discussion . . . 45
5 fMRI of Perceived Contrast in Context 46 5.1 Behavioral Appearance Experiment in the Scanner . . . 47
5.1.1 Methods . . . 47
5.1.2 Results . . . 48
5.2 fMRI Experiment . . . 49
5.2.1 Methods . . . 49
5.2.2 Results . . . 54
5.3 Summary and Discussion . . . 58
6 Linking Behavioral and Neural Data 60 6.1 Contrast Discrimination Threshold Measurement . . . 61
6.1.1 Method . . . 61
6.1.2 Results . . . 64
6.1.3 Intermediate Summary and Discussion . . . 65
CONTENTS x
6.2.1 Behavioral Adjustment Experiment in the Scanner . . . . 70
6.2.2 fMRI Experiment . . . 72
6.2.3 Intermediate Summary and Discussion . . . 78
7 Discussion 83 7.1 Conclusions . . . 91
A Contrast Detection Measurement of Incremental Gratings 101 A.1 Methods . . . 101
A.1.1 Participants . . . 101
A.1.2 Stimuli and Design . . . 102
A.1.3 Data Analysis . . . 103
A.2 Results . . . 103
A.3 Intermediate Summary and Discussion . . . 104
B An alternative study to link behavioral and neural data 105 B.1 Discrimination threshold measurement . . . 105
B.1.1 Method . . . 106
B.1.2 Results . . . 108
B.1.3 Intermediate Summary and Discussion . . . 108
B.2 fMRI of Contrast Discrimination Measurement . . . 109
B.2.1 Method . . . 110
B.2.2 Results . . . 112
List of Figures
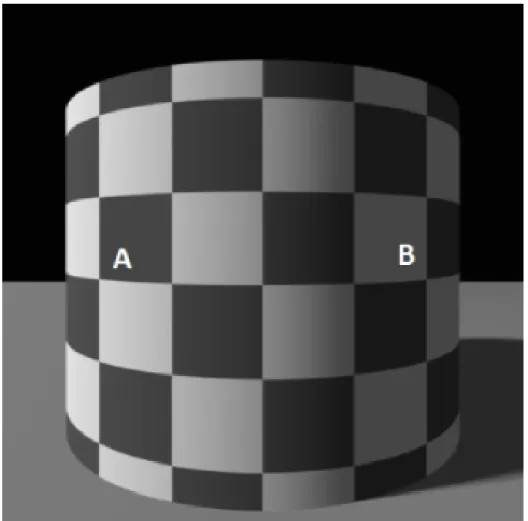
1.1 Illusory checkerboard stimulus. “Context squares”, A and B have identical luminance but different lightness. . . 3
2.1 Examples of the stimulus after image manipulations. “Context squares” (CSs), A and B in the first image and in the same position in all images, have identical luminance but different lightness. . . 10 2.2 Lightness experiment. Participants’ task was to adjust the
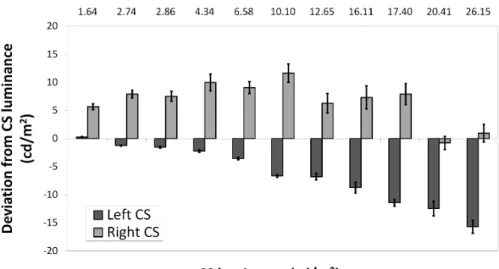
lu-minance of an external patch to match the lightness of the con-text squares. The matching patch was placed on a random-noise background. Instructions about which context square is tested in that particular trial was given by the text strings “LEFT” and “RIGHT” on the random-noise background. The arrow and the text “adjustable patch” were not shown on the screen during the experiment. . . 11 2.3 Results of the lightness experiment. Deviation of settings from
actual luminance is plotted for each CS position as a function of context square luminance. Positive (negative) deviation means set-ting was higher (lower) than the actual CS luminance. A value of “0” corresponds to perfect luminance match. Under all conditions, participants judged the right CS statistically significantly lighter, consistent with the subjective experience in Figure 1.1. Error bars show ±1 SEM. . . 13
LIST OF FIGURES xii
2.4 Task and procedure in the contrast experiment. Participants were asked to adjust the contrast of a “match” grating to match that of the “standard”. Standard was always placed on one of the CSs. The match was placed on a square, which was placed on a random-noise background. The arrow, and the text “adjustable grating” were not shown on the screen during the experiment. (A) Incre-mental grating condition, (B) decreIncre-mental grating condition. . . . 15 2.5 Mean effect scores, ¯ρC, from the contrast experiment. Brightness
of the bars indicate different contrast levels. Because frequency did not have a main effect, effect scores are averaged over three frequency levels. An effect score of “0” means that there is no dif-ference between perceived contrasts of the gratings superimposed on the right and left CSs. A positive (negative) value means that the absolute value of the perceived contrast of the grating on the lighter CS was greater (less) than that on the darker one. (A) In-cremental grating condition. (B) DeIn-cremental grating condition. Error bars show ±1 SEM. . . 18 2.6 Perceived contrast of gratings on isolated backgrounds.
Exper-imental design and results. Participants adjusted the contrast of the match grating to match that of the standard on isolated patches. The geometry and position of the patches were identical to those of the CSs in the contextual stimulus. However this time the patches actually differed in luminance. (A) Incremental grat-ings. (B) Decremental gratgrat-ings. The two bar plots on the right show the results presented in the same format as in Figure 2.5. The pattern of results was similar to the one found in Experiment 2.3. Error bars show ±1 SEM. . . 22
LIST OF FIGURES xiii
2.7 Lightness of the gratings. In this experiment participants matched the lightness of the gratings using an external circular match placed on a patch and random noise background. “Derived contrast” and “derived effect score” were computed using those estimates. Derived effect scores and the effect scores from Experiment 2 are shown in the right panel. Clearly, participants performed the two tasks differently. Error bars show ±1 SEM. . . 25
3.1 Protocol for the detection threshold experiment. At the beginning of each trial, either original checkerboard stimulus or the mirror-symmetric version of it was presented randomly. An arrow was used to inform participants about the side of the stimulus on which the grating would be presented. Gratings were superimposed on only one of the CSs, either darker or lighter, throughout a session. In each trial, a grating is presented at one of the intervals selected randomly. Participants are asked to decide in which interval the grating is presented. Participants are allowed to look at the target CS directly. . . 29 3.2 Results of contrast detection experiment using illusory
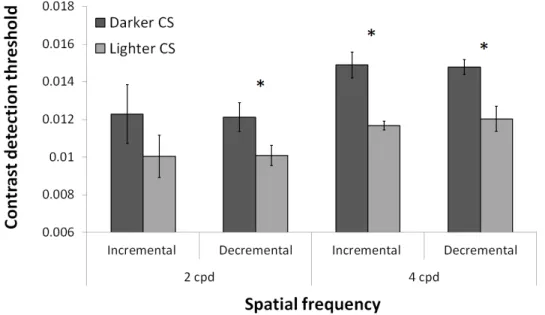
checker-board stimulus. Mean detection thresholds for the contrast grat-ings superimposed on darker or lighter context square across dif-ferent contrast types and frequency levels are plotted. Detection threshold is lower for the gratings superimposed on equiluminant but perceptually lighter CSs. * p < 0.05. Error bars show ±1 SEM. 31 3.3 Results of contrast detection experiment using illusory
checker-board stimulus. Mean detection thresholds for the contrast grat-ings superimposed on darker or lighter context square across dif-ferent contrast types are plotted. Because frequency did not have a main effect, thresholds were averaged over two frequency levels. Detection threshold is lower for both incremental and decremental gratings superimposed on equiluminant but perceptually lighter target regions. * p < 0.01. Error bars show ±1 SEM. . . 32
LIST OF FIGURES xiv
3.4 Mean proportion of correct responses averaged across participants and two frequency levels as a function of stimulus contrast, and corresponding psychometric functions (PF). . . 33
4.1 An example of simultaneous brightness contrast effect. Although the inner squares have equal luminance value, most observers have reported different brightness values [19]. . . 36 4.2 Task and procedure in the contrast adjustment experiment
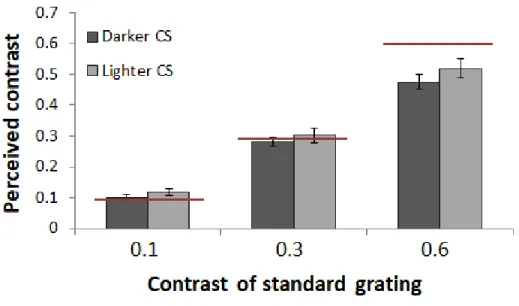
con-ducted using SBC stimulus. Participants were asked to adjust the contrast of a match grating to match that of the standard. Stan-dard was always placed on one of the CSs. The match was placed on a square, which was placed on a random-noise background. The arrow, and the text “adjustable grating” were not shown on the screen during the experiment. . . 37 4.3 Mean settings in the contrast adjustment experiment conducted
using SBC stimulus. Red horizontal lines shows the actual contrast under that condition. Error bars show ±1 SEM. . . 39 4.4 Protocol for the detection threshold experiment conducted using
simultaneous brightness contrast. At the beginning of each trial, either original or the mirror-symmetric version of the simultaneous brightness contrast stimulus was presented randomly. An arrow was used to inform participants about the side of the stimulus on which the grating would be presented. Gratings were superim-posed on only one of the CSs, either darker or lighter, throughout a session. In each trial, grating is presented at one of the intervals selected randomly. Participants are asked to decide in which in-terval the grating is presented. Participants are allowed to look at target CS directly. . . 41
LIST OF FIGURES xv
4.5 Results of contrast detection experiment using simultaneous brightness contrast stimulus. Mean detection thresholds for the contrast gratings superimposed on darker or lighter context square across different frequency levels are plotted. (A) Incremental grat-ing condition. (B) Decremental gratgrat-ing condition. Differently from the experiments conducted using illusory checkerboard stimulus, mean detection threshold for the gratings superimposed on darker was not significantly higher than that on the lighter CS. Error bars show ±1 SEM. . . 43 4.6 Mean proportion of correct responses averaged across participants
for 1 cpd spatial frequency condition as a function of stimulus contrast, and corresponding psychometric functions (PF). . . 45
5.1 Mean settings in the perceived contrast experiment in the scan-ner. Red horizontal line corresponds to the actual contrast. Con-sistent with previous adjustment experiments, perceived contrast increased with context-dependent lightness of the background for incremental gratings, but not for decremental gratings. * p < 0.01. Error bars show ±1 SEM. . . 49 5.2 Protocol for the fMRI study. In each experimental block, gratings
are flickering on the CSs. During the block, one of the gratings is frozen for 500 milliseconds randomly in each 2-4 seconds. . . 50 5.3 An example of flickering black and white checks stimuli used in
conventional retinotopy experiments. (LEFT) Rotating wedge. (RIGHT) Expanding or contracting rings. . . 52 5.4 Functional ROI stimulus. Flickering gratings were shown on a
trapezoid-shaped background whose luminance, size and locations were exactly the same as the context squares. Participants viewed the fixation mark and they were required to do fixation task by detecting the changes in its color. The only difference with the experimental stimulus was absence of the illusory checkerboard stimulus. . . 52
LIST OF FIGURES xvi
5.5 BOLD response time courses in seconds for incremental and decre-mental contrast stimuli from V1 among two different attention con-ditions. ”0” point corresponds to onset of experimental condition. In each condition, the BOLD activity corresponding to lighter CS is larger. Error bars show ±1 SEM. . . 55 5.6 Results of fMRI experiments. For each condition,
trial-onset-locked event-related averages in different visual areas within pre-defined functional ROIs were calculated for each of eight subjects. The average response between 8 and 12s before the stimulus on-set was subtracted from the average response from third to sixth volume (between 6 and 14s after the stimulus onset) of the ex-perimental block and plotted here as the averaged %BOLD signal change. * p < 0.05 (Lighter *: not significant after Bonferroni correction). Error bars show ±1 SEM. . . 56 5.7 Mean accuracy of participants on attention tasks they performed
during fMRI scanning. Participants performed well in both atten-tion tasks. Error bars show ±1 SEM. . . 57
6.1 Protocol for the discrimination threshold experiment. At the be-ginning of each trial, either original checkerboard stimulus or the mirror-symmetric version of it presented randomly. Gratings were superimposed on only the right CS, which might be either darker or lighter depending on the trial. A beep-sound was presented at the beginning of each interval in order to inform participants that the interval begins. In one of the two intervals randomly cho-sen, a standard grating with baseline contrast was presented and a test grating of slightly higher contrast than the standard grating was presented in the other interval. There was a fixation mark in the middle of two CS and participants were required to fixate on it throughout the session. Participants were asked to decide the temporal position of the test grating. . . 63
LIST OF FIGURES xvii
6.2 Discrimination Thresholds for the incremental and decremental gratings superimposed on either darker or lighter CSs. Here, mean of three repeats of each condition was reported. Discrimination threshold is higher when gratings are superimposed on darker CS. * p < 0.05. Error bars show ±1 SEM. . . 65 6.3 Mean proportion of correct responses averaged across participants
as a function of stimulus contrast, and corresponding psychometric functions (PF). . . 66 6.4 Example contrast response function (CRF). It forms a sigmoidally
shaped function that expanses at low contrast levels and com-presses at high contrasts where response saturates; and neural re-sponse increases relatively linearly at midrange contrast levels. . . 67 6.5 Example threshold versus contrast (TvC) curve. Behaviorally,
con-trast discrimination threshold is represented as a function of base-line contrast and it is called a TvC curve. At zero basebase-line contrast, the minimum contrast increment that can be detected is called de-tection threshold. As the baseline contrast increases above zero, discrimination threshold first drops below the detection threshold; and then it increases again. . . 68
LIST OF FIGURES xviii
6.6 Expected fMRI results based on the appearance and threshold re-sults. (A) In a case that BOLD activity in a cortical area is related to contrast appearance we would expect to see different patterns for incremental and decremental gratings. BOLD signal should be higher for the incremental gratings on lighter CS than that of su-perimposed on darker CS, and it should be similar for decremental gratings superimposed either on lighter CS or darker CS. (B) In a case that BOLD activity in a cortical area is related to thresholds, we would expect to see steeper slope of CRF for the grating super-imposed on the lighter CS both for incremental and decremental grating conditions. Thin lines show the relationship between stim-ulus contrast (on the x axis) and criterion amount increase (on the y axis). For instance, for the 20% baseline contrast, contrast of a grating superimposed on darker CS should be higher than that of superimposed on lighter CS in order to evoke the neural response increase by criterion amount. . . 69 6.7 Mean settings in the perceived contrast experiment in the scanner.
Red horizontal line corresponds to the actual contrast. * p < 0.05. Error bars represent ±1 SEM. . . 71 6.8 Mean BOLD signal change for 20% incremental and decremental
contrast in V1, V2, V3 and V4. BOLD signal amplitude is higher both for incremental and decremental gratings superimposed on lighter CS. * p < 0.05. Error bars represent ±1 SEM. . . 76 6.9 Mean BOLD response amplitude in V1, V2, V3, and V4 as a
func-tion of contrast and fitted CRFs to the actual data. BOLD re-sponse change tended to be larger for the gratings superimposed on the lighter CS for the most of the conditions we tested in all visual areas. Error bars represent ±1 SEM. . . 79
LIST OF FIGURES xix
6.10 Slope of the CRF curve between 0% and 1% contrast level in V1, V2, V3, and V4. CRF was fitted to the mean fMRI data averaged across participants. According to the recent models of contrast processing, slopes should be higher at the points that detection threshold is lower. Results are consistent with this expectation in all visual areas. Error bars represent ±1 SEM obtained by bootstrapping. . . 80 6.11 Slope of the CRF curve at 20% contrast level in V1, V2, V3, and
V4. CRF was fitted to the mean fMRI data averaged across par-ticipants. According to the recent models of contrast processing, BOLD activity slopes should be higher at the points that discrimi-nation threshold is lower. For the incremental gratings, the BOLD activity pattern in V2, V3 and V4 is in line with this expecta-tion. However, for the decremental gratings the activity pattern does not agree with the expectation. Error bars represent ±1 SEM obtained by bootstrapping. . . 81
LIST OF FIGURES xx
7.1 Schematic illustration of how contrast is computed in the brain based on the results of this study. There are feed-forward (also called bottom-up) and feedback pathways (also called top-down) between cortical areas in the brain. Information coming from the retina is usually transmitted to LGN and then primary visual cor-tex, V1, through feed-forward pathways. From V1, visual informa-tion is sent to the extra-striate cortex (V2,V3, and V4) and other higher level cortical areas. Feed-forward pathway is usually driven by sensory input. For instance, incremental and decremental con-trast information is first computed in the retina and transmitted to visual cortex through ON and OFF feed-forward retinal path-ways. ON pathway responds to both increment and decrement of low contrasts, whereas OFF pathway responds only to a decrement of relatively high contrast [81]. Also, ON pathway allow better in-tensity discrimination compared with the OFF pathway responses near threshold [87]. In addition to the feed-forward information processing of sensory input, extra-striate cortex and other higher level cortical areas send visual information which is usually driven by visual context and higher level cognitive mechanisms such as attention, and expectation to earlier visual areas through feedback pathway [88]. BOLD activity we observed in earlier visual areas in-cluding V1 correlates better with the perceptual context-dependent lightness effect than the sensory input. Therefore, contrast could be determined in earlier visual areas, after receiving feedback about context-dependent lightness. . . 87
A.1 Protocol for the detection threshold experiment. Gratings were superimposed on only one of the CSs, either darker or lighter, throughout a session. In each trial, grating is presented at one of the intervals selected randomly. Participants are asked to decide in which interval the grating is presented. Participants are allowed to look at target CS directly. . . 102
LIST OF FIGURES xxi
A.2 Results of contrast detection experiment. Mean detection thresh-olds for the incremental contrast gratings superimposed on darker or lighter CSs are plotted. Detection threshold is lower for the gratings superimposed on equiluminant but perceptually lighter CS. Error bars show ±1 SEM. . . 104
B.1 Discrimination Thresholds for the incremental and decremental gratings superimposed on either darker or lighter CSs. Discrimina-tion threshold is higher when gratings are superimposed on darker CS. Error bars show ±1 SEM. . . 109 B.2 Mean settings in the perceived contrast experiment in the scanner.
Red horizontal line corresponds to the actual contrast. * p < 0.05. Error bars show ±1 SEM. . . 113 B.3 Results of fMRI experiments. For each condition,
trial-onset-locked event-related averages in V1 within pre-defined functional ROIs were calculated for three subjects. Data at 3rd, 4th, and 5th TR points were averaged for comparison between conditions. *p < 0.05 Lighter * p < 0.1. Error bars show ±1 SEM. . . 114
Chapter 1
Introduction
1.1
Background
Visual information processing begins in the retina by detection of visible light [e.g., 1, 2, 3, 4]. Light reflected from the visual world is transduced into neural activity by photoreceptors, rods and cones, and transmitted to retinal ganglion cells in the retina [2, 3]. Because of the center-surround receptive field organiza-tion of the retinal ganglion cells, they respond antagonistically to a stimulaorganiza-tion in their center and surround region. For instance, for an ON-center OFF-surround neuron, increased luminance at the center increases its response, but increased lu-minance at the surround decreases it. Therefore, a visual neuron responds weakly to uniform illumination of whole receptive field and it responds strongly when the light intensities in the center and surround are quite different [1, 2, 3, 4]. Hence, the output of retina is not a faithful reproduction of light that reaches the eye from the external world. Instead, it is mostly the contrasts in light [1, 5, 6].1
The sensitivity of the retina to the contrast of an image rather than its absolute
1Vision scientists define contrast as a difference in light intensity between dark and light
regions of a visual stimulus; or a measure of differences in luminance between light and dark regions compared to the mean luminance in an image [e.g., 7, 8] and calculate the local contrast in an image using various formulas, such as those of Michelson or Weber contrast.
amount of light is not a defect of the visual system. On the contrary, this is what makes the visual system so robust and reliable. The absolute amount of light de-tected by retina is primarily determined by the intensity of light source such that increasing the ambient light intensity also increases the amount of light reflected by objects [1]. However, in order to identify a particular visual object as the same object under different viewing conditions, visual system should be able to give a fixed response, independent of light source, to the light reflected from that object. The absolute amount of light is relatively inadequate to succeed in object identification [1, 9, 10] because of its dependence on light source. On the other hand, contrast information is quite informative because it is mostly preserved despite the changing ambient light intensity. Thus, the center-surround receptive field organization provides an adaptive advantage by eliminating the uninforma-tive information and transmit the most meaningful information to higher levels in the processing [1]. By doing this, the visual system also ensures to preserve the small differences in light intensity. The visual information is slightly distorted in each relay step it is transmitted during the information processing. Therefore, if information about absolute amount of light is directly sent to higher levels, small differences in light intensities might be lost and not detected because of the distortion. In order to minimize this potential lost, the visual system computes contrast in the retina, at the very beginning of the information processing [1]. On the other hand, by now it is well established that the human visual system is not primarily concerned with estimating the physical and optical properties of images formed on the retina. Instead it seems to be more interested in estimating object and scene properties that are critical for the fitness of the organism [see e.g., 11, 12]. Therefore, despite the elaborate computation of contrast in the retina, photometric quantities of contrast computed in the retina do not always capture the relevant perceived qualities in the image [13], For instance, it is well known that perceived contrast of a simple isolated stimulus, such as a grating, is affected by its spatial frequency and background (or mean) luminance, the measure of the intensity of light reflected from a surface, even when its calculated photometric contrast remains the same [e.g., 7, 14, 15, 16, 17, 18].
Figure 1.1: Illusory checkerboard stimulus. “Context squares”, A and B have identical luminance but different lightness.
object and scene properties given a pair of inherently ambiguous retinal images is far from being completely understood, it is certain that it uses myriad of contextual cues that are present in a typical everyday scene. For example, in simple configurations luminance and lightness, defined as the perceived relative reflectance, covary. However, it is well known that lightness and luminance do not always covary, instead lightness depends on the context within which the surface is viewed. An example can be seen in Figure 1.1 that even though two surfaces marked as A and B (context squares, CSs) are equiluminant, because of their respective contexts, the visual system estimates (correctly) that their lightnesses are different [also see 19, 20, 21, 22, 2].
Considering the discrepancy between luminance and lightness as Figure 1.1 convincingly demonstrates, a new question arises: does perceived contrast of a grating vary with the luminance or lightness of its background? In other words, suppose that we superimpose grating patterns on CSs (see Figure 2.4), what happens to the perceived contrast of those gratings? If contrast perception varies only with luminance, we would not expect to see any differences in perceived contrast of gratings superimposed on the CSs. Such a result would indicate that unlike other visual features such as luminance [see e.g., 19, 10, 23] or size [see e.g., 24, 25, 26], contrast is largely preserved as it is computed in the retina. Alternatively, contrast might vary with lightness. Then, this would suggest that it is affected by visual context like many other visual features whose computation begins in the retina [see e.g., 19, 10, 23, 24, 25, 26]. The distinction is critical to fully understand the underlying mechanisms of contrast perception. Also, this would help us to understand the visual system better because contrast critically affects visual performance on many tasks such as object identification, speed judgment or motion detection [16]. Moreover, some other features of a visual stimulus such as shape, texture and size are determined via contrast within the object or between the object and background [2]. In addition to these, there is evidence that contrast and luminance are processed via different networks in brain [27, 28, 29, 16]. Therefore, it could also indicate at which level contrast, luminance and lightness operate and interact in the visual system.
Even though context-dependent lightness has been studied extensively [e.g., 30, 31, 32], its effect on perceived contrast was not studied directly and systematically previously. In a number of studies, related problems, particularly the effects of context-dependent lightness (and brightness) on luminance discrimination and detection thresholds were addressed [e.g., 33, 9, 34, 35, 31]. Maertens, Wichmann, and Shapley [36] investigated the effect of surrounding context on the lightness of elliptical regions using Adelson’s cylinder-and-checkerboard stimulus [37], and Shapley and Reid’s stimulus [38]. In both types of context the authors placed elliptical targets on perceived-dark and perceived-light squares which were in fact equiluminant. They found that lightness of ellipses were assimilated, for example the ellipse placed on perceived-lighter square was also perceived lighter. However
they did not asses perceived contrast between those ellipses and their background explicitly, in fact they offered models to explain their lightness results based on the photometric contrast values. Therefore, in a series of studies, we aimed to directly examine the effect of context-dependent lightness on contrast perception.
1.2
Scope and Motivation of the Present Study
In order to investigate the effect of context-dependent lightness on contrast per-ception, we conducted behavioral and fMRI experiments. First, we conducted behavioral experiments in order to investigate how context-dependent lightness affects contrast appearance judgments (i.e. perceived contrast or contrast iden-tification) and contrast detection and discrimination thresholds. In chapter 2, I introduce a study in which we investigate how perceived contrast of a grating is affected by the luminance and context-dependent lightness of its background [39]. We measured the perceived contrast of incremental and decremental rec-tified square-wave gratings superimposed on equiluminant but perceptually dif-ferent backgrounds. Our results demonstrated that context-dependent lightness affects the judgments for contrast. More specifically, perceived contrast of grat-ings superimposed on equiluminant but perceptually lighter backgrounds was higher compared to those superimposed on perceptually darker backgrounds. In this experiment, we examined the appearance of gratings and we published the results [39].
There is converging behavioral and neural evidence in literature that detec-tion and identificadetec-tion are processed at least by partly separate mechanisms in the brain [9, 40, 41]. For instance, Hillis and Brainard [9] previously indicated that although object detection and identification require the processing of luminance pattern in a stimulus, demands of the two tasks are different. Object detection requires to detect differences in luminance between a particular object and adja-cent objects whereas object identification requires to give a fixed response across changing viewing conditions. Considering these different demands, they claimed
appearance judgment tasks as we did in our previous experiment model the ob-ject identification whereas detection and discrimination threshold tasks model the object detection performance. They also showed behaviorally that detection, and identification of incremental elliptical patches in complex scenes similar to ours were mediated by different mechanisms. Besides, literature indicates significant differences between visual processing near threshold and above threshold [42]. Therefore, it is also crucial for us to understand how context-dependent light-ness affects detection and discrimination thresholds of contrast gratings. Here, detection threshold refers to the smallest amount of stimulus energy necessary to detect its presence whereas discrimination threshold can be defined as the small-est difference between two stimuli that a person can detect. With this motivation, in the present study we also aim to investigate the effect of context-dependent lightness on contrast thresholds. In Chapter 3 and Chapter 4, studies in which we investigate how context-dependent lightness affects contrast threshold perception are explained in detail. To examine whether context-dependent lightness has an effect on threshold-level contrast perception, we first conducted detection thresh-old experiments using our illusory checkerboard stimulus (see Chapter 3). The checkerboard we used in our studies has a strong illusory effect. Therefore, we also tested a weaker illusory lightness stimulus, i.e. the simultaneous brightness contrast (SBC, see an example in Figure 4.1) because we predicted that the effect will correlate with the strength of the illusory lightness effect (see Chapter 4). In these experiments we tested incremental and decremental contrast types, and different frequency levels.
In this study, we also aim to systematically investigate the neural correlates of the context-dependent lightness effect on perceived contrast and contrast thresh-olds using functional magnetic resonance imaging (fMRI) techniques in order to unveil the underlying neural mechanisms of the context-dependent lightness ef-fect. In Chapter 5 and Chapter 6, fMRI studies are explained in detail. First, an fMRI experiment is conducted in order to examine the effect of context-dependent lightness on associated cortical activity (see Chapter 5). In this study, an inter-esting relationship between the fMRI, contrast appearance and contrast threshold results was observed. In order to investigate this relationship systematically and
to link behavioral and neural data better, we conducted additional behavioral and fMRI experiments of contrast detection and discrimination (see Chapter 6). Re-sults of this study offer a neural evidence for dissociation between the mechanisms underlying detection and identification measures.
Chapter 2
Perceived Contrast in Context
This chapter is based on a publication by Z. Pamir and H. Boyaci, ”Context-dependent lightness affects perceived contrast,” Vision Research, vol. 124, pp. 24-33, 2016. Reproduced (or reproduced in part) with permission from Elsevier Publications (order number: 4161820641422).
Measurement of the lightness experiment in Section 2.2 is previously reported in a master’s thesis titled ”The effect of context luminance on contrast percep-tion” and submitted to the Graduate School of Informatics Institute of Middle East Technical University in August, 2014 by Zahide Pamir. The same data is also reported here in order to show that the illusory checkerboard stimulus used in the present experiments ensures the desired lightness effect. Data for the other experiments in this dissertation is collected especially for this Ph.D. study us-ing the optimal experimental design and parameters decided upon the results of experiments conducted for the above-mentioned master’s thesis.
2.1
Introduction
In this study, we investigated the effect of context-dependent lightness on per-ceived contrast using a stimulus inspired by Adelson’s checkerboard stimulus [37].
There were two equiluminant context squares (CSs) on the stimulus, lightnesses of which appeared considerably different (Figure 2.1). This stimulus allowed us to keep the luminance constant and test only the effect of context-dependent lightness.
We conducted two series of experiments in the study. Firstly, we as-sessed the lightness effect in the stimulus after applying several image ma-nipulations (see Figure 2.1). In the second experiment we measured the per-ceived contrast of rectified square-wave gratings superimposed on the CSs (see Figure 2.4). Using rectified gratings allowed us to study positive and nega-tive contrast patterns independently, which was critical because both behav-ioral and neural evidence in previous studies suggest fundamental differences between processing of incremental and decremental luminance patterns [e.g., 43, 44, 45, 46, 47, 48, 49, 50, 51, 52, 53]. Previous studies in literature have found interactions between spatial frequency and mean luminance in contrast perception using simple gratings [54, 14, 55, 15, 56]. More specifically, perceived contrast of high-frequency gratings were more strongly affected by the mean lu-minance [15]. Therefore, in our experiments we included spatial frequency as a further condition. Besides, additional control experiments were conducted to ad-dress possible confounds and the effect of actual changes in luminance. Detailed information about the experiments can be found in [39].
2.2
Measurement of the Lightness Effect
In this experiment, we quantified the lightness effect in the illusory checkerboard stimulus after several image manipulations in order to ensure that there is a significant lightness effect in our stimulus. The lightness effect is defined and quantified as the difference between the lightnesses of the CSs marked “A” and “B” in Figure 2.1. Also, the other purpose of this experiment was to find the impact of image manipulations on the strength of the lightness effect. This al-lowed us to identify the stimuli with strong lightness effects to use in subsequent contrast experiments.
Figure 2.1: Examples of the stimulus after image manipulations. “Context squares” (CSs), A and B in the first image and in the same position in all images, have identical luminance but different lightness.
2.2.1
Methods
2.2.1.1 Participants
Eight participants (three male) including the author ZP participated in the ex-periment. The mean age was approximately 23.4 ranging from 21 to 26. All participants reported normal or corrected-to-normal vision, and had no history of neurological or visual disorders. Participants gave their written informed consent and the experimental protocols were approved by the Human Ethics Committee of Bilkent University.
2.2.1.2 Stimuli and Design
The experimental software was prepared by us using the Java programming platform. The stimuli were presented on a CRT monitor (HP P1230, 22 inch, 1600×1200 resolution). Presentation of correct luminance values was ensured by using a gray scale look-up table prepared after direct measurements with a colorimeter (SpectroCAL, Cambridge Research Systems Ltd., UK). Participants were seated 75 cm from the monitor, and their heads were stabilized using a chin rest. Participants’ responses were collected via a standard computer keyboard.
Figure 2.2: Lightness experiment. Participants’ task was to adjust the luminance of an external patch to match the lightness of the context squares. The match-ing patch was placed on a random-noise background. Instructions about which context square is tested in that particular trial was given by the text strings “LEFT” and “RIGHT” on the random-noise background. The arrow and the text “adjustable patch” were not shown on the screen during the experiment.
or “stimulus” from here on, Figure 2.1) was generated using the open source rendering package Radiance [57]. The stimulus subtended 9.5 by 9.5 degrees of visual angle. Approximate size of the CSs was 0.85 by 0.85 degrees of visual angle. We prepared eleven different versions of the stimulus by manipulating the overall image contrast and luminance using the open-source software GIMP (http://www.gimp.org/). After these image manipulations, luminance of the context squares were 1.64, 2.74, 2.86, 4.34, 6.58, 10.1, 12.65, 16.11, 17.4, 20.41 and 26.15 cd/m2 (mean luminance of the stimulus: 1.83, 3.9, 5.13, 5.83, 6.98, 11.34, 13.18, 16.43, 16.74, 21.14, 23.37 cd/m2, respectively). Because of the
configuration of the stimulus the right CS was subjectively lighter than the left one (see Figure 2.1 for examples).
Participants’ task was to adjust the luminance of an external patch until its lightness matched that of the CSs. The matching patch was placed on a random-noise background, subtending 15 × 3 degrees of visual angle (Figure 2.2). Lumi-nance of each pixel on the random-noise background was drawn from a random distribution between 0 and maximum possible luminance of 100.32 cd/m2, and the resulting image was convolved with a 6-by-6 uniform filtering kernel. The size of the matching patch was approximately the same as that of the CSs. The initial luminance of the matching patch was determined randomly at the beginning of each trial. Adjustments could be done in large steps (approximately 2 cd/m2)
using the right and left arrow keys or in smaller steps (approximately 0.2 cd/m2)
using the up and down arrow keys. Instructions about which CS is tested in that particular trial was given by the text strings “left” and “right” on the random-noise background. Each variant of the stimulus was presented five times for each context square. This resulted in 110 trials completed in one experimental session (11 stimulus versions (CS luminance levels) × 2 CS positions × 5 repetitions). The order of trials was randomized.
2.2.1.3 Data Analysis
Data were analyzed using SPSS Version 19 (SPSS Inc., Chicago, IL). A repeated measures analysis of variance (ANOVA), was conducted in order to test two factors: CS luminance (11 levels), and CS position (two levels: left, right). Addi-tionally, the magnitude of the lightness effect, quantified as the difference between right and left CS settings, was tested with two-tailed paired-samples Student’s t-test for each level of CS luminance.
2.2.2
Results
Figure 2.3 shows the deviation of the raw settings from the actual CS lumi-nances. Analyses showed that main effect of CS position was statistically signif-icant (F(1,7) = 89.8, p < 0.001). Mean deviation from the actual luminance for
Figure 2.3: Results of the lightness experiment. Deviation of settings from actual luminance is plotted for each CS position as a function of context square lumi-nance. Positive (negative) deviation means setting was higher (lower) than the actual CS luminance. A value of “0” corresponds to perfect luminance match. Under all conditions, participants judged the right CS statistically significantly lighter, consistent with the subjective experience in Figure 1.1. Error bars show ±1 SEM.
the right CS (M = 6.68, SEM = 1.18) was higher than that for the left CS (M = -6,36, SEM = 0.37). Two-tailed paired-samples Student’s t-test results showed that settings for left CS and right CS were statistically significantly different at all luminance levels tested (among 11 conditions: minimum t(7)=6.37; maximum t(7)=13.3; mean t(7)=9.03; p < 0.001 for all conditions). These results clearly show that, even though the CSs were equiluminant the right CS was perceived lighter, which is consistent with the subjective experience in Figure 2.1. In ad-dition, we found a main effect of the context square luminance (F(10,70)=59.06, p < 0.001): as the luminance of context squares increased the lightness effect tended to increase.
2.2.3
Intermediate Summary and Discussion
In all conditions tested we found a significant effect of context on lightness, which slightly increased with CS luminance. Thus the lightness effect in our stimulus
was so robust that we could utilize it to test the effect of context-dependent lightness on contrast perception. Because there was not a big difference in the lightness effect across different CS luminance values, we used four versions of the context stimulus in the following contrast experiments: one with a high, one with a medium, and two with low CS luminances. We included two low CS luminances because results of Peli and his colleagues [7] suggest that the effect of mean luminance on perceived contrast is stronger for lower luminances.
2.3
Measurement of Perceived Contrast
In this experiment, we investigated the relationship between context-dependent lightness and perceived contrast. For this purpose, we used rectified gratings su-perimposed on CSs with positive contrast (incremental grating, i.e., luminance of grating’s bars is higher than the background), and negative contrast (decremental grating, i.e., luminance of grating’s bars is lower than the background) (see Fig-ure 2.4). We tested four versions of the illusory checkerboard stimulus that led to strong lightness effects based on the results of the first experiment. We compared the perceived contrast of photometrically identical incremental and decremental gratings superimposed on equiluminant but perceptually different CSs (Figure 2.4).
2.3.1
Methods
2.3.1.1 Participants
Incremental grating condition. Two males and four females participated in the experiment under the incremental grating condition. Two of them were among the participants of the lightness experiment and they also participated in the experiment under the decremental grating condition. The mean age was 24.6 ranging from 22 to 29.
Figure 2.4: Task and procedure in the contrast experiment. Participants were asked to adjust the contrast of a “match” grating to match that of the “standard”. Standard was always placed on one of the CSs. The match was placed on a square, which was placed on a random-noise background. The arrow, and the text “adjustable grating” were not shown on the screen during the experiment. (A) Incremental grating condition, (B) decremental grating condition.
Decremental grating condition. Two males and four females participated in the experiment under the decremental grating condition. Two of them were among the participants of the lightness experiment and they also participated in the experiment under the incremental grating condition. The mean age was 25.3 ranging from 23 to 28.
All participants reported normal or corrected-to-normal vision, and had no his-tory of neurological or visual disorders. Participants gave their written informed consent and the experimental procedures and protocols were approved by the Human Ethics Committee of Bilkent University.
2.3.1.2 Stimuli and Design
The contextual stimulus and the physical components of the experimental setup were the same as in the lightness experiment, except a bigger version of the context stimulus was used (13.4 by 13.4 degrees visual angle).
We estimated the perceived contrast of incremental and decremental rectified square-wave gratings superimposed on the CSs (Figure 2.4). Our aim was to compare the perceived contrast of photometrically identical gratings superim-posed on equiluminant but perceptually different CSs. Participants’ task was to perceptually adjust the contrast of a “match” grating to match that of the “stan-dard” grating. The standard was always placed on one of the CSs. The match grating was placed on a square that had the same luminance and approximately the same dimensions as the CS, which in turn was placed on an external random-noise background (Figure 2.4). Contrast of the gratings was defined by Weber Contrast, C = (Lgr− LCS)/LCS, where Lgr and LCS correspond to grating and
CS luminance respectively [58]. The positive contrasts tested were 0.1, 0.3 and 0.6, and the negative contrasts were -0.1, -0.3 and -0.6. Adjustment was done in ∆C = 0.1 steps by the use of left and right arrow keys and fine tuned adjust-ment was done in ∆C = 0.01 steps using the up and down arrow keys. Four versions of the context stimulus were used, in which CS luminances (background luminance) were 1.64, 2.86, 10.1, and 17.4 cd/m2. Stimuli were presented in a
random order on a black background. Gratings with frequencies of 2.5, 5, and 10 cycles/degree (cpd) were tested, blocked in different sessions. Match always had the same frequency as the standard. In each trial the contrast of the stan-dard was pseudo-randomly chosen among the contrast levels tested and balanced across the session. Match had the same contrast polarity as the standard and its initial contrast was determined randomly at the start of each trial. During the trial the background luminance of the match remained constant and equal to that of the CSs. Thus, when the participants adjusted the contrast of the match grat-ing the mean luminance of match background-plus-gratgrat-ing slightly varied. This may have a very small or negligible effect, which should not change the main conclusions because we always compare the settings for physically identical CSs. Each session contained 120 trials with 5 repetitions for every combination of con-ditions (4 stimulus versions (CS luminance) × 3 contrast levels × 2 CS positions × 5 repetitions). Different frequency levels are tested in separate sessions.
2.3.1.3 Data Analysis
The analyses were performed on an “effect score” defined by
ρC =
CR− CL
CR+ CL
, (2.1)
where CRand CLstand for the participant’s setting for the grating superimposed
on the right and left CS respectively. An effect score of zero would mean no difference in perceived contrast between the gratings. For decremental contrasts, before computing ρC we first converted the contrast settings to positive values
(therefore a positive ρC means perceived contrast on the right CS is more
neg-ative in the case of decremental gratings). In order to test whether the effect score is different than “0” we conducted one-sample two-tailed Student’s t-test in SPSS. Effect scores obtained under different contrast types were compared using a two-tailed independent-samples t-test in SPSS. Further analyses were conducted using a repeated measures ANOVA with three factors (luminance, frequency, and contrast) and Bonferroni corrected pairwise comparisons in SPSS.
2.3.2
Results
Results are plotted in Figure 2.5 in the form of effect score. In the incremental grating condition, mean effect score was positive (ρC = 0.14 SEM = 0.02), and statistically significantly different than zero (t(5) = 8.03, p < 0.01). In other words, perceived contrast was higher when the grating was located on the per-ceptually lighter right CS. In the decremental grating condition mean effect score was negative (ρC = -0.01, SEM = 0.02). However, it was not statistically signif-icantly different than zero (t(5) = -0.52, p > 0.05). In other words, there was no difference between perceived contrast of decremental gratings superimposed on the left and right CS. Effect scores for incremental and decremental gratings were statistically significantly different (t(10) = 5.48, p < 0.01). There was no significant main effect of frequency on the results in either condition (incremental grating: F(2,10) = 0.1, p > 0.05; decremental grating: F(2,10) = 1.02, p > 0.05). Therefore, Figure 2.5 shows the effect scores averaged across frequencies.
Figure 2.5: Mean effect scores, ¯ρC, from the contrast experiment. Brightness of
the bars indicate different contrast levels. Because frequency did not have a main effect, effect scores are averaged over three frequency levels. An effect score of “0” means that there is no difference between perceived contrasts of the gratings superimposed on the right and left CSs. A positive (negative) value means that the absolute value of the perceived contrast of the grating on the lighter CS was greater (less) than that on the darker one. (A) Incremental grating condition. (B) Decremental grating condition. Error bars show ±1 SEM.
CS luminance affected ρC in both conditions (incremental grating: (F(3,15)
= 10,6, p < 0.05; decremental grating: F(3,15) = 6.72, p < 0.05). We did not find an effect of standard contrast in the incremental grating condition (F(2,10) = 2,85, p > 0.05). However, standard contrast affected ρC in the decremental
grating condition (F(2,10) = 12.21, p < 0.05).
2.3.3
Intermediate Summary and Discussion
Results of this experiment showed that context-dependent lightness affects per-ceived contrast of an incremental grating: the same grating appears to have higher contrast when it is superimposed on an equiluminant but perceptually lighter background. This result is in line with previous findings, which demon-strated that perceived contrast is higher for gratings with higher mean luminance even when their photometric contrast remains constant [7, 15]. However, interest-ingly we found no effect of context-dependent lightness for decremental gratings and there was no main effect of spatial frequency.
2.4
Effect of Background Luminance
Differ-ences on Perceived Contrast
We conducted an additional experiment in order to directly compare the effects of luminance and context-dependent lightness. In this experiment we measured the perceived contrast of gratings superimposed on a pair of gray-scale patches without the three-dimensional context (see Figure 2.6). Luminances of the iso-lated patches were different and they were determined based on the group average results of the lightness experiment to approximate the perceptual difference be-tween the CSs. Results are also compared to the findings of [7], where mean or background luminance was shown to have an effect on perceived contrast.
2.4.1
Methods
2.4.1.1 Participants
The same participants (four female, two male) who took part in decremental grating condition in the previous experiment participated in this experiment.
2.4.1.2 Stimuli and Design
In this experiment we measured the perceived contrast of gratings superimposed on a pair of gray-scale patches without the three-dimensional context. Two patches were located at the same spatial positions and dimensions as the CSs in Experiment 2.3. Luminances of the isolated patches were different and they were determined based on the group average results of the lightness experiment (Ex-periment 2.2) to approximate the perceptual difference between the CSs. More specifically the left patch had a lower and the right patch had a higher luminance. Four pairs of luminances were used, corresponding to the CS luminances of 1.64, 2.86, 10.1, or 17.4 cd/m2 (note that this is the same set of luminance values
used in Experiment 2.3). For example, for the CS luminance of 1.64 cd/m2, we
used 1.92 cd/m2 for the left and 7.3 cd/m2 for the right patch, as these were the
average settings obtained in the lightness experiment for the left and right CSs respectively. Other luminance pairs were as follows: 1.33, and 10.39 cd/m2; 3.46, and 21.75 cd/m2; 5.98, and 25.33 cd/m2. A match grating was superimposed on a
patch with a luminance that corresponded to the tested patches in that trial (1.64, 2.86, 10.1, or 17.4 cd/m2), which in turn was placed on an external random-noise
background. Participants’ task was to adjust the contrast of the match grating to match that of the standard grating. The standard grating was pseudo-randomly superimposed on one of the two patches, and its contrast could be 0.1, 0.3, or 0.6 in the incremental grating condition, and -0.1, -0.3, or -0.6 in the decremental grating condition. The initial contrast of the match was determined randomly at the start of each trial. Both match and standard gratings had a spatial frequency of 2.5 cpd. There were 120 trials (4 luminance pairs × 3 contrast levels × 2 patch
positions × 5 repetitions) in each session. Participants completed two sessions, one for incremental gratings and one for decremental gratings.
2.4.1.3 Data Analysis
Raw data were converted to effect scores as defined before (see Equation 2.1). For the decremental gratings, before computing ρC we first converted the contrast
settings to positive values (therefore in case of decremental gratings a positive score means that perceived contrast on the right (higher luminance) patch is more negative). All further analyses were performed on the effect scores. A two-tailed one-sample t-test was conducted to test whether the effect score is different than zero. In order to determine the effect of other factors (luminance pair and contrast), a repeated measures ANOVA was applied. Incremental and decremental grating conditions were compared using two-tailed paired-samples t-tests. Finally, two-tailed independent-samples t-tests (for incremental gratings) and two-tailed paired-samples t-tests (for decremental gratings) were employed to compare the effect scores with those in Experiment 2.3.
2.4.2
Results
Results are shown in Figure 2.6. Under the incremental grating condition the mean effect score was positive (ρC = 0.2, SEM = 0.03) and statistically signif-icantly different than zero (t(5) = 6.08, p < 0.01), which means perceived con-trast was higher when the grating is placed on a higher luminance background. However, under the decremental grating condition the mean effect score was not statistically significantly different than zero (ρC = 0.05, SEM = 0.02; t(5) = 1.93, p > 0.05). The difference between the effect scores for incremental and decremental gratings was statistically significant (t(5)=3.07, p < 0.05).
Next we compared the results with those from Experiment 2.3. For incre-mental gratings there was not a significant difference between the effect scores (t(10)=1.23, p > 0.05). Overall, effect scores tended to be larger for isolated
Figure 2.6: Perceived contrast of gratings on isolated backgrounds. Experimental design and results. Participants adjusted the contrast of the match grating to match that of the standard on isolated patches. The geometry and position of the patches were identical to those of the CSs in the contextual stimulus. However this time the patches actually differed in luminance. (A) Incremental gratings. (B) Decremental gratings. The two bar plots on the right show the results presented in the same format as in Figure 2.5. The pattern of results was similar to the one found in Experiment 2.3. Error bars show ±1 SEM.
patches with different luminance (2.5 cpd condition on CSs: ρC = 0.15, SEM = 0.03; on isolated patches: ρC = 0.2, SEM = 0.03). For the decremental gratings the difference was statistically significant (t(5)=2.73, p < 0.05; 2.5 cpd condition on CSs: ρC = -0.02, SEM = 0.03; on isolated patches: ρC = 0.05, SEM=0.02).
2.4.3
Intermediate Summary and Discussion
Results show that background luminance affects perceived contrast of incremental gratings, which is in line with previous literature [e.g., 7]. However, there was no effect of luminance on the perceived contrast of decremental gratings. The pattern of results is consistent with Experiment 2.3, although in general the effect of luminance tends to be larger than that of context-dependent lightness.
2.5
Measurement of Lightness of the Gratings
In Experiment 2.3, where gratings were superimposed on CSs, participants could have used a strategy where they match the lightness of gratings to perform the task, instead of matching their contrast. In order to rule out this possibility and to ensure that participants indeed performed the given contrast task we conducted a control experiment. Here we asked the participants to estimate the lightness of incremental gratings superimposed on CSs in the contextual stimulus. We then used these estimates to calculate “derived contrast” and “derived effect score” as described below. Finally we compared the derived scores to those obtained in Experiment 2.3.
2.5.1
Methods
2.5.1.1 Participants
The same six participants who participated in Experiment 2.3 incremental grating condition completed this experiment.
2.5.1.2 Stimuli and Design
A standard grating with one of 0.1, 0.3, or 0.6 Weber contrast was superimposed on one of the CSs in a pseudo-random order. Participants’ task was to adjust the luminance of an external circular matching patch to match the gratings in lightness (i.e. the vertical “bars”). The match was placed on a square that had the same luminance as the CS and approximately the same dimensions, which in turn was placed on an external random-noise background (Figure 2.7).
2.5.1.3 Data Analysis
Results from this experiment were converted first to “derived contrast” by placing participants’ estimate, ˆLgr, in the contrast equation, C = (Lgr− LCS)/LCS. Next
“derived effect scores” were computed using Equation 2.1, based on the derived contrast values, and compared with the results from Experiment 2 using two-tailed paired-samples Student’s t-test.
2.5.2
Results
Results are shown in Figure 2.7. We found that derived effect scores of this exper-iment and those obtained in Experexper-iment 2.3 were statistically significantly, and extremely different (overall difference: t(5) = 23.37, p < 0.001). For instance, for the CS with a luminance of 2.86 cd/m2 and grating with a contrast of 0.3, the
Figure 2.7: Lightness of the gratings. In this experiment participants matched the lightness of the gratings using an external circular match placed on a patch and random noise background. “Derived contrast” and “derived effect score” were computed using those estimates. Derived effect scores and the effect scores from Experiment 2 are shown in the right panel. Clearly, participants performed the two tasks differently. Error bars show ±1 SEM.
effect score was 0.25 in Experiment 2.3, whereas here the derived effect score was 0.97 (Figure 2.7). These results show that if participants were simply matching the lightness of gratings without considering contrast at all, we would obtain ex-tremely different results for the contrast matching experiments. Thus, the results provide a strong evidence that participants matched the contrasts of gratings, not their lightnesses in the contrast experiments.
2.6
Summary and Discussion
Results of this study showed that perceived contrast is not determined solely by the localized features of the retinal image. Context-dependent lightness, as well as actual luminance, of the background influence the perceived contrast of rectified gratings. Our results are consistent with previous studies which showed that perceived contrast of visual patterns in simple scenes, such as Gabor patches on a uniform background vary with their mean or background luminance [e.g.,
7, 59, 15]. Additionally, in our study, we showed that this effect is not limited to the background luminance but extends to context-dependent lightness. Moreover, in our study we showed that even when there is no physical difference between the patterns there is still an effect of background lightness on perceived contrast. Comparing physically identical patterns circumvents nonlinearities and confounds that might in principle be introduced by physical changes.