Full Terms & Conditions of access and use can be found at
https://www.tandfonline.com/action/journalInformation?journalCode=raec20
ISSN: (Print) (Online) Journal homepage: https://www.tandfonline.com/loi/raec20
FINANCIAL RESILIENCE TO THE COVID-19
PANDEMIC: THE ROLE OF BANKING MARKET
STRUCTURE
Gamze Ozturk Danisman, Ender Demir & Adam Zaremba
To cite this article: Gamze Ozturk Danisman, Ender Demir & Adam Zaremba (2021): FINANCIAL RESILIENCE TO THE COVID-19 PANDEMIC: THE ROLE OF BANKING MARKET STRUCTURE, Applied Economics, DOI: 10.1080/00036846.2021.1904118
To link to this article: https://doi.org/10.1080/00036846.2021.1904118
Published online: 29 Mar 2021.
Submit your article to this journal
Article views: 168
View related articles
FINANCIAL RESILIENCE TO THE COVID-19 PANDEMIC: THE ROLE OF BANKING
MARKET STRUCTURE
Gamze Ozturk Danisman a, Ender Demir b and Adam Zaremba c
aFaculty of Economics, Administrative and Social Sciences, Kadir Has University, Istanbul, Turkey; bFaculty of Tourism, Istanbul Medeniyet University, Istanbul, Turkey; cMontpellier Business School, Montpellier France; Montpelier Research in Management, University of Montpellier, Montpellier, France; Department of Investment and Financial Markets, Institute of Finance, Poznan University of Economics and Business, Poland
ABSTRACT
This article examines whether differences in banking market structures across countries influence the local stock market resilience to the COVID-19 pandemic. Using a sample of 66 countries for the period January 2020 to July 2020, our findings demonstrate that countries with more concentrated banking systems, with a higher presence of foreign banks, and a higher share of Islamic banks are more resilient to the pandemic. Considering the banking regulatory differences between countries, we observe that equity markets of countries with stricter regulatory requirements on capital and liquidity are more resilient to the COVID-19. Finally, regarding banking sector performance indi-cators, our findings show that while stock reactions of countries with more stable banking systems are more resilient to the pandemic; countries with more credit to deposit ratio, overhead costs, high provisions and nonperforming loans are more vulnerable. Our findings provide important implications for policymakers, regulatory bodies and investors.
KEYWORDS
COVID-19; resilience; stock return; banking structure; bank regulations; bank performance
JEL CLASSIFICATION G21; E44; G11; G30
I. Introduction
The COVID-19 pandemic has started in December 2019 and has spread all over the world in a very short period. It has not only affected the global financial markets and economies but also has generated severe impacts on all humanity. The government has implemented curfews, border closures, domestic and international travel bans, and enforcement of mask-wearing along with sev-eral other strict limitations to flatten the curve. The asymptomatic transmission of COVID-19 has made it harder to control the global spread of the virus and has caused risks of collapses in the health systems of many countries. The global effort to halt the spread of COVID-19 has almost stalled the economies; leading to an unprecedented economic and financial downturn (Zaremba et al. 2021). The world has not witnessed such a global downturn in this capacity since the 2008 Global Financial Crisis (IMF 2020).
In the first quarter of 2020, COVID-19 caused a collapse in the global stock markets by around 20% (Zaremba et al. 2021). Mazur, Dang, and Vega
(2021) show that, due to COVID-19, the US stock market experienced a crash in March 2020, and according to Baker et al. (2020), no infectious dis-ease outbreak in history has caused such a major stock market volatility in the US. Zaremba et al. (2020) show that the stringency of policy responses to COVID-19 has further increased the stock mar-ket volatility in 67 countries worldwide. The study of Zhang, Hu, and Ji (2020) shows that global financial market risks have increased significantly with the responses to the pandemic. Topcu and Gulal (2020) have documented the negative impact of the pandemic on the emerging stock markets; however, the impact has gradually fallen. Nevertheless, the negative impacts of COVID-19 on equity markets are not evenly distributed across the globe. While some emerging markets such as Argentina, Brazil, and South Africa have experi-enced significant losses of 40% or more, other countries such as Denmark, Switzerland, and China have, comparably, performed much better with losses not exceeding 10% (Zaremba et al. 2021). In this regard, our aim in this article is to
CONTACT Dr Gamze Ozturk Danisman [email protected] Faculty of Economics, Administrative and Social Sciences, Kadir Has University, Istanbul, Turkey
https://doi.org/10.1080/00036846.2021.1904118
examine whether the differences in banking market structures across countries can provide stock mar-ket resilience to the COVID-19 pandemic.
A strand of the fast-growing COVID-19 litera-ture already examines several factors that can shape the stock market and corporate resilience. The first
studies (Kanno 2020; Haroon and Rizvi 2020; Al-
Awadhi et al. 2020; Mazur, Dang, and Vega 2021)
of the field mostly focus on the role of the industry- group and type of operating activity. The next and more comprehensive group of studies explore the role of firm and country-level variables, potentially mitigating the negative impacts of the pandemic. Financial characteristics such as financial
flexibil-ity, tangibilflexibil-ity, size (Heyden and Heyden 2020;
Fahlenbrach, Rageth, and Stulz 2020; Ding et al.
2020), corporate culture (Li et al. 2020a),
environ-mental and social activities (Demers et al. 2020;
Albuquerque et al. 2020), the resilience of
opera-tions to social distancing (Pagano, Wagner, and
Zechner, 2020; Laeven 2020), and exposure to
international markets (Onali and Mascia 2020;
Ramelli, and Wagner, 2020; Lopatta et al. 2020)
are considered among the mitigating factors of the negative impacts of the COVID-19 shock.
While the literature so far has considered the potential roles of the aforementioned variables in terms of providing financial resilience to COVID- 19, the examinations so far mainly considered the non-banking sector, largely ignoring the bank- specific features. To the best of our knowledge, no study has investigated yet how the differences between the structure of banking markets across the countries would influence the stock market reac-tion to the pandemic. Which banking market struc-ture variables can explain why some stock markets can cope better with the pandemic than others?
The lockdowns, gathering limitations and bor-der closures disrupt firms’ operations, leading to decreases or cuts in sales. This creates liquidity problems, and firms are likely to face difficulties in their repayment of debt. Facing such problems, firms go to their banks first and demand credit. Due to the COVID-19 pandemic, the three weeks in March 2020 have been an extraordinary stress test on the US banks’ ability to supply liquidity to nonfinancial businesses. The lending grew more
than 6% per week, which exceeded every other weekly growth rate in history since 1973 (Li,
Strahan, and Zhang 2020b). De Vito and Gomez
(2020) find that firms would exhaust their cash holdings in two years in the high-risk scenario, which, in turn, induces more firms to rely more on banks for liquidity (Li, Strahan, and Zhang 2020b). Although banks are better capitalized com-pared to the Global Financial Crisis of 2008, there is still heterogeneity in banking structures across countries (Anginer et al. 2019). For instance, while the five-bank asset concentration is 46% in the US,
it is 67% in the UK as of 2016.1 The bank regulatory
capital to risk-weighted assets also has a wide range, going from a low of 12% in Russia to a high of 29% in Estonia as of 2016. Due to COVID-19, the rising use of drawdowns of credit lines and provision for possible credit losses will certainly deteriorate the level of bank capital which might jeopardize their meeting of the regulatory minimum capital requirement (Acharya and
Steffen 2020). Therefore, a robust pre-COVID-19
banking structure is important to keep banks main-taining their intermediation role in the economy.
In this study, we aim to fill this gap in the literature by examining the effect of different pre- pandemic (pre-2020) banking sector structures around the world on the resilience of stock market price reactions to COVID-19. Our data set consists of 66 countries for the period from 2 January 2020 through 20 July 2020. We use countries’ daily stock market returns as the dependent variable in our regressions, and stock prices are obtained from Datastream Global Equity Indices. To account for countries’ exposure to the COVID-19 pandemic, we use the daily growth rate of the cumulative number of confirmed cases in a country. We use panel data estimation techniques with country and time (day) fixed effects to adequately control for both cross-sectional and time-series variation and minimize any possible estimation issues, such as multicollinearity and heteroscedasticity (Baltagi 2008). We consider the differences between the three main categories of the structure of banking markets in this article: banking sector characteris-tics, banking market regulations, and banking mar-ket performance indicators.
1
Our findings indicate that stock markets have reacted negatively to COVID-19 even after control-ling key asset pricing factors and country controls. Regarding the differences in banking sector char-acteristics, we observe that countries with more concentrated banking systems, a higher presence of foreign banks, and a higher share of Islamic banks are more resilient to the pandemic. Regarding the regulatory differences, we find that stricter pre-pandemic regulatory requirements on capital and liquidity provide shelter to the COVID- 19 pandemic. Finally, concerning the differences in bank performance variables, our findings indicate that while stock returns of countries with more stable banking systems are more resilient to the pandemic; countries with more credit to deposit ratio, overhead costs, high provisions and nonper-forming loans are more vulnerable.
The rest of the article is organized as follows: Section 2 provides a brief literature review, Section 3 presents the data and methodology of the article, and Section 4 provides the findings and discus-sions. Finally, Section 5 concludes the study.
II. Related Literature
A strand of the fast-growing COVID-19 literature examines the factors that can shape the stock mar-ket and corporate resilience to the coronavirus
crisis. The first studies (Kanno 2020; Haroon and
Rizvi 2020; Al-Awadhi et al. 2020; Mazur, Dang,
and Vega 2021) of the field mostly emphasize the
role of the industry in terms of the severe impacts of COVID-19. Specifically, it is shown that there is a heterogeneous impact of the pandemic among industries. For example, Al-Awadhi et al. (2020) found that while sectors such as beverages and transportation (air, water and highway) have per-formed significantly worse than the market, infor-mation technology and medicine manufacturing sectors have performed better in China during the COVID-19 pandemic. According to Mazur, Dang, and Vega (2021), the US stock market returns of companies operating in the petroleum, real estate, entertainment, and hospitality sectors decrease sig-nificantly during the crash of March 2020 triggered by COVID-19.
The next and more comprehensive group of studies explore the potential role of firm and
country-level variables that can mitigate the nega-tive impacts of the pandemic. What firm and coun-try-level indicators can bring resilience to firms and stock markets? Fahlenbrach, Rageth, and Stulz (2020) observe that firms with greater financial flexibility are less affected by the COVID-19 pan-demic because they can easily fund the decline in sales from their liquid assets. Pagano, Wagner, and Zechner (2020) () observe that the risk-adjusted returns of firms whose operations are more resili-ent to social distancing tend to be less affected even after calculating the risk factors. Laeven (2020) also confirms that sensitivity to social distancing deter-mines the level of impact of COVID-19 on firms. Heyden and Heyden (2020) investigate how stock market reactions to COVID-19 are affected by firm-specific characteristics, and they document that firms with higher tangible assets, larger size, and greater liquidity appear to be less affected by the outbreak of COVID-19. Using the data of over 6,000 firms from 56 countries, Ding et al. (2020) found that the negative impact of the pandemic is milder for firms with more cash, less debt, and higher profits. By analysing the conference calls, Li et al. (2020a) document that firms with a strong culture perform better due to those firms being more likely to emphasize community engagement and adopt digital technology and less likely to implement cost-cutting. Nehrebecka (2021) shows that higher profitability, less debt, and higher liquidity are linked to a reduced prob-ability of default in Polish companies in the pan-demic period.
Another group of researchers explore whether the environmental scores of firms can affect the stock price reaction to the pandemic. Takahashi and Yamada (2020) show that ESG (environmen-tal, social, and governance) activities do not have any significant effect on the abnormal return of Japanese companies. Demers et al. (2020) also show that ESG scores do not provide any positive explanatory power for returns in the first quarter of 2020. On the contrary, Albuquerque et al. (2020) show that Environmental and Social (ES) activities can provide immunity to US companies. Similarly, Garel and Petit-Romec (2020) provide supportive evidence on the positive role of environmental issues for the firm’s performance during the pandemic.
The role of international markets exposure on the COVID-19-induced stock market reaction is also considered in the literature. Onali and Mascia (2020) document that while international diversification attenuates the negative effect of COVID-19 on the idiosyncratic volatility and total risk, business diversification deepens the impact of COVID-19. Ramelli, and Wagner, (2020) explore the role of international trade on the US stock market reactions to the COVID-19, and they observe that initially, the internationally oriented US firms, especially those more exposed to China, have underperformed. However, as the pan-demic spreads to Europe and the US, firms with higher debt levels and less cash are more affected by the pandemic. Takahashi and Yamada (2020) find that companies with exposure to China and then Europe are negatively affected by COVID-19. Ding et al. (2020) measure the international exposure of firms across 56 economies, and they show that stock prices of firms with higher international exposure along with more exposure to COVID-19 through global supply chains and customer loca-tions are more severely affected. By using hand- collected data from annual reports of firms from ten countries, Lopatta et al. (2020) found that while early detection of the COVID-19 pandemic in the reports can lower their stock risk, the risk rises for companies that do not address the pandemic in their reporting process. Zaremba et al. (2021) investigate the determinants of stock market immunity to the COVID-19 pandemic by consid-ering five main categories namely financial, eco-nomic, healthcare, governance, cultural and law factors in 67 countries. They found that low unem-ployment, conservative investments, and limited valuations can enhance resilience to the pandemic.
In comparison with the abundant studies focus-ing on the non-bankfocus-ing sector, the examinations of banks are rather limited and focus mainly on the overall impact of the COVID-19 disease (e.g.
Aldasoro et al. 2020; Demirguc-Kunt, Pedraza,
and Ruiz-Ortega 2020; Barua and Barua 2020).
On the other hand, the features influencing resili-ence to the pandemic are primarily unchartered territory. The sole exceptions include Demir and Danisman (2020b), who investigate the role of government policy responses, and Mirzaei, Saad, and Emrouznejad (2020), who scrutinize the
specific nature of Islamic banks. Also, Korzeb and Niedziółka (2020) research the importance of financial standing, but within a limited sample of a handful of banks from a single emerging market. Notably, the examinations of the banking sector’s role on the overall resilience to the pandemic are still missing. Our article hopes to fill this gap at least partially.
The differences in the banking sector character-istics of the countries are expected to impact the resilience to crises like the COVID-19 in several different ways. First, Beck, Demirgüç-Kunt, and Levine (2006) found that countries with more con-centrated banking systems are less prone to crises because bank market power is enhanced, and higher profits are generated in more concentrated banking systems. This constitutes a buffer against adverse shocks and increases the franchise value of the banks, decreasing the likelihood of excessive risk-taking during uncertain times (Agoraki et al.
2011; Beck, De Jonghe, and Schepens 2013a;
Danisman and Demirel 2019). Second, countries
with a higher share of foreign banks are generally argued to have better performance during crisis times because foreign banks have better access to credit from their parent banks (De Haas and Van
Lelyveld 2004; Allen et al. 2017). This helps to
balance the decreased level of credit in the local markets and decreases the cost of credit. Third, countries with higher Islamic banks presence are observed to be more resilient during uncertain times mainly because of the risk-sharing mechan-ism between creditors and borrowers, and asset- based financing mechanism of Islamic banks can
provide resilience (Hasan and Dridi 2011; Beck,
Demirgüç-Kunt, and Merrouche 2013b; Bilgin
et al. 2021).
The differences in the banking sector regula-tions are also expected to impact the resilience of the countries’ stock performance in crisis times. After the 2008 global financial crisis, stricter capital and liquidity regulations are in place with the Basel III reforms. To alleviate the negative impacts of the COVID-19 on the finan-cial system stability, various bank prudential regulatory measures were in place across the world, such as softening the treatment of non-performing loans and easing capital buffers
expected that countries with higher pre- pandemic capital and liquidity buffers have more room for easing these buffers and are expected to have a better performance.
The variations between country-level banking sector performance indicators are expected to have a further influence on the country’s stock performance. This is in line with the notion that a pandemic-led decrease in stock markets is less observed for banks and firms with a healthier pre-
COVID-19 financial situation (Ding et al. 2020;
Demir and Danisman 2020b). Stronger pre-
pandemic country-level banking system balance sheet conditions imply conditions such as higher banking stability in terms of less insolvency risk, lower nonperforming loans, a lower share of loan loss provisions; higher credits levels, and higher efficiency in terms of lower overhead costs. Better financial conditions of banking systems are likely to provide shelter and bring more resilience during
crisis times (Beltratti and Stulz 2012; Berger and
Bouwman 2013).
III. Data and Methodology
In this section, we present the sample, data sources, variables, and methodology.
Sample construction
To investigate empirically how pre-pandemic banking structures influence countries’ stock price reactions, we construct our sample as follows. We first consider the countries that have available data on the number of confirmed COVID-19 cases and deaths in the Oxford COVID-19 Government Response Tracker (Ox-CGRT) database (Hale
et al. 2020). The database has available data for
180 countries that are affected by the pandemic.
We then collect the daily prices for the Datastream Global Equity Indices from 2 January 2020 through 20 July 2020 from the DataStream. We extract the pre-2020 banking structure and regulatory indica-tors and other country characteristics from the World Bank using the year with the latest available
data23 We drop the countries where the data for
Datastream Global Equity Indices and banking structures and regulatory indicators are not avail-able, which leaves us with 66 countries.
Empirical Methodology
Following Ding et al. (2020) and Albuquerque et al. (2020), we develop our empirical model to consider whether pre-pandemic (pre-2020) banking structures around the world influence the stock market price reaction to the COVID- 19 pandemic:
Rjt¼β0þβ1COVID19j;tþβ2COVID19j;t�Xj
þβ3COVID19jt�Yjþβ4COVID19jt�Zjþδt
þθjþεjt
(1) where j stands for country and t for time (day), respectively. R is the daily stock market index return, COVID19 is the measure for the extent of the country’s exposure to the COVID-19 pan-demic, which will be explained in the next section. To understand how differences in the banking structures would influence the reaction of the stock markets to the pandemic, we interact the variable COVID19 with pre-2020 banking structure
variables, X, and include the COVID19jt�Xj term in
the regressions. The interaction terms help to eval-uate the relative contribution of banking market structures to the stock market’s resilience to the
COVID-19 pandemic.4 The term Y accounts for
country-level control variables such as GDP
2
The measures for banking market structures are extracted from the World Bank, Bank Regulation and Supervision Survey (BRSS) (2016) and Global Financial Development Database (GFDD) (2017). We use the latest available data from both data sources. BRSS provides a unique source of comparable economy-level data on how banks are structured, regulated and supervised around the World. The most recent BRSS survey was completed in 2019 and it covers the time period 2011–2016. The GFDD is an extensive dataset of financial system characteristics for 214 countries and it has been last updated in 2019 and contains data for until 2017. The details on the data sources for all banking market structure variables are provided in Table 1..
3We also conduct our estimations using the average values for the banking structure and regulatory indicators and other country characteristics over the last three available years. Our results generally remain consistent and available upon request.
4It is noteworthy to mention that during our sample period, while all equity indices across the world are negatively affected from the COVID-19, not all stock markets are equally negatively affected. To investigate what determines the country’s resilience to the COVID-19 pandemic, we investigate whether the differences between the banking sector structures mitigate the negative relationship. We use the terminology ‘resilience’ throughout the article consistently. Especially after the COVID-19 pandemic, the terminology ‘resilience’ has been commonly used as a measure to gauge the comparative decrease in stock returns and several studies have documented the effectiveness of stock markets in discounting the stock prices of the most exposed companies (Albuquerque et al. 2020 ; Cheema-Fox et al. 2020; Ding et al. 2020).
growth and inflation. Besides, Z stands for the control variables that are widely accepted as deter-minants of stock market return, such as return on equity, earnings to price ratio, and the market value. By doing so, we better isolate the differential influence of COVID19 on stock returns.
Since there is variation both between countries and through time, we follow Ding et al. (2020) and Ashraf (2020) and estimate equation (1) by using fixed effects panel data estimation techniques with robust standard errors clustered at the country level. As Ashraf (2020) stated, panel data metho-dology is preferred over event study methodologies because COVID-19 cases and deaths grow over time but not just at one point in time like in the case of event study methodology. Besides, panel data analysis can better account for the relationship between dependent and independent variables through time, controlling for both cross-sectional and time-series variation and minimizing any pos-sible estimation issues, such as multicollinearity
and heteroscedasticity (Wooldridge 2002; Baltagi
2008). We control for the country and time fixed effects and condition out the heterogeneity
between the countries.δt stands for daily fixed
effects which control for daily international events
that would affect all stock markets and θj stands for
country fixed effects.
Variables
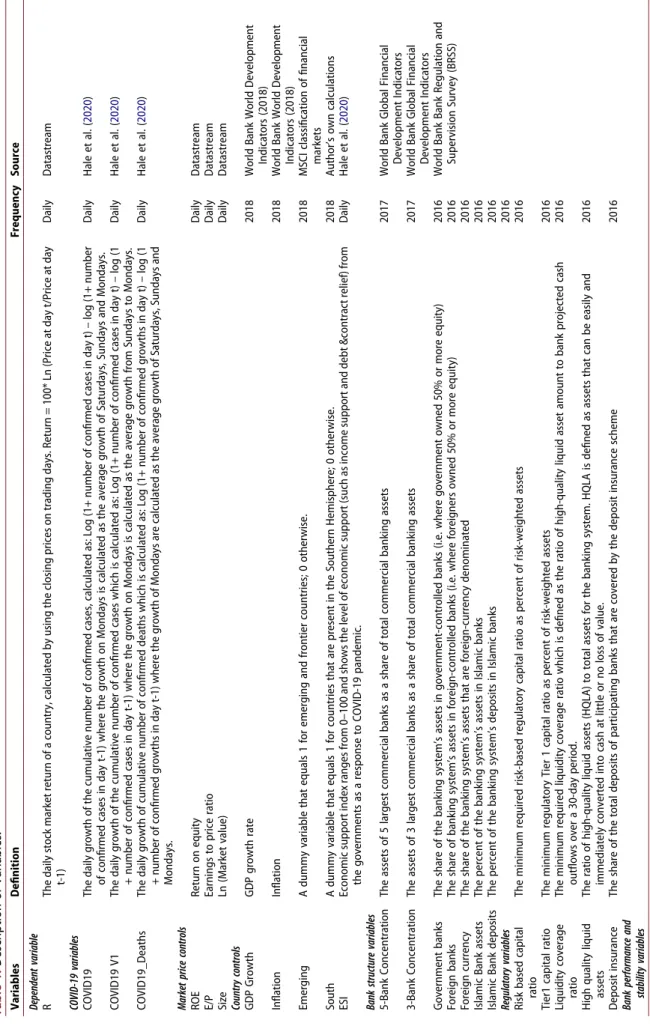
In this section, we present the variables employed in the regressions. The brief descriptions of the variables, their frequency, and their data sources are displayed in Table 1.
Stock market returns
We use countries’ daily stock market returns as the dependent variable in our regressions and stock prices are obtained from Datastream. We use Datastream Global Equity Indices, which are value- weighted and capture approximately 85% of the most liquid and largest stocks in each country. They are commonly used as country-level stock market indicators in the asset pricing literature
(Zaremba 2019). Our sample covers 66 countries
around the world, with their names listed in Table A1 in the Appendix. The first case of the COVID19
pandemic occurs in December 2019, and the first death is observed on 11 January 2020 (Hale et al. 2020). To cover the pandemic period, the daily return of the stock market index is computed from 2 January 2020 through 20 July 2020 using the latest available data at the time of the analysis. We choose to use daily log-returns due to the benefit of an increasing number of degrees of free-dom and that daily returns more accurately capture the response to daily changes in COVID-19 cases
around the world (Zaremba et al. 2021). Table 2
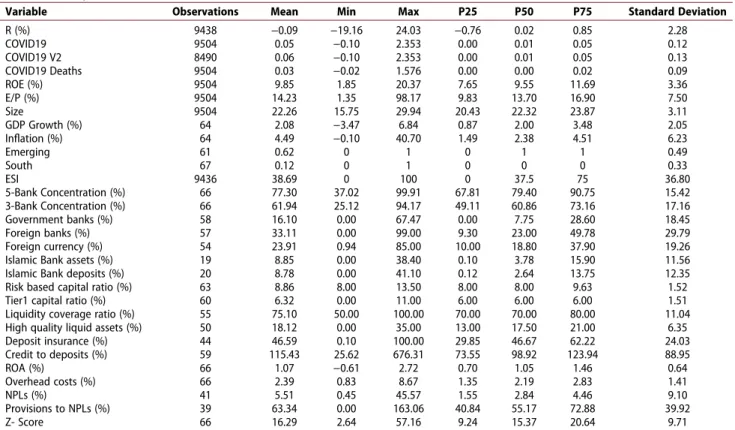
displays the descriptive statistics, and it is observed that the mean value of the daily stock market index return is −0.09% during our sample time period. This shows that, on average, sample countries experienced a negative return in stock markets with a minimum of −19.16% and a maximum of 24.03%. Following Fama and French (2012, 2017), stock market returns for all countries are expressed in terms of USD.
COVID-19 data
The COVID-19 data are gathered from the Oxford COVID-19 Government Response Tracker (Ox- CGRT) database (Hale et al. 2020), which is com-monly used in the literature. To account for coun-tries’ exposure to the COVID-19 pandemic, we measure our main independent variable of interest, COVID19, as the daily growth rate of the cumula-tive number of confirmed cases in a country. Specifically, we follow Ding et al. (2020) and mea-sure it as follows: COVID19j;t ¼ln 1 þ Confirmedcasesj;t � ln 1 þ Confirmedcasesj;t 1 � (2)
Confirmedcasesjt represent the cumulative number
of confirmed cases in country j at day t. COVID-19 confirmed cases data is available for all days (includ-ing the weekends) since a country confirms the first case, but stock market return data are not available during the weekends. To match these two variables, the variable COVID19 is calculated only for the week-days as well, and the growth rate for Monweek-days is calculated as the average growth of cases throughout the weekend. As a second approach and for robust-ness, we perform a different calculation and use COVID-19 V2 as an alternative variable which takes
Table 1. Description of Variables. Variables Definition Frequency Source Dependent variable R The daily stock market return of a country, calculated by using the closing prices on trading days. Return = 100* Ln (Price at day t/Price at day t-1) Daily Datastream COVID-19 variables COVID19 The daily growth of the cumulative number of confirmed cases, calculated as: Log (1+ number of confirmed cases in day t) – log (1+ number of confirmed cases in day t-1) where the growth on Mondays is calculated as the average growth of Saturdays, Sundays and Mondays. Daily Hale et al. ( 2020 ) COVID19 V1 The daily growth of the cumulative number of confirmed cases which is calculated as: Log (1+ number of confirmed cases in day t) – log (1 + number of confirmed cases in day t-1) where the growth on Mondays is calculated as the average growth from Sundays to Mondays. Daily Hale et al. ( 2020 ) COVID19_Deaths The daily growth of cumulative number of confirmed deaths which is calculated as: Log (1+ number of confirmed growths in day t) – log (1 + number of confirmed growths in day t-1) where the growth of Mondays are calculated as the average growth of Saturdays, Sundays and Mondays. Daily Hale et al. ( 2020 ) Market price controls ROE Return on equity Daily Datastream E/P Earnings to price ratio Daily Datastream Size Ln (Market value) Daily Datastream Country controls GDP Growth GDP growth rate 2018 World Bank World Development Indicators (2018) Inflation Inflation 2018 World Bank World Development Indicators (2018) Emerging A dummy variable that equals 1 for emerging and frontier countries; 0 otherwise. 2018 MSCI classification of financial markets South A dummy variable that equals 1 for countries that are present in the Southern Hemisphere; 0 otherwise. 2018 Author’s own calculations ESI Economic support index ranges from 0–100 and shows the level of economic support (such as income support and debt &contract relief) from the governments as a response to COVID-19 pandemic. Daily Hale et al. ( 2020 ) Bank structure variables 5-Bank Concentration The assets of 5 largest commercial banks as a share of total commercial banking assets 2017 World Bank Global Financial Development Indicators 3-Bank Concentration The assets of 3 largest commercial banks as a share of total commercial banking assets 2017 World Bank Global Financial Development Indicators Government banks The share of the banking system’s assets in government-controlled banks (i.e. where government owned 50% or more equity) 2016 World Bank Bank Regulation and Supervision Survey (BRSS) Foreign banks The share of banking system’s assets in foreign-controlled banks (i.e. where foreigners owned 50% or more equity) 2016 Foreign currency The share of the banking system’s assets that are foreign-currency denominated 2016 Islamic Bank assets The percent of the banking system’s assets in Islamic banks 2016 Islamic Bank deposits The percent of the banking system’s deposits in Islamic banks 2016 Regulatory variables 2016 Risk based capital ratio The minimum required risk-based regulatory capital ratio as percent of risk-weighted assets 2016 Tier1 capital ratio The minimum regulatory Tier 1 capital ratio as percent of risk-weighted assets 2016 Liquidity coverage ratio The minimum required liquidity coverage ratio which is defined as the ratio of high-quality liquid asset amount to bank projected cash outflows over a 30-day period. 2016 High quality liquid assets The ratio of high-quality liquid assets (HQLA) to total assets for the banking system. HQLA is defined as assets that can be easily and immediately converted into cash at little or no loss of value. 2016 Deposit insurance The share of the total deposits of participating banks that are covered by the deposit insurance scheme 2016 Bank performance and stability variables (Continued )
the growth rate on Mondays as the growth of cases from only to Sundays to Mondays. For robustness, we further use the daily growth rate of the cumulative number of confirmed deaths in a country, COVID19 Deaths. Table 2 shows that the average values of COVID19, COVID19 V2, and COVID19 Deaths are 0.050, 0.055, and 0.033, respectively, which clearly shows the average daily increase in the cumulative number of cases and deaths in our sample.
Banking structure variables
We consider the influence of three major categories of pre-pandemic banking sector structure variables on the stock markets’ responses to the COVID-19 cases: (1) banking sector characteristics, (2) regula-tions, and (3) performance indicators.
Regarding banking sector characteristics, we consider the influence of 5-Bank Concentration, 3-Bank Concentration, Government banks, Foreign banks, Foreign currency, Islamic Bank assets, and Islamic Bank deposits. The data for these variables are extracted from the World Bank Global Financial
Development Indicators5 and the Bank Regulation
and Supervision Survey (BRSS),6 using the latest
available data in order to account for the pre- pandemic situation in a country. We measure coun-try-level banking sector concentration using 5-Bank Concentration, and 3-Bank Concentration is used for robustness. They measure the share of the 5 largest and 3 largest commercial banks as a share of total commercial banking assets, respectively. According to the competition-fragility literature, countries with more concentrated banking systems are expected to be more resilient during the crisis times, such as the COVID-19 pandemic. This is because higher competition can deteriorate the sta-bility in banking by reducing the charter value of banks and inducing riskier behaviour (Agoraki et al.
2011; Beck, De Jonghe, and Schepens 2013a;
Danisman and Demirel 2019). Less competition
will lead to greater market power and profits pro-vide a buffer against such adverse shocks. Moreover, higher bank concentration can exploit economies of scale and scope, especially in reducing information asymmetry in uncertain times
(Karadima and Louri 2020). Furthermore, the
costs of monitoring and supervising banks may be lower in a more concentrated structure in crisis
Table 1. (Continued). Credit to deposits The credit provided to the private sector by domestic money banks as a share of total deposits. 2017 World Bank Global Financial Development Indicators ROA Commercial banks’ after-tax net income to yearly averaged total assets. 2017 Overhead costs Operating expenses of banks as a share of total assets 2017 NPLs Ratio of nonperforming loans (payments of interest and principal past due by 90 days or more) to total gross loans. 2017 Provisions to NPLs Provisions as a share of nonperforming loans 2017 Z- Score The probability of default of a country’s commercial banking system which compares the buffer of a country’s commercial banking system (capitalization and returns) with the volatility of those returns. Higher values indicate more stability. Z-score = [(Return on assets+ Equity to total assets)/Standard deviation of ROA] 2017 Note: This table presents the variables, brief descriptions, frequency and data sources. The dependent variable (R) , COVID-19 variables, market price controls, and ESI are daily. The rest of the variables are extracted using the most recent available year’s data.
times which can provide a more robust banking
system (Evrensel et al. 2008).
Government banks represent the share of the banking system’s assets in government-controlled banks where the government owns 50% or more equity. In such a banking system with higher gov-ernment dominance, firms can have easier and better access to lending due to government support and guarantees during uncertain times, which might provide more resilience. Government- controlled banks can play a beneficial role by redu-cing the cyclicality of loan growth as compared to private banks during crisis times (Chen et al. 2016; Behr, Foos, and Norden 2017).
Foreign banks indicate the share of the banking system’s assets in foreign-controlled banks where foreigners own 50% or more equity. Another indi-cator of foreign presence is used for robustness, Foreign currency, which represents the share of the banking system’s assets that are foreign- currency denominated. We expect that foreign
presence in the banking system can increase the resilience of countries’ stock market performance during the COVID-19 pandemic because these banks have a stabilizing effect on the banking
sys-tem (Dwumfour 2017). Foreign presence in
a country helps increase access to credit due to the extended levels of credit from the parent banks, decreasing the cost of credit during such uncertain times (De Haas and Van Lelyveld 2004; Allen et al. 2017; Demir and Danisman 2020a).
We next consider the presence of Islamic banking in a country by using the variable Islamic Bank assets that demonstrates the share of the banking system’s assets in Islamic banks; Islamic Bank deposits is used as an alternative variable, representing the share of the banking system’s deposits in Islamic banks, respectively. A part of the literature documents that Islamic banks can contribute to financial stability
(Rashid, Yousaf, and Khaleequzzaman 2017;
Nosheen and Rashid 2021). The risk-sharing
Table 2. Descriptive Statistics.
Variable Observations Mean Min Max P25 P50 P75 Standard Deviation
R (%) 9438 −0.09 −19.16 24.03 −0.76 0.02 0.85 2.28 COVID19 9504 0.05 −0.10 2.353 0.00 0.01 0.05 0.12 COVID19 V2 8490 0.06 −0.10 2.353 0.00 0.01 0.05 0.13 COVID19 Deaths 9504 0.03 −0.02 1.576 0.00 0.00 0.02 0.09 ROE (%) 9504 9.85 1.85 20.37 7.65 9.55 11.69 3.36 E/P (%) 9504 14.23 1.35 98.17 9.83 13.70 16.90 7.50 Size 9504 22.26 15.75 29.94 20.43 22.32 23.87 3.11 GDP Growth (%) 64 2.08 −3.47 6.84 0.87 2.00 3.48 2.05 Inflation (%) 64 4.49 −0.10 40.70 1.49 2.38 4.51 6.23 Emerging 61 0.62 0 1 0 1 1 0.49 South 67 0.12 0 1 0 0 0 0.33 ESI 9436 38.69 0 100 0 37.5 75 36.80 5-Bank Concentration (%) 66 77.30 37.02 99.91 67.81 79.40 90.75 15.42 3-Bank Concentration (%) 66 61.94 25.12 94.17 49.11 60.86 73.16 17.16 Government banks (%) 58 16.10 0.00 67.47 0.00 7.75 28.60 18.45 Foreign banks (%) 57 33.11 0.00 99.00 9.30 23.00 49.78 29.79 Foreign currency (%) 54 23.91 0.94 85.00 10.00 18.80 37.90 19.26 Islamic Bank assets (%) 19 8.85 0.00 38.40 0.10 3.78 15.90 11.56 Islamic Bank deposits (%) 20 8.78 0.00 41.10 0.12 2.64 13.75 12.35 Risk based capital ratio (%) 63 8.86 8.00 13.50 8.00 8.00 9.63 1.52 Tier1 capital ratio (%) 60 6.32 0.00 11.00 6.00 6.00 6.00 1.51 Liquidity coverage ratio (%) 55 75.10 50.00 100.00 70.00 70.00 80.00 11.04 High quality liquid assets (%) 50 18.12 0.00 35.00 13.00 17.50 21.00 6.35 Deposit insurance (%) 44 46.59 0.10 100.00 29.85 46.67 62.22 24.03 Credit to deposits (%) 59 115.43 25.62 676.31 73.55 98.92 123.94 88.95 ROA (%) 66 1.07 −0.61 2.72 0.70 1.05 1.46 0.64 Overhead costs (%) 66 2.39 0.83 8.67 1.35 2.19 2.83 1.41 NPLs (%) 41 5.51 0.45 45.57 1.55 2.84 4.46 9.10 Provisions to NPLs (%) 39 63.34 0.00 163.06 40.84 55.17 72.88 39.92 Z- Score 66 16.29 2.64 57.16 9.24 15.37 20.64 9.71
Note: This table presents the descriptive statistics for the pooled sample on all the variables used in our analysis. As presented in Table 1 the variables have different frequencies. While the dependent variable (R), COVID-19 variables, market price controls and ESI are daily; the rest of the variables has the most recent available year’s data.
5
The latest data for World Bank Global Financial Development Indicators is 2017.
6The BRSS is a survey coordinated by the World Bank which provides data on how banks are regulated and supervised around the world. The latest survey uses the data for 2016.
mechanism being encouraged between creditors and borrowers and assets-based financing mechanisms of Islamic banks can be expected to provide resilience during uncertain periods
(Hasan and Dridi 2011; Beck, Demirgüç-Kunt,
and Merrouche 2013b).
For the regulatory variables, we consider the influence of Risk based capital ratio, Tier1 capital ratio, Liquidity coverage ratio, High quality liquid assets and Deposit insurance. The data for these regulatory variables are extracted from the World Bank, Bank Regulation and Supervision Survey (BRSS), using the latest data (2016). The Risk based capital ratio stands for the minimum required risk- based regulatory capital ratio as a percent of risk- weighted assets. The Tier1 capital ratio is used for robustness and shows the minimum regulatory Tier 1 capital ratio as a percent of risk-weighted assets. The Liquidity coverage ratio stands for the ratio of
high-quality liquid asset (HQLA)7 amount to bank
projected cash outflows over 30 days. High quality liquid assets are used as an alternative liquidity vari-able that is defined as the ratio of HQLA to total assets for the banking system. Deposit insurance is calculated as the share of the total deposits of parti-cipating banks that are covered by the deposit insur-ance scheme. The 2008 Global Financial Crisis has led to tighter regulations in order to address the flaws that were revealed in the crisis period. The need for strong regulation and supervision has
been well understood (Anginer et al. 2019). The
Basel III Accord has released stricter capital and liquidity requirements such as the Liquidity Coverage Ratio (LCR), the Net Stable Funding Ratio (NSFR), and the minimum equity capital thresholds. Although banks are relatively better capitalized as compared to their levels during the Global Financial Crisis of 2008, there is still hetero-geneity in banking structures across countries (Anginer et al. 2019). We expect that stock markets of countries with stricter pre-pandemic regulatory requirements on capital and liquidity are more likely to be resilient to the pandemic. This is consistent with the positive capital buffer effect and the reduced risk-taking incentives resulting from higher
capita-lization (Keeley 1990; Keeley and Furlong 1990).
Higher liquidity levels create a liquidity buffer that
insures against liquidity shocks and bank runs and improves the soundness of the banking sector espe-cially during crisis times (Berger and Bouwman 2009; Acharya and Naqvi, 2012). Since the 2008 global financial crisis, the coverages of deposit insur-ances across the countries have been above the pre- crisis levels. Even though higher deposit insurance decreases the probability of bank runs and promotes financial stability; there are also side effects such as the potential increases in the moral hazard beha-viours of banks and decreases in bank monitoring
by the depositors (Demirguc-Kunt et al. 2015).
Therefore, we do not have a priori expectation on the impact of deposit insurance.
Finally, we consider the influence of country-level bank performance indicators. These include Credit to deposits, ROA, Overhead costs, NPLs, Provisions to NPLs, and the Z-Score whose data is extracted from World Bank Global Financial Development Indicators using the latest data from 2017. Credit to deposits is a proxy for the amount of available credit and stands for the credit provided to the private sector by domestic banks as a share of total deposits. ROA is a measure for profitability which indicates the commercial banks’ after-tax net income to yearly averaged total assets. The variable Overhead costs is a proxy for efficiency which is calculated as the operating expenses of banks as a share of total assets, and NPLs is a measure of credit risk defined as the
ratio of nonperforming loans to total gross loans.8
Provisions to NPLs is another measure of credit risk and measured as provisions as a share of nonper-forming loans. Finally, we consider the Z-score, which is the probability of default of a country’s commercial banking system. It compares the buffer of a country’s commercial banking system (capitali-zation and returns) with the volatility of those
returns, and higher values indicate more stability.9
Stock returns of countries with more stable banking systems are likely to be more resilient to the COVID- 19. Pre-pandemic performance of the banking struc-ture may determine the magnitude of the pandemic effect on stock markets. We expect that a stable banking system will provide more liquidity to the companies, which will provide a buffer. However, if a country is experiencing higher credit levels to deposit ratio, overhead costs, high provisions, and
7
nonperforming loans, the vulnerability will increase, implying a weaker pre-pandemic financial condi-tion. This is in line with the notion that a pandemic- led decrease in stock markets is milder for banks and firms with a healthier pre-COVID-19 financial situa-tion (Ding et al. 2020; Demir and Danisman 2020b). With regard to descriptive statistics of banking
structure variables, Table 2 demonstrates that the
level of bank concentration is quite high, with the mean values for 5-Bank Concentration and 3-Bank Concentration being 77.30% and 61.94%, respectively. The share of government- and foreign-controlled banks is 16.10% and 33.11%, respectively, and on average 23.91% of the banking system assets are for-eign-currency denominated. The data on the pre-sence of Islamic banks are fewer and only 20 out of 66 countries have Islamic banking presence in their banking system. We see that on average 8.85% and 8.78% of their banking system’s assets and deposits are in Islamic banks. Considering the regulatory vari-ables, we observe that the average Risk based capital ratio is 8.86% and Tier1 capital ratio is 6.32%, respec-tively. Moreover, the mean values of Liquidity cover-age ratio and High-quality liquid assets are 75.10% and 18.12%, respectively. It is observed that the share of deposits covered by the deposit insurance scheme in our sample is 46.59%, with a minimum of 0.10% and a maximum of 100%. In regards to banking performance indicators, the mean Credit to deposits and ROA stands at 115.43% and 1.07%, the average Overhead costs, NPLs, and Provisions to NPLs stand at 2.39%, 5.51%, and 63.34%, respectively.
Stock market and country controls
We control for an array of key asset pricing factors that are widely used as predictors of country-level returns in the cross-section: ROE, E/P, and Size, whose data is extracted from Datastream (Keppler
and Encinosa 2011; Ellahie, Katz, and Richardson
2020; Kim 2012; Chen et al. 2018). Controlling for them helps to disentangle the effect of COVID-19 from the other regular cross-sectional return patterns
(Zaremba et al. 2021; Ramelli, and Wagner, 2020;
Albuquerque et al., 2020). ROE stands for return on
equity, E/P is the earnings to price ratio, and Size is
calculated as the natural logarithm of market value, respectively.
We also control for some country-characteristics to account for the different country contexts. GDP Growth and Inflation are taken from the World Bank
World Development Indicators.10 Table 2
demon-strates that the average GDP Growth in our sample 2.08%, and ranges between −3.47% and 6.84%. The average Inflation is 4.49%, showing a high variation with the standard deviation being 6.23%. Our sample includes both emerging and develop countries which are very different in terms of the depth and degree of development of their stock markets. Therefore, we control for this by including a dummy variable, Emerging, that equals 1 for emerging and frontier countries; 0 otherwise. We use the MSCI classification of financial markets. We also control for the time lag of the spread of the COVID pandemic across the two hemispheres of the world by adding, South, which is a dummy variable that equals 1 for countries that are present in the Southern Hemisphere; 0 otherwise. Table 2 shows that 62% of the countries in our sample are categorized as emerging and frontier and that 12% of the countries are from the Southern hemisphere, respectively. We next account for the differences between economic support by the governments dur-ing the COVID-19 pandemic. We include the eco-nomic support index (ESI) of Hale et al. (2020), which ranges from 0 to 100 and shows the level of economic support, such as income support and debt & contract relief, from the governments. It is available daily in the database, and we use daily index values from 2nd January 2020 through 20 July 2020.
Table A2 in the Appendix presents the correlation coefficients among the variables. The correlation coefficients among the banking structure variables are somewhat higher, which is why we include them one at a time and pay careful attention to the poten-tial multicollinearity issues.
IV. Findings
We first present the findings on the influence of COVID-19 on stock market returns and then pre-sent the findings of the impact of pre-pandemic
8Nonperforming loans are taken as loans that have payments of interest and principal past due by 90 days or more. 9
banking sector structures on the resilience of stock market reactions.
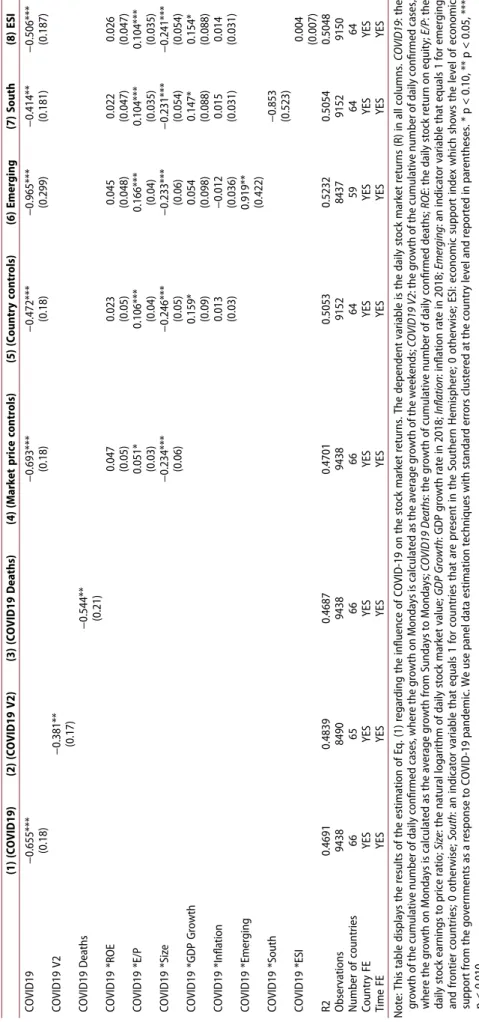
The impact of COVID-19 on stock market returns
Table 3 presents the findings on the influence of COVID-19 on stock market returns. The depen-dent variable is R, which is the daily stock market return of a country. Column 1 uses COVID-19 as the measure of the country’s exposure to the pan-demic. Its coefficient appears negative and signifi-cant, showing that exposure to the pandemic in terms of the daily growth of the cumulative number of cases deteriorates stock market returns. Considering the economic magnitudes, if COVID-19 cases grow at the sample average of 0.05%, the stock market returns will be down by 0.03% (0.05%×-0.655). This is a significant drop in terms of magnitude because it translates into 33% of the sample mean of stock market returns over the sample period (−0.09). This finding is in line with Al-Awadhi et al. (2020), Ashraf (2020), and Zhang, Hu, and Ji (2020), who demonstrate that the stock markets react negatively to COVID-19 exposure. The results are robust in Column 2, where we use an alternative variable COVID-19 V2 for pandemic exposure.11 In Column 3, we find the results continue to hold, although the COVID19 Deaths variable is used as an alternative measure for robustness. The results further remain robust when we include key asset pricing factors (ROE, E/P, Size) through interacting them with the COVID19 term in Column 4 and including coun-try controls (GDP Growth, Inflation) in Column 5, respectively. Column 5 shows that the interactions between COVID19 and E/P and GDP growth appear positive and significant, and the interaction with Size enters negatively and significantly. This is meaningful because the stock markets of more financially developed and richer economies are expected to be more resilient to the COVID-19 pandemic due to their stronger economic and financial conditions as compared to less financially
developed and poorer ones (Ding et al. 2020).
Meanwhile, the stock markets with larger size are
affected more severely from the pandemic. Columns 6 and 7 subsequently add the variables Emerging and South to account for differences in the depth and degree of development of country’s stock markets and control for the time lag of the spread of the COVID pandemic across the two hemispheres of the world, respectively. Column 8 adds ESI to control for differences in the govern-ment’s responses in terms of economic support such as income support and debt & contract relief. We observe that the coefficients of the COVID-19 terms keep their negative signs and significances in all specifications. This confirms that stock markets have reacted negatively to COVID-19 even after controlling for various key asset pricing factors and country controls.
The role of banking sector structure
Table 4 explores the impact of different pre- pandemic banking sector structures on the resili-ence of stock market reactions induced by COVID- 19 cases. For the sake of brevity, we display only the slope coefficients of the considered interaction terms and do not display the control variables. Columns 1–5 include 5-Bank Concentration, 3-Bank Concentration, Government banks, Foreign banks, and Foreign currency one at a time due to multicollinearity concerns, and COVID-19 is used as a measure of the pandemic exposure. We observe that the interactions between COVID19 and 5-Bank Concentration and Foreign banks are positive and significant. The coefficients of the stand-alone COVID-19 variables keep their signif-icance with negative signs, confirming the negative stock market reaction to the COVID-19. The sign
and significance of the overall effects (β1þβ2Þare
presented at the bottom of Table 3. We observe that overall effects keep their negative sign and signifi-cance, which is as expected. This is because these factors do not provide full immunity to the nega-tive stock price reaction, but they just mitigate the negative effect to some extent. The interactions between COVID19 and 3-Bank Concentration and Foreign currency are used for robustness, and they
10We use the latest available data which is 2018. 11
As presented in Table 1, both COVID19 and COVID19 V2 measure the growth of cumulative number of cases but the difference between the variables COVID19 and COVID19_V2 is the growth rate for the weekends. While COVID19 calculates the growth in Mondays as the average growth of Saturdays, Sundays and Mondays; COVID19 V2 uses the average growth from Sundays to Mondays instead.
Table 3. The influence of COVID-19 on stock market returns. (1) (COVID19) (2) (COVID19 V2) (3) (COVID19 Deaths) (4) (Market price controls) (5) (Country controls) (6) Emerging (7) South (8) ESI COVID19 −0.655*** −0.693*** −0.472*** −0.965*** −0.414** −0.506*** (0.18) (0.18) (0.18) (0.299) (0.181) (0.187) COVID19 V2 −0.381** (0.17) COVID19 Deaths −0.544** (0.21) COVID19 *ROE 0.047 0.023 0.045 0.022 0.026 (0.05) (0.05) (0.048) (0.047) (0.047) COVID19 *E/P 0.051* 0.106*** 0.166*** 0.104*** 0.104*** (0.03) (0.04) (0.04) (0.035) (0.035) COVID19 *Size −0.234*** −0.246*** −0.233*** −0.231*** −0.241*** (0.06) (0.05) (0.06) (0.054) (0.054) COVID19 *GDP Growth 0.159* 0.054 0.147* 0.154* (0.09) (0.098) (0.088) (0.088) COVID19 *Inflation 0.013 −0.012 0.015 0.014 (0.03) (0.036) (0.031) (0.031) COVID19 *Emerging 0.919** (0.422) COVID19 *South −0.853 (0.523) COVID19 *ESI 0.004 (0.007) R2 0.4691 0.4839 0.4687 0.4701 0.5053 0.5232 0.5054 0.5048 Observations 9438 8490 9438 9438 9152 8437 9152 9150 Number of countries 66 65 66 66 64 59 64 64 Country FE YES YES YES YES YES YES YES YES Time FE YES YES YES YES YES YES YES YES Note: This table displays the results of the estimation of Eq. (1) regarding the influence of COVID-19 on the stock market returns. The dependent variable is the daily stock market returns (R) in all columns. COVID19 : the growth of the cumulative number of daily confirmed cases, where the growth on Mondays is calculated as the average growth of the weekends; COVID19 V2 : the growth of the cumulative number of daily confirmed cases, where the growth on Mondays is calculated as the average growth from Sundays to Mondays; COVID19 Deaths : the growth of cumulative number of daily confirmed deaths; ROE : the daily stock return on equity; E/P : the daily stock earnings to price ratio; Size : the natural logarithm of daily stock market value; GDP Growth : GDP growth rate in 2018; Inflation : inflation rate in 2018; Emerging : an indicator variable that equals 1 for emerging and frontier countries; 0 otherwise; South : an indicator variable that equals 1 for countries that are present in the Southern Hemisphere; 0 otherwise; ESI: economic support index which shows the level of economic support from the governments as a response to COVID-19 pandemic. We use panel data estimation techniques with standard errors clustered at the country level and reported in parentheses. * p < 0.10, ** p < 0.05, *** p < 0.010.
are both positive and significant, confirming pre-vious findings. However, the interaction between COVID19 and Government banks is insignificant. Next, in Column 6, we include all bank structure variables for robustness checks. Specifically, we include the interaction terms between COVID19 and the main bank structure variables, 5-Bank Concentration, Government banks, and Foreign banks, and observe that our results continue to hold. Column 7 uses an alternative variable for pandemic exposure, COVID19 V2, and the findings remain consistent. To gauge the economic magni-tudes, we use Column 6 for interpretation. The coefficients indicate that a one standard deviation increase in pre-pandemic 5-Bank Concentration and Foreign banks mitigate the stock market reduc-tions caused by pandemic on average by 0.65% (0.042 × 15.42) and 0.45% (0.015 × 29.79), respec-tively. These magnitudes are economically mean-ingful because the sample mean of daily stock return is −0.09%.
Next, in Columns 8–10, we analyse the influence of pre-pandemic Islamic bank presence on the resi-lience of stock market reactions induced by COVID-19 cases. We have fewer observations on Islamic bank presence because not many countries have Islamic banks in their banking context. Columns 8 and 9 use COVID19 as a measure of pandemic exposure, and it is observed that the coefficients of both Islamic Bank assets and Islamic Bank deposits are positive and significant. Column 10 uses COVID19 V2 as a pandemic expo-sure meaexpo-sure and uses Islamic Bank assets as a measure of Islamic bank presence. The coefficient of Islamic Bank assets is still positive and signifi-cant. As the data on the presence of Islamic banks is fewer, the results should be interpreted with caution.
Overall, our findings show that countries with (1) more concentrated banking systems, (2) a high presence of foreign banks and foreign currency-denominated assets, and (3) a high share of Islamic banks, are more resilient to the pandemic. Our findings are in line with the competition-fragility literature that states that the concentrated banking systems are more resi-lient and competition deteriorates the stability in banking by reducing the charter value of banks and inducing risky behaviour (Agoraki
et al. 2011; Beck, De Jonghe, and Schepens
2013a; Danisman and Demirel 2019).
Moreover, our findings that state that foreign bank presence increases the resilience of bank-ing systems are in line with the literature that shows the stabilizing effect of foreign banks on the banking systems. Wider access to credit is reached with foreign bank entry and the cost of credit during turbulent periods is reduced (De
Haas and Van Lelyveld 2004; Allen et al. 2017;
Demir and Danisman 2020a). We also observe
that countries with a higher share of Islamic banks are more resilient to pandemic-induced stock market reduction. This is in line with the literature that documents Islamic banks being resilient during uncertain periods, mainly due to the risk-sharing mechanism being encouraged between creditors and borrowers (Hasan and
Dridi 2011; Beck, Demirgüç-Kunt, and
Merrouche 2013b).
The COVID-19 pandemic and bank regulations
Table 5 investigates the influence of pre-
pandemic bank regulations on the stock mar-kets’ responses to the COVID-19 cases. We
observe that the interactions between
COVID19, Risk based capital ratio, Tier1 capital ratio, Liquidity coverage ratio, and High-quality liquid assets are positive and significant, but the interaction between COVID19 and Deposit insurance is insignificant. This implies that the stock returns of countries with tighter pre- pandemic regulations on capital and liquidity are more resilient to the COVID-19 pandemic. While in Columns 1–6, we use COVID-19 as a measure of pandemic exposure, Column 6 includes all regulatory terms, namely the inter-actions between COVID19, Risk based capital ratio, Liquidity coverage ratio, and Deposit insurance.12 Here we see that the results con-tinue to hold. Column 7 uses COVID-19 V2 as an alternative variable for robustness and our results remain consistent.
Overall, our findings show that stock markets of countries with stricter pre-pandemic regulatory requirements on capital and liquidity are more resilient to the COVID-19 pandemic. As a response to the 2008 Global Financial Crisis, the
Table 4. The influence of banking market characteristics on the stock markets’ responses to the COVID-19 cases. (1) (5-Bank Concentration) (2) (3-Bank Concentration) (3) (Government Banks) (4) (Foreign banks) (5) (Foreign currency) (6) (All) (7) (All) (COVID19 V2) (8) (Islamic bank assets) (9) (Islamic bank deposits) (10) (Islamic bank assets) (COVID19 V2) COVID19 (β1 Þ −0.549*** −0.570*** −0.415** −0.384** −0.413** −0.408** −0.155*** 0.249 0.166 0.148 (0.17) (0.17) (0.19) (0.19) (0.19) (0.20) (0.20) (0.29) (0.29) (0.27) COVID19* 5-Bank Concentration (β2 Þ 0.029*** 0.042*** 0.034** (0.01) (0.01) (0.014) COVID19* 3-Bank Concentration (β2 Þ 0.029*** (0.01) COVID19* Government banks (β2 Þ 0.001 0.015 0.001 (0.01) (0.01) (0.01) COVID19* Foreign banks (β2 Þ 0.011** 0.015** 0.015** (0.01) (0.01) (0.006) COVID19* Foreign currency (β2 Þ 0.028*** (0.01) COVID19* Islamic Bank assets (β2 Þ 0.072*** 0.067*** (0.03) (0.03) COVID19* Islamic Bank deposits (β2 Þ 0.071*** (0.03) R2 0.5043 0.5044 0.5152 0.5055 0.513 0.5115 0.5191 0.4052 0.415 0.4061 Observations 9152 9152 8151 8008 7722 7722 6984 2717 2860 2487 Number of countries 64 64 57 56 54 54 54 19 20 19 Country FE YES YES YES YES YES YES YES YES YES YES Time FE YES YES YES YES YES YES YES YES YES YES Stock characteristics*COVID19 YES YES YES YES YES YES YES YES YES YES Country characteristics*COVID19 YES YES YES YES YES YES YES YES YES YES β1 þ β2 −0.52*** −0.541*** −0.414** −0.373** −0.385** 0.321 0.237 0.215 Note: This table displays the results of the estimation of Eq. (1) regarding the influence of banking sector characteristics on the stock market responses induced by the COVID-19 pandemic. The dependent variable is the daily stock market returns (R) in all columns. COVID19 : the growth of the cumulative number of daily confirmed cases, where the growth on Mondays is calculated as the average growth of the weekends; 5-Bank Concentration : the assets of 5 largest commercial banks as a share of total commercial banking assets; 3-Bank Concentration : the assets of 3 largest commercial banks as a share of total commercial banking assets; Government banks : the share of the banking system’s assets in government-controlled banks; Foreign banks : the share of banking system’s assets in foreign-controlled banks; Foreign currency : the share of the banking system’s assets that are foreign-currency denominated; Islamic Bank assets : the percent of the banking system’s assets in Islamic banks; Islamic Bank deposits : the percent of the banking system’s deposits in Islamic banks. All columns use COVID19 as a measure of pandemic exposure except Columns 7 &10 use COVID19 V2 as an alternative measurement. The interaction terms, Stock characteristics*COVID19 and Country characteristics*COVID19 , are included in the regressions. Stock characteristics include ROE : the daily stock return on equity; E/P : the daily stock earnings to price ratio; and Size : the natural logarithm of daily stock market value. Country characteristics include GDP Growth : GDP growth rate in 2018; and Inflation : inflation rate in 2018. We use panel data estimation techniques with standard errors clustered at the country level and reported in parentheses. * p < 0.10, ** p < 0.05, *** p < 0.010.