POLİTEKNİK DERGİSİ
JOURNAL of POLYTECHNIC
ISSN: 1302-0900 (PRINT), ISSN: 2147-9429 (ONLINE) URL: http://dergipark.org.tr/politeknik
Using random forest tree classification for
evaluating vertical cross-sections in epoxy
blocks to get unbiased estimates for 3D
mineral map
Tarafsız 3D mineral harita tahminleri elde
etmek için random forest tree sınıflandırması
kullanılarak epoksi bloklardaki dikey kesitlerin
değerlendirilmesi
Yazar(lar) (Author(s)): Mahmut CAMALAN
1, Mahmut ÇAVUR
2ORCID
1: 0000-0001-7071-7910
ORCID
2: 0000-0002-1256-2700
Bu makaleye şu şekilde atıfta bulunabilirsiniz(To cite to this article): Camalan M., Çavur M., “Using
random forest tree classification for evaluating vertical cross-sections in epoxy blocks to get unbiased estimates for 3D mineral map”, Politeknik Dergisi, 24(1): 113-120, (2021).
Erişim linki (To link to this article): http://dergipark.org.tr/politeknik/archive
Using random forest tree classification for evaluating vertical
cross-sections in epoxy blocks to get unbiased estimates for 3D
mineral map
Highlights
❖ Areal mineral maps are measured from polished sections to obtain data about rock particles.
❖ Polished sections may be atypical of rock particles because of the preferential settling of heavy minerals. ❖ On the other hand, random forest was used to evaluate if vertical sections are typical of rock particles. ❖ Results show that vertical sections are typical of rock particles.
❖ The use of vertical cross-sections may promote the use of microsocpy for rock characterization.
Graphical Abstract
Polished sections may be unrepresentative for mineral mapping because of the preferential settling of heavy minerals. This study shows that any vertical cross-section (any section along the settling direction of particles) can be an unbiased estimate of the mineral map.
Figure. The bottom, middle and top zones of a vertical CT section of chromite particles.
Aim
The aim is to test whether any section along the settling direction of particles can be an unbiased estimate of the 3D mineral map of a chromite ore sample.
Design & Methodology
Vertical sections were reconstructed from the projections of the epoxy block of chromite particles under X-ray CT. All the images were then successively evaluated with the Random Forest Classifier and Watershed transform.
Originality
For the first time, this study shows that the vertical sections are unbiased estimates of the 3D volume of particles, by analyzing randomly-taken X-ray CT projections of the particles.
Findings
Results show that the composition and particle size distribution of any vertical cross-section are comparable to the relevant measurements in rock particles.
Conclusion
Any vertical cross-section (any section along the settling direction of particles) can be an unbiased estimate of the mineral map. Therefore, the use of vertical cross-sections may promote the use of x-ray tomography or microsocpy for rock characterization.
Declaration of Ethical Standards
The author(s) of this article declare that the materials and methods used in this study do not require ethical committee permission and/or legal-special permission.
Politeknik Dergisi, 2021; 24(1) : 113-120 Journal of Polytechnic, 2021; 24 (1): 113-120
113
Tarafsız 3D Mineral Harita Tahminleri Elde Etmek
için Random Forest Tree Sınıflandırması Kullanılarak
Epoksi Bloklardaki Dikey Kesitlerin Değerlendirilmesi
Araştırma Makalesi / Research Article
Mahmut CAMALAN1*, Mahmut ÇAVUR2
1Orta Doğu Teknik Üniversitesi, Ankara, Turkiye
2Yönetim Bilişim Sistemleri, Kadir Has Üniversitesi, İstanbul, Türkiye (Geliş/Received : 06.08.2019 ; Kabul/Accepted : 22.02.2020)
ÖZ
Alansal mineral haritaları, epoksi reçinenin dibine çöken cevher tanelerinin yüzeylerini içeren parlak kesitlerinden yapılmaktadır. Fakat, ağır mineraller nispeten dibe çökebilmekte ve parlak yüzeyi ağır mineraller açısından zengin yapabilmektedir. Bu ise parlak kesitlerden hesaplanan alansal (2D) mineral haritalarının, hacimsel (3D) haritaların taraflı tahminleri haline gelmesine sebep olabilmektedir. Bu çalışma, parlak kesite dik olarak (parçacıkların çökelme yönü boyunca) alınan rastgele bir kesitin bir kromit cevheri numunesinin 3D mineral haritasının tarafsız bir tahmini olarak kullanılıp kullanılamayacağını test etmeyi amaçlamaktadır. Bu çalışmanın amacı için, dikey kesitlerin 2D haritaları, öncesi ve sonrası görüntü işleme araçlarıyla bütünleşmiş Random Forest sınıflandırmasıyla elde edilmiştir. Daha sonra, 2D haritalar, stereolojik hatalar olmadığı varsayılarak 3D mineral haritalarına dönüştürülmüştür. 3D haritalardan tahmin edilen modal mineraloji ve tane boyu dağılımları, sırasıyla XRD ve kuru eleme analizlerinden tahmin edilen sonuçlarla karşılaştırılmıştır. Herhangi bir 2D harita gerçek analizlere yakın modal mineraloji ve tane boyu dağılımı veriyorsa, bu 2D harita cevher numunesinin 3D haritasının tarafsız bir tahmini olarak seçilmiştir. Bu çalışmanın sonuçları herhangi bir dikey kesitin, ağır minerallerin öncelikli olarak çöktüğü parlak kesitten farklı olarak gerçek 3D haritanın tarafsız bir tahmini olacağını desteklemektedir.
Anahtar Kelimeler: X-ışını bilgisayarlı tomografi, optik mikroskop, mineral haritası, parlak kesit, dikey kesit.
Using Random Forest Tree Classification for
Evaluating Vertical Cross-Sections in Epoxy Blocks to
Get Unbiased Estimates for 3D Mineral Map
ABSTRACT
Areal mineral maps are constructed from the polished sections of particles that settle to the bottom of epoxy resin. However, heavy minerals can preferentially settle to the bottom, making the polished surface rich in heavy minerals. Therefore, polished sections will become biased estimates of the volumetric (3D) map. The study aims to test whether any vertical cross-section (any section along the settling direction of particles) can be an unbiased estimate of the 3D mineral map of a chromite ore sample. For the purpose of this study, 2D maps of the vertical cross-sections were acquired by using Random Forest classification coupled with image pre- and post-processing tools. Then, 3D mineral maps were converted from 2D maps without assuming stereological errors. The modal mineralogy and particle size distributions predicted from 3D maps were compared with the same features estimated from the particulate sample by XRD and dry sieving analyses, respectively. Any 2D map which yields a modal mineralogy and a size distribution similar to the true analyses was selected as an unbiased estimate of the true 3D map. The results suggest that any vertical cross-section is an unbiased estimate, unlike polished section at which heavier minerals settle preferentially.
Keywords: X-ray computed tomography, optical microscope, mineral map, polished section, vertical section.
1. INTRODUCTION
Areal mineral maps are commonly used in process mineralogy to obtain quantitative data regarding the morphology and composition of particles. A mineral map for any sample of particles can be constructed from the mineral surfaces under optical or electron microscopes. These mineral surfaces are generally acquired from the polished section of particles (Figure 1) settled in epoxy resin. The use of a polished section is quite common for
(i) automatic identification/quantification of rock-forming minerals [1–7] and (ii) prediction of the mineral liberation spectrum, i.e. distribution of a selected mineral phase in a population of particles [8–12]. However, the frequent use of the polished sections does not ensure that such mineralogical analyses will always give the correct results. If the minerals in a particulate sample have different densities, relatively heavier minerals will preferentially settle to the polished section [10,13–15] This phenomenon results in a 2D map from which the amount of heavier minerals is overestimated in sample particles [16]. The serial sectioning experiments made by *Sorumlu Yazar (Corresponding Author)
Mahmut CAMALAN, Mahmut ÇAVUR / POLİTEKNİK DERGİSİ, Politeknik Dergisi,2021;24(1): 113-120
Lätti and Adair [17] even suggested that this stereological error could disappear for a particulate sample that contained silicate minerals with similar densities.
Figure 1. A perspective view of sample particles settled in
epoxy resin. Examples of a polished (rectangle ABCD) and a vertical section (rectangle EFGH) are illustrated in the image.
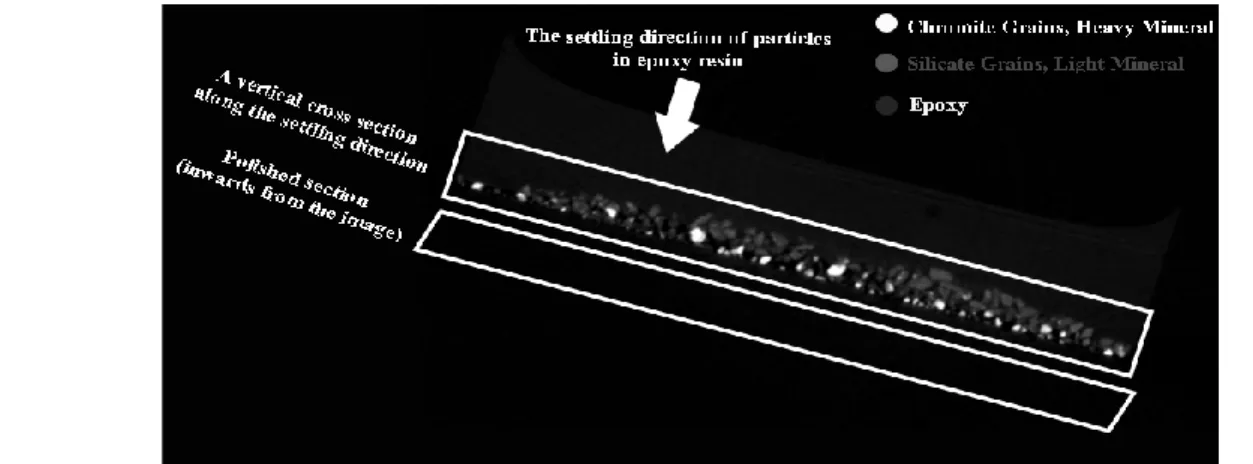
Figure 2, for example, is an illustrative tomographic image of an epoxy block in which the heavier chromite grains settled to bottom more readily than relatively lighter siliceous gangue. Since the polished section corresponds to a plane somewhere in the bottom of the resin, 2D mineral maps taken from the polished section are biased, i.e. they will excessively contain the surface of chromite grains. Nevertheless, this bias can be minimized by selecting proper cross-sections on which the heavier minerals are not segregated. To the best of our knowledge, only a few studies suggested the vertical sections (sections perpendicular to the polished section) for the correct modal mineralogy measurement of the mixture of Fe-minerals and silicate minerals [13] as well as the mixture of sulphide and silicate minerals [14]. These authors made their conclusions by analyzing only a few trans-vertical cuts embedded into new epoxy blocks, which does not ensure that a randomly-selected vertical section is an unbiased estimate of 3D map. For
that purpose, many trans-vertical cuts should be analyzed and evaluated together to strongly suggest that any vertical cross-section is unbiased. However, even the physical preparation of a single trans-vertical cut is tedious and time-consuming because of the complex routine of epoxy preparation, epoxy block cutting, grinding, and polishing stages.
This study offers a simple methodology including the x-ray CT imaging and the Random Forest classification for particle size and compositional analyses of many vertical cross-sections (such as Figure 1 and Figure 2). This methodology can be used to conclude if a randomly-selected vertical cross-section can be used as an unbiased estimate for the 3D map of particles. If particle size and compositional properties of ore particles can be predicted from vertical cross-sections without assuming any stereological error, this suggests that a randomly-selected vertical cross-section can be used as an unbiased estimate of 3D map. The unbiased vertical cross-sections can be used to predict the mineral composition and particle size distribution of widely-sized particles, which were shown to be biased when assessed from the polished sections [14]. This may promote the use of microscopic analyses over conventional ones (e.g. sieving analyses, XRF) to predict the size distribution and compositional properties (e.g. modal mineralogy, mineral liberation spectrum, etc.) of particulate samples in wide size distribution. For the purpose of this study, images of many vertical sections were reconstructed from the projections of the epoxy block of a widely-sized chromite sample under X-ray CT. All the images were successively evaluated with the Random Forest Classifier [18] and Watershed transform [19] to generate 2D mineral maps. Gray thresholding and Boolean operators were applied on 2D maps to determine the diameter and areal composition of each particle surface. Then, the equivalent-circle diameter and mass composition of each particle were predicted from the areal composition assuming no change in the shape and composition of surface throughout the volume of a particle (Section 3.1.5). Finally, the modal mineralogy and particle size distribution estimated from 2D maps were compared
Figure 2. A sample tomographic image showing the preferential setting of heavy chromite grains to a polished section in epoxy
USING RANDOM FOREST TREE CLASSIFICATION FOR EVALUATING VERTICAL CROSS… Politeknik Dergisi, 2021; 24 (1) : 113-120
115 with the same features predicted from chemical and sieving analyses, respectively. Additionally, 2D maps of the polished section were analyzed with the supervised classification method [16] to find supporting evidence for the preferential settling of heavier mineral grains.
2. EXPERIMENTAL MATERIAL
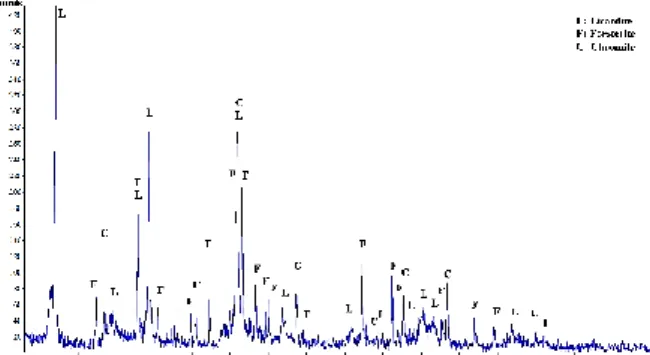
The experimental material was a chromite ore sample in a widely-sized fraction (-0.600 + 0.150 mm). The true mineral composition in the sample was measured with the Rigaku Ultima IV X-ray powder diffractometer (PXRD) with a Cu-Kα X-ray tube, operating at 40 kV and 30 mA. The resultant diffractogram was evaluated with the MATCH software to estimate the semi-quantitative mineral composition. The x-ray diffractogram of the sample (Figure 3) shows that the major minerals in the sample are chromite, forsterite (an olivine mineral) and lizardite (a serpentine mineral). XRD analyses also show that the chromite phase has the highest density of 4.8 g/cm3 while forsterite and lizardite phases have the
densities of 3.3 g/cm3 and 2.6 g/cm3, respectively.
Figure 3. The x-ray diffractogram of the experimental sample
Before 2D mineral mapping, approximately 2 g of the sample was poured into a cylindrical cup having a diameter of 3 cm, and a length of 2 cm. Then, the EPAKEM epoxy resin of 10 g was poured into the cup with the liquid EPAKEM hardener of 5 g. Then, the epoxy resin was kept at room conditions for 24 hours to slowly harden inside the cup. The density of the epoxy resin was about 1.10 g/cm3 being lower than the densities of chromite and silicate minerals. Therefore, all sample particles were expected to settle in the epoxy resin until the resin was hardened. Finally, the polished section was prepared by grinding and polishing the surfaces of particles settled to the bottom of the resin.
3. EXPERIMENTAL PROCEDURE
The experimental procedures for the construction of 2D mineral maps were briefly schematized in Figure 4. These procedures were also described in the following subsections.
Figure 4. The experimental procedures to acquire 2D maps
from the images of the polished section and the vertical cross-sections
3.1. Acquisition of the Images
Projections of the sample in the epoxy block were acquired at a rotation step of 0.35 degrees in the Skyscan1172 x-ray CT instrument. The instrument operated at a voltage of 100 kV and a current of 100 µA. Then, 599 vertical cross-sections (as shown in Figure 2) were reconstructed from all the x-ray projections through the NRecon software. Meanwhile, images of the particle surfaces on the polished section were acquired with the Wetzlar 21-D6330 ore microscope attached with the Cnscope 5 MP digital CMOS camera.
3.2. Pre-Processing the Images
This stage involves (i) manual extraction of particles from the background (epoxy) with blow/lasso tool embedded in Fiji-ImageJ software, and (ii) elimination of the noise and other artifacts on particle images with the adaptive Kuwahara [20] and Median [21] filters on Fiji-ImageJ. Since x-ray imaging is capable to eliminate noise and other artifacts on the tomographic slices, cross-sectional images were not processed before classification.
3.3. Evaluating Images in the Trainable Random Forest Classifier
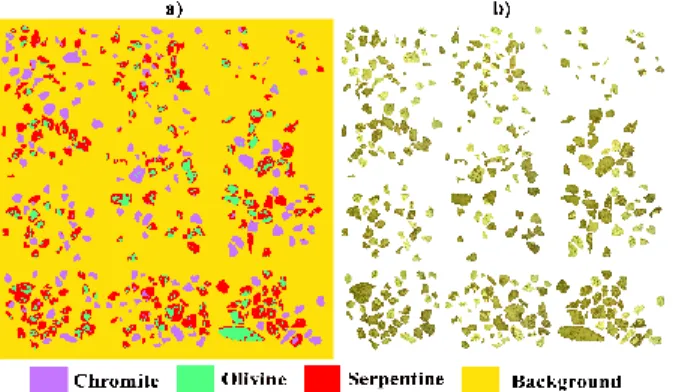
Random Forest Classification [18] was used to generate 2D maps from the microscopic and tomographic images. The method involved training random decision trees with sample images such that each tree could vote on a particular class for each pixel on the image. For each pixel, the classifier chose only one class which took most of the votes. Four classes (chromite, lizardite, olivine, and background) were predicted by the classifier as the x-ray diffractogram indicated no major phase other than chromite, lizardite and serpentine. The background class in the microscopic analysis included white null background after the manual extraction of particles from microscopic images (Section 3.1.2). However, the background class in tomographic images included the epoxy resin with trapped air bubbles and empty zones in the specimen holder. The training sample selection and classification were performed under Weka Segmentation Toolbox [22] embedded in the Fiji/ImageJ software. The training samples for microscopic images (Figure 5a) were selected from the chromite-rich and silicate-rich fractions of the sample (Figure 5b) that had been separated in bromoform. Therefore, the high accuracy of the classifier could be measured on the training images [23]. Meanwhile, the training samples for the tomographic images (Figure 6a) were selected by comparing the relative difference in brightness of objects
Mahmut CAMALAN, Mahmut ÇAVUR / POLİTEKNİK DERGİSİ, Politeknik Dergisi,2021;24(1): 113-120
on some of the tomographic images (Figure 6b). Figure 7a, accordingly, shows a fairly classified image of an example tomographic slice (Figure 7b) on which the brightness of chromite grains was well distinguished.
Figure 5. The training sample images of minerals and
background (a) from the surfaces of chromite and silicate-rich sample fractions (b) for the classification of microscopic images. The images are not scaled.
Figure 6. The training sample images of minerals and
background (a) from a vertical cross-sectional image (b) of sample particles.
Figure 7. The classified image (a) of a vertical cross-sectional
image (b) of the sample particles.
3.4. Post-Processing the 2D Maps of Particles
The post-processing stage for the microscopic images included the application of the Kuwahara [20] and Median [21] filters to remove the residual noise and artifacts on the 2D maps. The final 2D map (Figure 8a) after the post-processing of an example image of a polished section (Figure 8b) was provided for a fair
assessment of the classification accuracy on microscopic images. On the other hand, only Watershed transform [19] was applied to the tomographic images to separate close objects (Figure 9a) connected by the classifier erroneously (Figure 9b) when they were close in a raw cross-sectional image (Figure 9c). Areal mineral composition and diameter of each particle on 2D maps were calculated with the gray thresholding tool and Boolean operators in the Clemex software.
Figure 8. The final 2D map (a) after post-processing the
classified image of an example polished section (b). The images are not scaled.
Figure 9. The final 2D map (a) after Watershed transform on
the classified image (b) of a vertical cross-sectional image (c). The images are not scaled.
3.5. Stereological Conversion from 2D to 3D Maps
Each 2D map was converted to a 3D map based on the assumption that the shape and mineral composition of a cross-sectional particle surface does not change throughout the volume of the particle. The assumption may not be consistent with the physical nature of particles. However, it can be used hypothetically to predict the relative masses of particles if there is no stereological error. Based on the above assumption, the volume of each mineral grain in a particle was calculated with the following equation:
𝑉𝑛,𝑖(𝑚3) = 𝐴𝑛,𝑖(𝑚2) ∗ 1 ( m3
m2) (1)
The subscript n is a numerical label assigned to each mineral in the sample, Vn,i and An,i is the volume and area
of mineral n in particle i, respectively. The unity on the RHS of Eq. 1 is a dummy value to convert An,i to Vn,i.
USING RANDOM FOREST TREE CLASSIFICATION FOR EVALUATING VERTICAL CROSS… Politeknik Dergisi, 2021; 24 (1) : 113-120 117 𝑚𝑛,𝑖= 𝑉𝑛,𝑖(𝑚3) ∗ 𝜌 𝑛 ( 𝑘𝑔 𝑚3) (2)
where mn,i is the mass of mineral n in particle i and ρn is
the density of mineral ‘n’. Then, the relative mass of particle i is calculated by summing the masses of all mineral grains:
𝑚𝑖= ∑ 𝑚𝑛 𝑛,𝑖 (3) Eqs. 2 and 3 were finally used to get estimates for the
mineral composition and relative mass of each particle in a 3D map after the stereological conversion.
4. RESULTS AND DISCUSSION 4.1. Modal Mineralogy
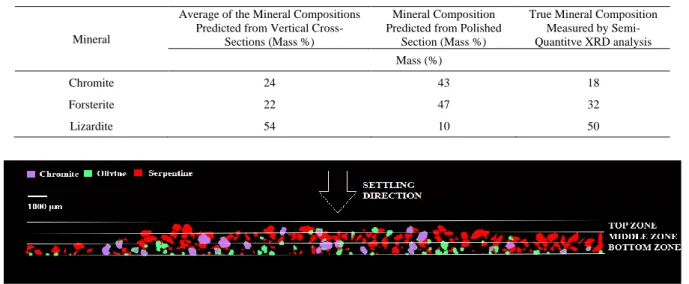
Table 1 demonstrates (i) the average of the mass-based mineral compositions predicted from the vertical cross-sections, (ii) the mineral composition predicted from the polished section, and (iii) the true mineral composition of the sample measured by the semi-quantitative XRD analysis. The table suggests that the average of the mineral compositions predicted from the vertical sections are in fair agreement with the true mineral composition. This result would initially suggest no preferential mineral distribution throughout the vertical sections. However, Table 1 shows higher chromite and forsterite content at the polished sections than their true contents in the sample, indicating preferential settling of chromite and forsterite grains to the epoxy bottom (as shown in Figure 2). If the dense mineral grains preferentially settle to the bottom, they must not exist at the upper parts of the epoxy. Then, all mineral grains in the sample have to be
distributed unevenly throughout a vertical cross-section. In other words, any vertical sub-section along the settling direction will be a biased estimate of the 3D map. Therefore, the whole section should be analyzed to obtain
an unbiased estimate of the 3D map. Meanwhile, the discrepancy between the average mineral composition of the vertical cross-sections and the true composition in Table 1 may arise because of (i) the classification errors, (ii) the inadequacy of the stereological conversion method (Section 3.1.5) or (iii) the measurement errors in XRD analysis.
To understand how the mineral grains distribute in the epoxy, 2D maps predicted from each vertical cross-section (as demonstrated in Figure 2) were roughly divided into three sub-sections that were approximately 0.6 mm in width and 30 mm in length (Figure 10). These sub-sections included (i) bottom zones (including polished section) corresponding to the deepest settling positions, (ii) top zones corresponding to the shallowest settling positions, and (iii) middle zones in between the top and bottom zones. Then, the mineral compositions in the bottom, top and middle zones of each slice were plotted in Figure 11. The figure shows that minerals are unevenly distributed to the three zones. Chromite and forsterite rarely exist in the top zone (Figure 11a-1 and Figure 11b-1); thus, the top zone mainly includes lizardite (Figure 11c-1). As lizardite progressively diminishes (Figure 11c-1 through Figure 11c-3) from the top to the bottom zones, chromite (Figure 11a-1 through Figure 11a-3) and forsterite content (Figure 11b-1 through Figure 11b-3) escalate from the top to the bottom. These results are consistent with Table 1, showing that minerals are not distributed evenly in the epoxy, i.e. chromite and forsterite grains preferentially settle to the bottom. Therefore, 3D maps predicted from the polished section should be biased estimates
overestimating the heavy mineral content. Figure 11 also suggests that the mineral compositions in the middle and bottom zones of the vertical sections will change gradually if the vertical sections move laterally from the
Table 1. The average mineral composition of the vertical cross-sections, the mineral composition of the polished section, and
the true composition measured by semi-quantitative XRD analysis
Mineral
Average of the Mineral Compositions Predicted from Vertical
Cross-Sections (Mass %)
Mineral Composition Predicted from Polished
Section (Mass %)
True Mineral Composition Measured by Semi-Quantitve XRD analysis Mass (%) Chromite 24 43 18 Forsterite 22 47 32 Lizardite 54 10 50
Mahmut CAMALAN, Mahmut ÇAVUR / POLİTEKNİK DERGİSİ, Politeknik Dergisi,2021;24(1): 113-120
edges to the center of the epoxy block. Despite the lack of relevant data, we suspect that the circular mixing of the resin-sample mixture (as done in this study) may
cause uneven distribution of minerals to the center and the edges of the epoxy. Although Donskoi et al. [13] showed that this mixing pattern results in an identical composition of iron minerals at the edges and the center, they still recommended the use of an “eight-shape” mixing pattern instead of circular mixing. Meanwhile, the lateral compositional changes in the top zones seem to have the zigzag pattern (Figure 11a-1, Figure 11b-1, and Figure 11c-1), indicating that the mineral compositions fluctuate randomly. In fact, no significant deviation is expected along the lateral compositions in the top zones where lizardite is the major mineral.
All the above results suggest that either a sub-lateral or a sub-vertical section will give biased estimates of the 3D particle map because of the uneven distribution of
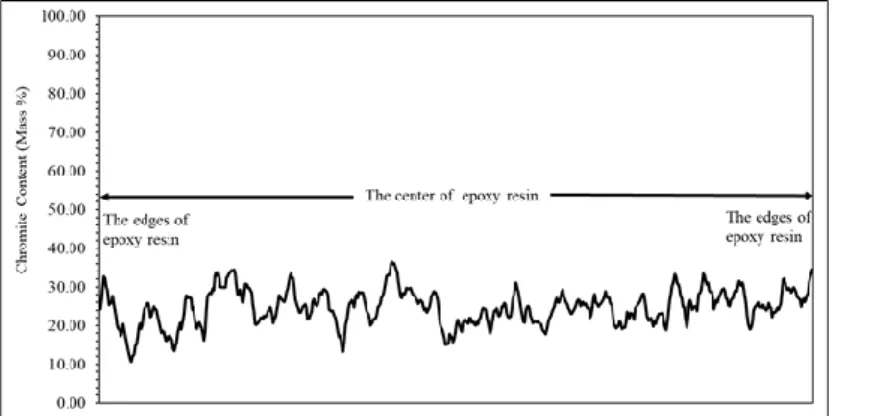
minerals by the mixing pattern or preferential settling of dense minerals. To achieve an unbiased estimate of the 3D map, we recommend the use of the vertical cross-sections that cover the whole lateral span of the epoxy block (as given in Figure 1). To validate whether such cross-sections are biased or not, the overall mineral compositions predicted from these CT cross-sections were plotted in Figure 12. This figure shows a zigzag pattern suggesting no systematic variation or bias between the mineral compositions of the proposed cross-sections.
Figure 11. The mass percent of chromite (a), forsterite (b), and lizardite (c) in the top (1), the middle (2), and the bottom (3)
zones of all vertical cross-sections.
Figure 12. The fluctuation of chromite content (mass %) along the vertical cross-sections that cover the whole lateral span of
USING RANDOM FOREST TREE CLASSIFICATION FOR EVALUATING VERTICAL CROSS… Politeknik Dergisi, 2021; 24 (1) : 113-120
119
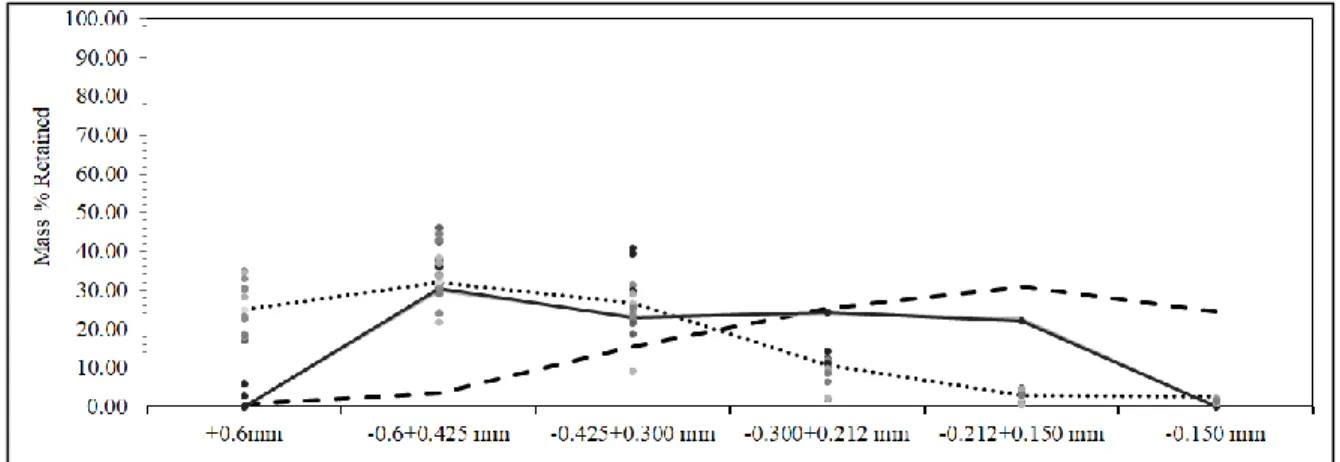
4.2. Particle Size Distribution
Figure 13 yields the discrete particle size distributions predicted from 2D maps of some vertical cross-sections and polished-sections, as well as the size distribution measured by dry screening on the sample. The figure shows that the distributions from the cross-sections have similar shapes to the size distribution of dry sieving analysis, expect at the sizes coarser than 0.600 mm and the sizes finer than 0.212 mm. Although the size fraction of +0.6 mm is non-existent in the particulate sample, it significantly appears in the cross-sections. On the other hand, the size fraction of -0.212 mm does not exist at the classified images of CT cross-sections although it appears in the dry sieving. The above discrepancies may appear at the same time because the watershed transform (Section 3.1.3) is not yet successful to separate some of the close particles erroneously connected by the Random forest. Meanwhile, Figure 13 shows that the size distribution predicted from the polished section is significantly finer than the size distribution given by the dry screening analysis. Even the distribution predicted from the polished section shows a high abundance of -0.150 mm particles non-existent in the particulate sample. This anomaly cannot simply arise because of the erroneous connection of close particles in the 2D map as the surface images are manually extracted before classification (Section 3.2). Therefore, the finer size distribution predicted from the polished section should represent the chromite grains that preferentially settle to the bottom of the epoxy block.
5. CONCLUSIONS AND RECOMMENDATIONS
Although 2D maps of polished sections were commonly used to predict the particle size distribution and modal mineralogy of particulate samples, these predictions might be inconsistent with the conventional analyses. The inconsistency arises because of the preferential settling of heavy minerals to the polished section, making it a biased estimate of the 3D mineral map. So, this
problem encouraged us to find suitable cross-sections onto which no minerals are preferentially distributed. Then, many X-ray CT slices of vertical cross-sections were evaluated with the Random Forest classification to assess whether modal mineralogy and particle size distributions predicted from vertical sections were consistent with the relevant chemical and sieving analyses, respectively. The outcomes of this study were briefly presented below:
Microscopic analyses on the polished section reveal that heavier mineral grains preferentially settle to the polished section. On the other hand, the cross-sections taken perpendicular to the polished section are unbiased. These vertical cross-sections will give 2D maps from which modal mineralogy and particle size distribution of the chromite ore sample can be correctly estimated without assuming stereological errors. The use of vertical cross-sections may promote the use of microscopic analyses over conventional ones to predict the size, composition, and possibly the liberation characteristics of particulate samples with a wide size distribution.
We also recommend that the epoxy blocks used in the microscopic analyses should have a shape such that a significant portion of the total block face should be oriented along the settling direction. We suggest that such ideal blocks can be either cubical or rectangular. Grant et al. [24] already designed such rectangular prism-shaped blocks to expose vertical sections for MLA analyses.
ACKNOWLEDGMENTS
We would like to acknowledge the BIOMATEN research facility for providing the X-ray CT used in this study. We also acknowledge the Mining Engineering Department of the Middle East Technical University for providing the optical microscope used in this study. This work was partially supported by the BAP institutional fund of the Middle East Technical University [grant number BAP-07-02-2014-007-466].
Figure 13. The discrete size distributions predicted from the 2D maps of some vertical cross-sections (circles), the polished
section (dashed line), and the size distribution given by dry screening (solid line). The dotted line demonstrates a general trend of the discrete sizedistributions in the vertical cross-sections.
Mahmut CAMALAN, Mahmut ÇAVUR / POLİTEKNİK DERGİSİ, Politeknik Dergisi,2021;24(1): 113-120
DECLARATION OF ETHICAL STANDARDS
The author(s) of this article declare that the materials and methods used in this study do not require ethical committee permission and/or legal-special permission.
REFERENCES
[1] Chatterjee S., Bandopadhyay S. and Machuca D., "Ore grade prediction using a genetic algorithm and clustering Based ensemble neural network model", Mathematical
Geosciences, 42: 309-326, (2010).
[2] Köse C., Alp I. and İkibaş C., "Statistical methods for segmentation and quantification of minerals in ore microscopy", Minerals Engineering, 30: 19-32, (2012). [3] Mengko T.R., Susilowati Y., Mengko R. and Leksono
B.E., "Digital image processing technique in rock forming minerals identification", IEEE APCCAS 2000.
2000 IEEE Asia-Pacific Conf. Circuits Syst. Electron. Commun. Syst. (Cat. No.00EX394), Tianjin, 441-444,
(2000).
[4] Perez C.A., Estévez P.A., Vera P.A., Castillo L.E., Aravena C.M., Schulz D.A. and Medina L.E., "Ore grade estimation by feature selection and voting using boundary detection in digital image analysis", International
Journal of Mineral Processing, 101: 28-36, (2011).
[5] Singh N., Singh T., Tiwary A. and Sarkar K., "Textural identification of basaltic rock mass using image processing and neural network", Computational
Geosciences, 14: 301-310, (2010).
[6] Singh V. and Rao S.M., "Application of image processing in mineral industry: a case study of ferruginous manganese ores", Mineral Processing and Extractive
Metallurgy (Trans. Inst. Min Met. C), 115: 155-160,
(2006).
[7] Wang W., "Rock particle image segmentation and systems", Pattern Recognition Techniques Technology and Applications, In-Teh, Crotia, (2008).
[8] King R.P., "Modeling and Simulation of Mineral Processing Systems", Butterworth-Heinemann, Oxford, (2001).
[9] Leigh G.M., Lyman G.J. and Gottlieb P., "Stereological estimates of liberation from mineral section measurements: A rederivation of Barbery’s formulae with extensions", Powder Technology, 87: 141-152 (1996).
[10] Petruk W., "Applied Mineralogy in the Mining Industry",
Elsevier, Ottawa, (2000).
[11] Schneider C.L., "Measurement and calculation of liberation in continuous milling circuit", PhD Dissertation, The University of Utah, (1995).
[12] Wightman E.M. and Evans C.L., "Representing and interpreting the liberation spectrum in a processing context", Minerals Engineering, 61: 121-125, (2014). [13] Donskoi E., Raynlyn T.D. and Poliakov A., "Image
analysis estimation of iron ore particle segregation in epoxy blocks", Minerals Engineering, 120: 102-109, (2018).
[14] Kwitko-Ribeiro R., "New Sample Preparation Developments to Minimize Mineral Segregation in Process Mineralogy", Proceedings of 10th International
Congress on Applied Mineralogy, Trondheim, 411-417,
(2012).
[15] Lane G.R., Martin C. and Pirard E., "Techniques and applications for predictive metallurgy and ore characterization using optical image analysis", Minerals
Engineering, 21: 568-577, (2008).
[16] Camalan M., Çavur M. and Hoşten Ç., "Assessment of chromite liberation spectrum on microscopic images by means of a supervised image classification", Powder
Technology, 322: 214-225, (2017).
[17] Lätti D. and Adair B.J.I., "An assessment of stereological adjustment procedures", Minerals Engineering, 14: 1579-1587, (2001).
[18] Breiman L., "Random forests", Machine Learning, 45: 5-32, (2001).
[19] Soille P. and Vincent L.M., "Determining watersheds in digital pictures via flooding simulations", SPIE Visual
Communications and Image Processing ’90, 240-250,
(1990).
[20] Bartyzel K., "Adaptive Kuwahara filter", Signal, Image
and Video Processing, 10: 663-670, (2016).
[21] Khorram F., Memarian H. and Tokhmechi B., "Limestone chemical components estimation using image processing and pattern recognition techniques", Journal
of Mining & Environment, 2: 126-135, (2011).
[22] Arganda-Carreras I., Kaynig V., Rueden C., Eliceiri K.W., Schindelin J., Cardona A. and Seung H.S., "Trainable Weka Segmentation: A machine learning tool for microscopy pixel classification", Bioinformatics. 33: 2424-2426, (2017).
[23] Camalan M., Çavur M. and Hoşten Ç., "Assessment of chromite liberation spectrum on microscopic images by means of a supervised image classification", Powder
Technology, 322: 214-225, (2017).
[24] Grant D.C., Goudie D.J., Shaffer M. and Sylvester P., "A single-step trans-vertical epoxy preparation method for maximising throughput of iron-ore samples via SEM-MLA analysis", Transactions of the Institutions of
Mining and Metallurgy, Section B: Applied Earth Science, 125: 57-62, (2016).