INFORMATION
a thesis
submitted to the department of computer engineering
and the graduate school of engineering and science
of bilkent university
in partial fulfillment of the requirements
for the degree of
master of science
By
Sel¸cuk Onur S¨
umer
I certify that I have read this thesis and that in my opinion it is fully adequate, in scope and in quality, as a thesis for the degree of Master of Science.
Assoc. Prof. Dr. U˘gur Do˘grus¨oz(Advisor)
I certify that I have read this thesis and that in my opinion it is fully adequate, in scope and in quality, as a thesis for the degree of Master of Science.
Assist. Prof. Dr. Ali Aydın Sel¸cuk
I certify that I have read this thesis and that in my opinion it is fully adequate, in scope and in quality, as a thesis for the degree of Master of Science.
Assoc. Prof. Dr. Tolga Can
Approved for the Graduate School of Engineering and Science:
Prof. Dr. Levent Onural Director of the Graduate School
CUSTOMIZABLE VISUALIZATION OF RELATIONAL
INFORMATION
Sel¸cuk Onur S¨umer M.S. in Computer Engineering
Supervisor: Assoc. Prof. Dr. U˘gur Do˘grus¨oz March, 2012
Graphs are widely used to represent complex relational information. Graph visu-alization is crucial for effective analysis of information. In simple graphs, nodes are generally considered as uniform-sized components and they cannot be nested. This is often not sufficient to visualize complex relationships, because relational information is often clustered or hierarchically organized into groups or nested structures.
There exist many free, open source software in the field of web-based graph visualization. However, none fully supports compound or clustered graphs. More-over, customization provided by such software is often limited to the basic visual properties of nodes and edges. It requires a lot of effort to build an advanced cus-tomization of visual properties and interactive functionality with these software. In this thesis, we introduce a free, open source, general-purpose, web-based graph visualization framework, named Chisio Web (ChiWeb). ChiWeb supports visualization, interactive editing and layout of both simple and compound graphs. ChiWeb is implemented in ActionScript language and based on Flare, which is an open source ActionScript library designed for data visualization.
ChiWeb is specifically designed for easy customization with respect to visu-alization and functionality. ChiWeb can be used as a library to create a custom graph visualization with an advanced application behavior for particular needs of a specific domain. The elements and functionality that can be easily cus-tomized with ChiWeb are: visual styles, controls for interactive events such as node creation, key and mouse functionality, context menus, toolbars, and inspec-tor windows. Furthermore, ChiWeb’s architecture allows easy integration of new graph layout algorithms.
iv
Keywords: graph visualization, interactive graph editing, customizable software, compound graphs, relational information.
G ¨
ORSELLES
¸T˙IR˙ILMES˙I ˙IC
¸ ˙IN WEB-TABANLI B˙IR
C
¸ ERC
¸ EVE
Sel¸cuk Onur S¨umer
Bilgisayar M¨uhendisli˘gi, Y¨uksek Lisans Tez Y¨oneticisi: Do¸cent Dr. U˘gur Do˘grus¨oz
Mart, 2012
C¸ izgeler, karma¸sık ili¸skisel bilgilerin g¨osteriminde sıklıkla kullanılmaktadır. C¸ izge g¨orselle¸stirmesi, bilginin etkin bir ¸sekilde analizinde olduk¸ca ¨onemlidir. Basit ¸cizgelerde, k¨o¸seler genelde aynı b¨uy¨ukl¨ukte kabul edilir ve i¸c i¸ce ge¸cemezler. Bu durum, genellikle karma¸sık ili¸skilerin g¨orselle¸stirilmesinde yeterli de˘gildir, ¸c¨unk¨u ili¸skisel bilgi genelde k¨umelenmi¸s ya da gruplar veya i¸c i¸ce ge¸cmi¸s yapılar ¸seklinde hiyerar¸sik olarak d¨uzenlenmi¸stir.
Web-tabanlı ¸cizge g¨orselle¸stirme alanında, ¨ucretsiz, a¸cık kaynak bir ¸cok yazılım bulunmaktadır. Ancak, bunların hi¸cbiri bile¸sik ya da k¨umelenmi¸s ¸cizgeleri tam olarak desteklememektedir. ¨Ustelik, bu yazılımların uyarlanabilirli˘gi, genelde k¨o¸se ve kenarların temel g¨orsel ¨ozellikleriyle sınırlıdır. Bu yazılımlarla, g¨orsel ¨
ozellikler ve etkile¸simsel i¸slevsellik a¸cısından geli¸smi¸s bir uyarlama yapmak ¸cok fazla emek istemektedir.
Bu tezde, Chisio Web (ChiWeb) adında, genel ama¸clı, web-tabanlı, ¨ucretsiz ve a¸cık kaynak bir ¸cizge g¨orselle¸stirme uygulama ¸catısı sunuyoruz. ChiWeb, hem basit hem de bile¸sik ¸cizgelerin g¨orselle¸stirilmesine, yerle¸stirilmesine ve etkile¸simli olarak d¨uzenlenmesine olanak sa˘glamaktadır. ChiWeb, ActionScript program-lama diliyle ger¸cekle¸stirilmi¸stir ve Flare adında a¸cık kaynak bir ActionScript k¨ut¨uphanesini temel almı¸stır.
ChiWeb g¨orselle¸stirme ve i¸slevsellik y¨on¨unden kolay uyarlanabilir olması i¸cin ¨
ozel olarak tasarlanmı¸stır. ChiWeb k¨ut¨uphanesi, belirli bir alana ¨ozg¨u ihtiya¸clar do˘grultusunda ¨ozelle¸smi¸s bir g¨orselle¸stirme ve geli¸smi¸s bir uygulama i¸slevselli˘gi yaratmak i¸cin kullanılabilir. G¨orsel bi¸cimler, k¨o¸se yaratmak gibi etkile¸simli eylemler i¸cin denetimler, klavye ve fare i¸slevselli˘gi, men¨uler, ara¸c ¸cubukları ve
vi
denetim pencereleri, ChiWeb ile kolayca ¨ozelle¸stirilebilecek i¸slevsellik ve ¨o˘geler arasındadır. Bunun yanı sıra, ChiWeb’in mimarisi yeni yerle¸stirme algorit-malarının kolaylıkla eklenmesine izin verecek yapıdadır.
Anahtar s¨ozc¨ukler : ¸cizge g¨orselle¸stirme, etkile¸simli ¸cizge d¨uzenleme, uyarlanabilir yazılım, bile¸sik ¸cizgeler, ili¸skisel bilgi.
I would like to express my gratitude to my supervisor Assoc. Prof. Dr. U˘gur Do˘grus¨oz for his guidance and advices during the development of this thesis. It was a unique experience to work with him. I have learned so much from him during my graduate study.
I would like to thank to Assist. Prof. Dr. Ali Aydın Sel¸cuk and Assoc. Prof. Dr. Tolga Can for reviewing and commenting on the manuscript of this thesis.
Thanks to Alper Kara¸celik and other members of the i-Vis Research Group of Bilkent University. It was a privilege to be part of such a talented team. Also, thanks to Ethan Cerami and the Sander Research Group of MSKCC for giving me a chance to participate in the cancer genomics research.
Special thanks to Salim Arslan, for his contribution to the graphical compo-nent design of the ChiWeb project.
Last but not least, I would like to thank my parents Sadiye and Erkan for their endless love and patience. I would not be able to complete this thesis without their support.
Contents
1 Introduction 1 1.1 Motivation . . . 3 1.2 Results . . . 4 2 Background 7 2.1 Graphs . . . 7 2.2 Graph Visualization . . . 9 2.3 Flare . . . 10 2.3.1 Overview of Flare . . . 10 2.3.2 Data Representation . . . 11 2.3.3 Data Sprites . . . 11 2.3.4 Renderers . . . 13 2.3.5 Visualization . . . 13 2.4 Chisio . . . 15 3 Related Work 18 viii3.1 Cytoscape Web . . . 20
3.2 Tom Sawyer Visualization . . . 21
3.3 Asterisq . . . 22
3.4 VisANT . . . 24
3.5 WiGis . . . 26
4 ChiWeb Architecture 27 4.1 ChiWeb Model . . . 27
4.2 Renderers and UIs . . . 30
4.3 Visualization and Management of the Graph . . . 33
4.4 Visual Style Management . . . 35
4.5 Controls . . . 39 4.5.1 ClickControl . . . 41 4.5.2 SelectControl . . . 43 4.5.3 MultiDragControl . . . 45 4.5.4 KeyControl . . . 47 4.5.5 ResizeControl . . . 47 4.5.6 PanControl . . . 47 4.5.7 ZoomControl . . . 48 4.6 Operators . . . 48 4.7 Persistency . . . 50
CONTENTS x
4.8 Events . . . 52
4.9 Utility Classes . . . 53
5 Customizing ChiWeb 55 5.1 Introducing New Node and Edge Types . . . 55
5.1.1 Custom Nodes . . . 55
5.1.2 Custom Edges . . . 58
5.2 Customizing Functionality and Behavior . . . 60
5.2.1 Controlling Node and Edge Creation . . . 60
5.2.2 Customizing Key and Mouse Behavior . . . 64
5.2.3 An Advanced Control Over The Mouse Behavior . . . 66
5.3 Custom Layout Styles . . . 70
5.4 Customizing GUI . . . 73
5.4.1 Customizing Menus . . . 74
5.4.2 A Customized Tool Bar . . . 75
5.4.3 Custom Panels . . . 77
6 ChiWeb Implementation 79 6.1 Compound Graph Support . . . 79
6.2 Bend Points for Edges . . . 82
7.1 Contribution . . . 86 7.2 Future Work . . . 87
List of Figures
1.1 Textual representation of a biological pathway (PKA-mediated
phosphorylation of CREB) in PathwayCommons [29] . . . 2
1.2 Visualization of a biological pathway (PKA-mediated phosphory-lation of CREB) with a simple graph structure in Cytoscape [12] . 2 1.3 Visualization of a biological pathway (PKA-mediated phospho-rylation of CREB) with a compound graph structure in Chisio BioPAX Editor [5] . . . 3
2.1 A compound graph C with multiple levels of nesting . . . 8
2.2 A random layout (left) and a force directed layout (right) for the same graph . . . 9
2.3 Overview of data visualization in Flare . . . 11
2.4 Data representation, data sprites and renderers in Flare . . . 12
2.5 Visualization architecture of Flare . . . 14
2.6 Overview of main Chisio parts . . . . 15
2.7 A sample XML that conforms to ChiLay’s XML schema . . . 17
3.1 Compound Graph Visualization in Cytoscape Web . . . 20 xii
3.2 Layers of CytoscapeWeb . . . 21
3.3 A sample application built on the web edition of TSV . . . 22
3.4 A sample view from the demo version of Constellation Roamer (Asterisq) . . . 23
3.5 A custom node renderer for Constellation Custom that displays a plus sign when it has neighbors that are not being displayed . . . 24
3.6 Visualization of a sample network in VisANT with nested node groups . . . 25
4.1 An example graph with 3 simple nodes (n2, n3, n4), one compound node (c1), one regular edge (e1) with a simple target arrow, and one edge (e2) with 2 bend points and 3 segments . . . 28
4.2 Graph model and data representation in ChiWeb . . . 29
4.3 Renderer and User Interface (UI) classes for data sprites . . . 31
4.4 Graph management and visualization . . . 34
4.5 Adding a node into a data group of selected nodes . . . 37
4.6 Removing an existing group from graph data . . . 37
4.7 Adding a style specific to the data group of compound nodes . . . 38
4.8 Changing a visual style specified for edges by adding a new property 38 4.9 Event control classes . . . 40
4.10 Adding a new node into the graph canvas . . . 41
4.11 Adding an edge between two existing nodes . . . 42
LIST OF FIGURES xiv
4.13 Selecting multiple graph elements . . . 44
4.14 Dragging a compound node together with other selected nodes . . 46
4.15 Operators introduced by ChiWeb . . . 49
4.16 Persistency support of ChiWeb . . . 50
4.17 Event classes introduced by ChiWeb . . . 53
4.18 Utility classes provided by ChiWeb . . . 54
5.1 An example UI customization with a compound node (n1), a node with gradient coloring (n2), two circular nodes (n3, n4), a node containing an image (n5), and two dashed edges (e2, e3) . . . 58
5.2 Animation of the preview edge during edge creation process . . . 62
5.3 An inspector window to display node information . . . 66
5.4 Selecting a rectangular area on the canvas to perform marquee zoom 67 5.5 Canvas view after performing marquee zoom on a selected area . . 69
5.6 Custom layout design for remote use of ChiLay . . . 70
5.7 A sample application with a customized menu bar . . . 75
5.8 A sample tool bar with custom buttons and combo boxes . . . 77
6.1 A sample graph with a compound node (n1) with 2 direct children (n2 and n3), 2 indirect children (n4 and n5), and 3 inner bends (one on e1, and two on e2) . . . 81
6.2 Visualization of the sample graph in Figure 6.1 after dragging the selected nodes n2 and n4 . . . 82
6.3 An edge with no bend point (left) and the same edge after adding two bend points (right) . . . 83 6.4 While selecting any segment of the segmented edge in Figure 6.3
yields selection of all segments (left), an arbitrary bendpoint can be selected separately (right) . . . 84 6.5 Different positions for the same edge label: next to source node
List of Tables
3.1 ChiWeb compared to the popular web-based graph visualization software . . . 19
Introduction
A graph is a collection of nodes (or vertices) and edges where a node (or a vertex) is an abstract representation of an object and an edge is a link between a node pair. A compound graph is an extended form of a simple graph. In a compound graph, a node can contain other nodes and edges, hence it is possible to construct nested structures with a compound graph. However, nodes cannot be nested within each other in simple graphs.
Graphs are widely used to represent complex relational information. This allows topological and functional analysis of complex networks by using graph theory concepts [6, 24, 11], and helps calculation or prediction of structural and dynamic properties defined by these networks. Since relational information is often clustered or hierarchically organized into nested structures, it is more ap-propriate to represent relational information with compound graphs.
It is a fast and easy way to represent information textually, but it is often hard to understand and analyze textual information (Figure 1.1). Information visualization plays a critical role in understanding of any kind of information. Visualization allows us to explore, observe, and understand large amounts of information at one sight, since it takes advantage of human eye’s broad bandwidth pathway [26].
CHAPTER 1. INTRODUCTION 2
Figure 1.1: Textual representation of a biological pathway (PKA-mediated phos-phorylation of CREB) in PathwayCommons [29]
Figure 1.2: Visualization of a biological pathway (PKA-mediated phosphorylation of CREB) with a simple graph structure in Cytoscape [12]
Simple graph visualization is a powerful method that is widely used to repre-sent information (Figure 1.2). However, in most cases, it is inadequate for a full comprehension of complex relational information. Compound graph visualiza-tion, on the other hand, is a more capable way of representing complex relational information (Figure 1.3).
Figure 1.3: Visualization of a biological pathway (PKA-mediated phosphorylation of CREB) with a compound graph structure in Chisio BioPAX Editor [5]
1.1
Motivation
Many graph visualization software have been developed within last two decades. While some of them are domain-specific [14, 25, 28, 35], there are also some general purpose graph visualization tools [2, 9, 12, 13, 20, 22, 23, 32, 33]. However, only a few of them support compound or clustered structures [9, 14, 32, 35], and none of the free, web-based software fully supports visualization and layout of compound graphs.
Web-based software are platform independent, and do not require end-users to install or update any software other than a web browser. Since it is easier to access and use, a web-based software can even reach an end-user with a limited
CHAPTER 1. INTRODUCTION 4
experience and knowledge in computers. Because of those advantages of web-based software, web-web-based software development have become more popular.
Easy customization is an important aspect of a graph visualization tool. A web-based graph visualization software with an effective customization mecha-nism should enable defining of arbitrary node and edge user interfaces (UIs). It should provide a way to customize functionality of the software with respect to interactive actions such as click, double-click, and hover. Easy integration of additional layout algorithms is also crucial for a customized graph visualization. Location and content of the drawing canvas, inspectors, and menus should also be customizable.
There are some web-based graph visualization tools [2, 13, 32, 35] that en-able customization. However, only a few of them [13, 35] are open source and customization provided by these tools are limited to the basic visual properties of nodes and edges such as shape, size, color, and transparency. Advanced cus-tomization of visual properties and interactive functionality require a lot of effort with the existing general purpose, free, web-based software.
1.2
Results
Motivated to satisfy the requirement of a sophisticated software in the field of interactive visualization of relational data, a new project, called Chisio Web (Chi-Web), was initiated to develop a free, open source, general purpose, web-based graph visualization and editing framework. ChiWeb is implemented in Action-Script [1] and it requires installation of Flash Player [18], which is a light-weight plug-in available for almost all modern web browsers. ChiWeb is part of the Chi-sio project and the complete source code of the ChiWeb library together with a sample application demonstrating its usage can be accessed through the project’s publicly available source code repository [10].
ChiWeb fills an important gap for compound graphs in the field of web-based graph visualization. With its compound graph support, ChiWeb is capable of
visualization and interactive editing of graphs with compound nodes. ChiWeb’s compound graph support is also adapted to Cytoscape Web [13] which is another web-based graph visualization tool that has been previously supporting only sim-ple graphs. Considering that Cytoscape Web is a widely used graph visualization software, this extension is another success for web-based compound graph visu-alization.
ChiWeb is designed for easy customization and provides various mechanisms to customize the visualization of the graph as well as the interaction control of the application. One can easily customize ChiWeb for particular needs of a domain-specific application. ChiWeb’s easy customization support fills another important gap in the field of web-based graph visualization. Some of the elements and functionality that can be easily customized with ChiWeb can be listed as:
• Visual styles: Visual properties of nodes and edges such as shape, width, height, color, and opacity can be customized by defining visual styles. It is possible to define shared visual styles for certain groups of nodes or edges. • Node and edge user interfaces (UI): By defining custom user interfaces it is
possible to render nodes and edges in any desired form.
• Functionality and behavior: With its control customization mechanism, ChiWeb enables introducing advanced control over node and edge creation, and custom behavior for interactive actions such as drag, selection, and zoom. It is also easy to define custom behavior for basic mouse events such as click, double-click, and hover as well as basic key events such as key press, and key release.
• Graphical user interface (GUI) elements: GUI elements such as context menus, tool bars, buttons, input fields, and inspector windows can be cus-tomized with respect to their content, appearance, and layout.
The remainder of this thesis is organized as follows: Chapter 2 gives back-ground information on graphs and graph visualization, and also introduces the base software on which ChiWeb is built. Chapter 3 compares ChiWeb to the other
CHAPTER 1. INTRODUCTION 6
web-based graph visualization software. Chapter 4 explains software architecture of ChiWeb in detail. Chapter 5 illustrates customization of ChiWeb with sample implementations. Chapter 6 provides implementation details of important com-ponents. Finally, Chapter 7 concludes the thesis and discusses possible future improvements for ChiWeb.
Background
2.1
Graphs
A simple graph G = (V, E) is a pair of sets V and E where V is a set of nodes (or vertices) and E is a set of edges.
An edge e ∈ E is a node pair {u, v} where u ∈ V and v ∈ V . u and v are endpoints of an edge where u is its source and v is its target. An edge joins its endpoints.
A node v is incident with an edge e, if v ∈ e. A node u is adjacent to a node v, if there exists an edge e, where u ∈ e and v ∈ e. Two adjacent nodes are called neighbors. The degree of a node v is the number of its incident edges.
In a directed graph, an edge has a direction from its source to its target. In an undirected graph, on the other hand, there is no sense of direction for edges.
An edge is called a loop (or self ) edge if both of its endpoints u and v are the same. Multiple edges are edges between the same source u and the same target v.
In a compound (or nested ) graph, a node c may include other nodes and edges.
CHAPTER 2. BACKGROUND 8
Such a node is called a compound node. Every node v inside a compound node c is a child of c, and c is the parent of every node inside c. A child node inside a compound node c may also be a compound node. Therefore, it is possible to define compound graphs with multiple levels of nesting (Figure 2.1).
Figure 2.1: A compound graph C with multiple levels of nesting
More formally, a compound graph C = (V, E, F ) consists of sets V , E and F where V is a set of nodes, E is a set of adjacency edges and F is a set of inclusion edges [16]. While definition of an adjacency edge is the same as definition of an edge in a simple graph, an inclusion edge is to indicate a nesting relationship between two nodes. For the example compound graph C in Figure 2.1:
V = {a,b,c,d,e,f,g,h,m,n},
E = {{a,b},{c,g},{d,m},{e,f},{g,h},{m,n}}, and F = {ac,ag,ah,bm,bn,ce,cf}.
An adjacency edge between two nodes of same nesting level is called an intra-graph edge. An edge between two nodes of different nesting level is called an inter-graph edge. For the compound graph C in Figure 2.1, the edge {a, b} is an intra-graph edge and the edge {d, m} is an inter-graph edge.
2.2
Graph Visualization
Graph theory, as introduced in Section 2.1, provides topological information of the graph but it does not contain any information about graph geometry. In addition to topological structure, geometric information is also crucial to visualize a graph. Basically, graph visualization is an act of drawing a graph by introducing geometric information for its nodes (such as coordinates, shape and size) and edges (such as edge width) in addition to its topological structure. Although visualization of a graph can be performed in a 3D environment, it is more common to draw graphs in a 2D coordinate system.
Graphical properties, such as color and transparency of a node or an edge, are also considered within graph visualization concept. Labels, which enable attaching additional textual or graphical information to a node or an edge, are also important elements of graph visualization.
Layout of a graph plays a critical role for an understandable visualization (Figure 2.2). Since layout is an aesthetic aspect, it is hard to find an optimum layout. For a better layout, there are some general criteria such as planarity, total edge length, and symmetry, but, each graph structure usually requires a different layout approach. Therefore, specific heuristics have been developed for graphs with certain topological and geometrical structures.
Figure 2.2: A random layout (left) and a force directed layout (right) for the same graph
CHAPTER 2. BACKGROUND 10
Interactive graph visualization enables interactive editing of a graph in addi-tion to its drawing and layout. An interactive graph editor allows changing both topology and geometry of a graph. While adding a node to or removing an edge from a graph changes its topology, changing coordinates of a node or increasing its size changes a graph’s geometry. Improvement in graphical user interfaces (GUIs) and increase in number of software tools providing visual functions have made interactive graph editing an important concept for graph visualization [15].
2.3
Flare
Flare [17] is an open source ActionScript [1] library designed for general-purpose web-based data visualization. It has a basic support for visualization of simple graphs. It also supports basic interactive actions such as selecting and dragging nodes. Flare uses lightweight graphical components called sprites to display nodes and edges. This results in visualization of large graphs with less performance problems. The rest of this section describes the details of the architecture of Flare and its visualization mechanism.
2.3.1
Overview of Flare
In Flare, the data to be visualized consist of two default data groups: nodes and edges. In addition to these default data groups, it is also possible to define additional data groups (Figure 2.3). Section 2.3.2 and Section 2.3.3 describe the data concept of Flare in detail.
Flare visualizes the data by rendering the nodes with a shape renderer and the edges with an edge renderer. Section 2.3.4 explains the rendering process of Flare. In addition to basic rendering support, Flare also provides controls to handle actions such as selection and node dragging, and operators to perform tasks such as graph layout and labeling of nodes and edges (Figure 2.3). Section 2.3.5 gives the details of Flare’s visualization support.
Figure 2.3: Overview of data visualization in Flare
2.3.2
Data Representation
Data to be visualized is represented by the Data class. By default, there are two data groups in Data: nodes and edges. For each data group, there is a DataList which contains a list of data elements (Figure 2.4).
Apart from the default data groups, it is also possible to define additional groups by using the addGroup function of Data. For each new group, a new DataList is added to the data. Additional data groups are useful to handle data in specific conditions. For example, creating a data group for hidden edges can help to simplify the graph view when it is desired by hiding certain types of edges without actually deleting them from the data.
2.3.3
Data Sprites
A data element in a DataList is represented by the DataSprite class. DataSprite inherits from Sprite which is one of the basic graphical compo-nents of the ActionScript platform. Therefore, a DataSprite represents both the model and the view of a data element.
CHAPTER 2. BACKGROUND 12
While the data field of a DataSprite is to store the actual data of an element, the field props is to attach additional properties which are not directly related to the actual data. Other fields such as fillColor, lineColor, shape and size are for the graphical attributes (Figure 2.4).
NodeSprite and EdgeSprite classes, both of which extend DataSprite, rep-resent the node data and the edge data respectively. Both NodeSprite and EdgeSprite classes contain methods related to the graph topology for an effec-tive traversal of the graph data (Figure 2.4).
2.3.4
Renderers
Since a NodeSprite and an EdgeSprite are both graphical components, it is required to render these sprites. By default, nodes are rendered by ShapeRenderer and edges are rendered by EdgeRenderer. In Flare architec-ture, both ShapeRenderer and EdgeRenderer are designed to be singleton [19] classes (Figure 2.4). As a result, a single ShapeRenderer renders all the nodes in the graph, and a single EdgeRenderer renders all the edges in the graph.
During the rendering process, a renderer uses the visual properties such as shape, size, and color of a NodeSprite or an EdgeSprite in order to display a data sprite with an appearance specific to it. ShapeRenderer assumes the shape property of a NodeSprite to be one of the predefined shapes. Therefore, a node having an unknown shape is rendered as it has the default circular shape. EdgeRenderer renders an edge by drawing it always from the center of its source node to the center of its target node without using the size or the shape of the source and the target.
2.3.5
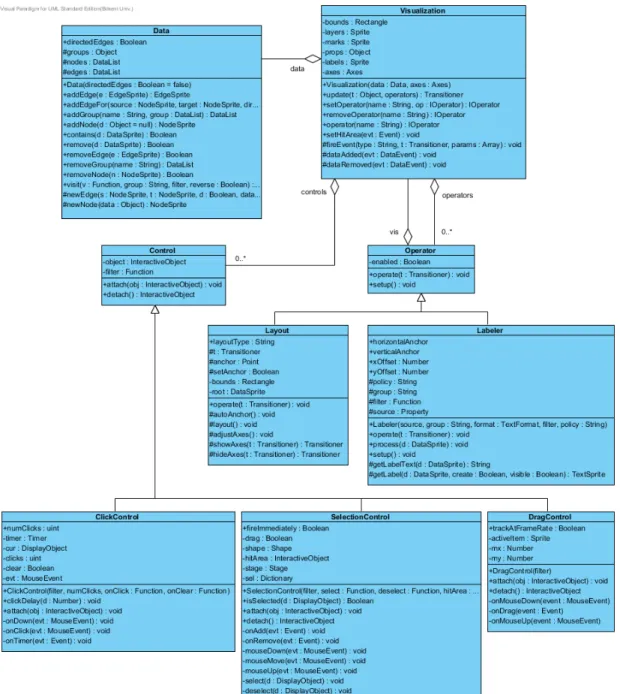
Visualization
Flare has a visualization mechanism that allows interactive editing and layout of the graph. Visualization is the core class of this mechanism (Figure 2.5). It
CHAPTER 2. BACKGROUND 14
observes both topological and geometrical changes in the graph data, and reflects the changes to the graph view.
By the help of the control classes such as ClickControl, SelectionControl and DragControl, it is possible to handle interactive actions. Similarly, by the help of the operator classes such as Labeler and Layout, it is possible to perform processing tasks on the visualization content. Due to space limitations, Figure 2.5 illustrates only a few of those control and operator classes.
Flare supports defining of additional controls and operators. It is possi-ble to add instances of these user-defined classes to the corresponding lists in Visualization. This allows customization of Flare’s visualization mechanism.
2.4
Chisio
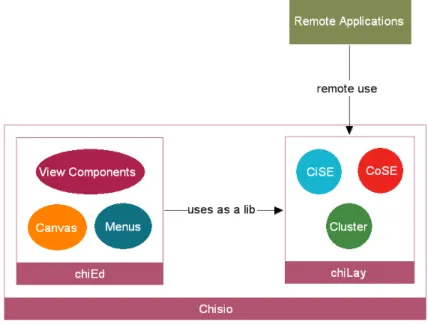
Chisio [9] is a framework that is specifically designed for interactive visualization and layout of compound or clustered graphs. Chisio is composed of two main parts: ChiLay (Chisio Layout) [8] and ChiEd (Chisio Editor) [7]. Figure 2.6 illustrates the overview structure of Chisio.
CHAPTER 2. BACKGROUND 16
ChiLay is a graphic independent Java [27] library that can be used by another application to layout compound or clustered graphs as well as simple graphs. It provides layout algorithms CoSE [16] for compound graphs, and CiSE for clustered graphs. There are also several other layout algorithms, such as circular layout and Sugiyama [31] layout, available in ChiLay.
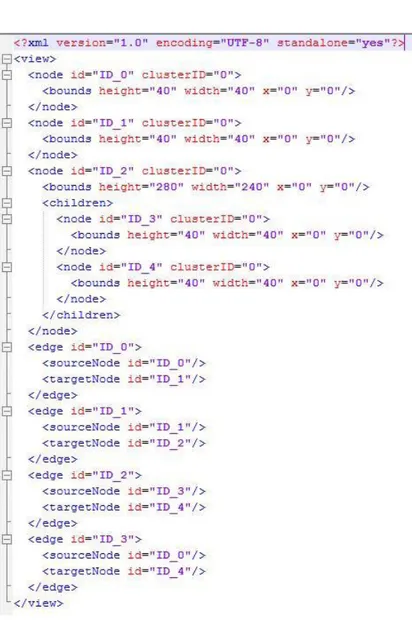
ChiLay can be used both as a local development library and as a remote layout service. In order to use the provided layout algorithms as a local library for a graphical application, it is required to construct a layout level topology from a view level topology [30]. In order to use ChiLay remotely, it is required to save the geometry of a graph in XML format that conforms to an XML schema specific to ChiLay (Figure 2.7), and to send the saved XML to a server, where ChiLay is deployed, as an HTTP request [30].
ChiEd is an interactive graph visualization tool developed in Java. It allows creating, editing, saving, and layout of both compound and simple graphs [34]. ChiEd locally uses ChiLay library for layout services.
Chapter 3
Related Work
Among the graph visualization software, there are also some tools developed for the web other than ChiWeb. While some of them are only to visualize the data, some of them enable interactive editing of the graph content. Table 3.1 compares ChiWeb to the popular web-based graph visualization software. The rest of this chapter discusses some of the notable work done in the field of web-based graph visualization.
Graph Editing Comp ound Supp ort La y o ut Customizabilit y Av ailab ilit y Domain TSV [32] Y es Y es Predefined 1 High Commercial Generic Asterisq [2] No No Predefined 1 Medium 2 Commercial Generic Cytoscap e W eb [13] Y es Y es 3 Predefined 1 Medium 4 Op en Source 5 Generic VisANT [35] Y es P artial 6 Extendible Lo w 7 Op en Source 5 Sp ecific 8 WiGis [23] No No Extendible Lo w 9 Op en Source 5 Generic ChiW eb Y es Y es Extendible High Op en Source 5 Generic 1 Additional la y out algorithms cannot b e in tegrated easily 2 P artial supp ort for custom renderers, limited customiz ation for functionalit y 3 An adapted v ersion of ChiW eb’s comp ound graph supp o rt 4 Limited customization for visualization and functionalit y 5 F ree soft w are and its source co de is publicly a v ailable 6 P artial supp ort wit h grouping; no des can b e group ed, where groups are visually highligh ted 7 Limited to basic visual prop erties of no des a nd edges 8 Designed for visual analysis of biol ogical net w orks and path w a ys 9 No supp or t for customized visualization and functionalit y T able 3.1: ChiW eb compared to the p opular w eb -based graph visualization soft w are
CHAPTER 3. RELATED WORK 20
3.1
Cytoscape Web
Cytoscape Web [13] is one the most capable graph visualization software among the open source, web-based, general purpose graph visualization tools. Cytoscape Web enables interactive editing of the graph topology and provides various graph layout options. Initially, Cytoscape Web was only supporting simple graphs, but with the adaptation of ChiWeb’s compound graph support, now it also supports compound graphs (Figure 3.1).
Figure 3.1: Compound Graph Visualization in Cytoscape Web
Cytoscape Web has a layered structure composing of three main components (Figure 3.2). The middle layer (JavaScript API) provides facilities for the upper layer (user-defined JavaScript layer) to create and manage visualization of rela-tional data. By using the JavaScript API, one can create a graph visualization with custom visual styles for nodes and edges, customized menus and custom buttons. It is also possible to define custom behavior for interactive actions such as click, double-click, and hover on nodes and edges.
The advantage of the layered structure of Cytoscape Web is that it creates an abstraction between the top layer and the bottom layer (ActionScript layer). As a result, one can construct a visualization by using only a JavaScript component
Figure 3.2: Layers of CytoscapeWeb
without dealing with ActionScript. However, this layered structure limits the customizability of Cytoscape Web. For example, rendering a node with multiple colors or introducing a custom graph layout algorithm is not possible through the API. The only way to achieve such an advanced customization is to modify the ActionScript layer. Since Cytoscape Web is not designed for it, this kind of customization requires a lot of effort and a good understanding of the architecture of ActionScript layer. Besides, it may also create backward incompatibility for the API layer and may produce undesired application behavior.
3.2
Tom Sawyer Visualization
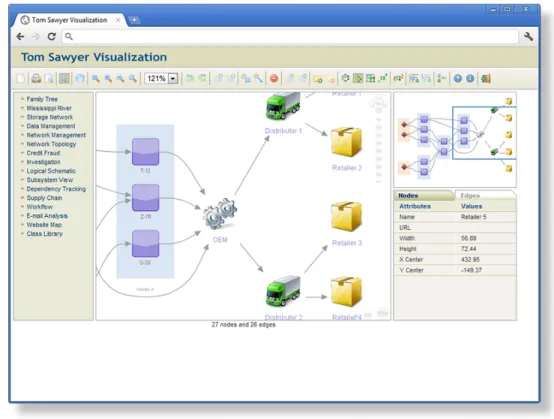
Tom Sawyer Visualization (TSV) [32] is a commercial software development kit (SDK) for building data visualization applications. Probably, it is the most capa-ble commercial software in terms of visualization and customization. TSV allows interactive editing of the graph content, it supports compound graphs, and by providing API libraries it enables customization of node and edge types as well as the context menu and other graphical user interface elements. TSV also provides various graph layout options, but it does not provide an API to easily integrate custom layout algorithms.
TSV has both desktop and web editions. Figure 3.3 illustrates a customized web application built with TSV SDK. Although TSV has a web development support via JSP and ASP.NET technologies, it is a commercial software and
CHAPTER 3. RELATED WORK 22
Figure 3.3: A sample application built on the web edition of TSV
designed for development of enterprise applications. Thus, it may not be an affordable solution for small research groups and open source web developers.
3.3
Asterisq
Asterisq [2] is another commercial web-based graph visualization software built on ActionScript technology. It consists of two different products: Constellation Custom and Constellation Roamer. For the listed features of Asterisq and for the sample screen shots provided, there is no sign of compound graph support either in Constellation Roamer or in Constellation Custom. There is also no sign of interactive graph editing by adding or removing nodes and edges in Asterisq products.
Since it is a commercial tool, basic customization of Constellation Roamer is only possible through the customization mechanism provided by the software
API [3]. Similar to customization of Cytoscape Web, it is only possible to cus-tomize visual properties of nodes and edges, and some configuration parameters through the provided API. It does not seem possible to customize the interactive behavior of the application or to add arbitrary shapes for nodes and edges other than predefined types. Figure 3.4 illustrates a visualization of a simple network in Constellation Roamer.
Figure 3.4: A sample view from the demo version of Constellation Roamer (As-terisq)
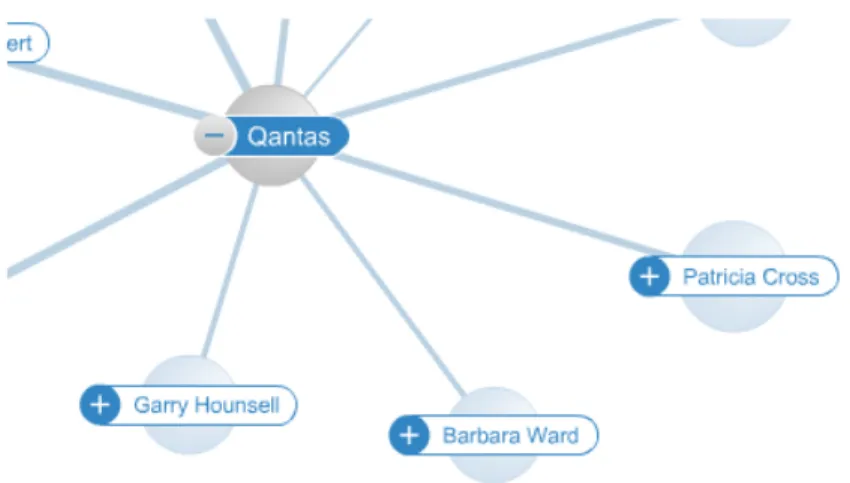
Constellation Custom, on the other hand, provides additional customization for rendering of nodes. It is possible to define a custom node renderer [4] to display a node with a custom view (Figure 3.5). Since the source code of the application is not publicly available because of commercial reasons, for the doc-umented customization approach, it is not clear whether it is possible to define different renderers for different types of nodes or it is only possible to use a single renderer at a time.
CHAPTER 3. RELATED WORK 24
Figure 3.5: A custom node renderer for Constellation Custom that displays a plus sign when it has neighbors that are not being displayed
3.4
VisANT
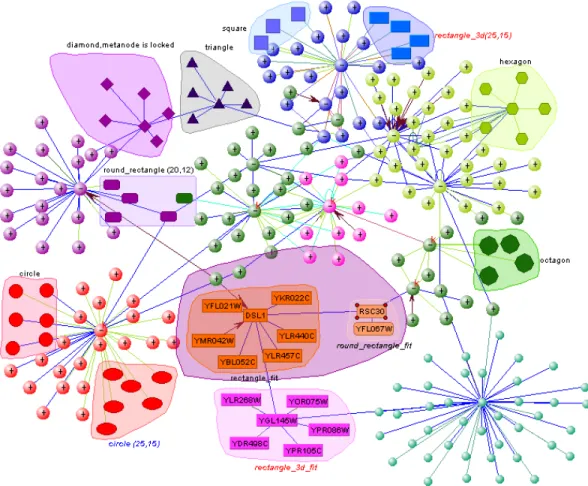
VisANT [35] is another powerful graph visualization and editing software designed for visual analysis of biological networks and pathways. VisANT has both desktop and web-based versions. VisANT has support for grouping nodes. One can select a number of nodes to group as a component, it is also possible to create nested group structures which is similar to nested compound nodes. However, groups are not considered as nodes in VisANT, so it is not possible to define edges for groups. Figure 3.6 illustrates a sample visualization with nested node groups.
Because web-based version of VisANT is built on Java Applet technology, it requires installation of Java Runtime Environment (JRE) which has a longer installation process than Flash Player and can be considered as a heavyweight component compared to Flash Player. Being a domain-specific software for bio-logical networks and pathways is another drawback of VisANT, because it is not easy to customize VisANT for general-purpose graph visualization or for another domain.
CHAPTER 3. RELATED WORK 26
3.5
WiGis
WiGis [23] is a web-based framework for interactive graph visualization. The lightweight and flexible architecture of WiGis enables it to run on a basic browser without requiring additional plugins. WiGis is specifically desgined to visualize large networks with less scalability limitations.
WiGis enables interaction with the graph for the actions such as node repo-sitioning, zooming, and filtering. WiGis provides various options for complexity management, however, it does not allow to change the graph topology interac-tively by creating new nodes and edges or by removing existing nodes and edges. Unfortunately, WiGis does not support compound graphs, and also it does not offer easy customization methods to build domain-specific applications. Al-though, WiGis provides an interface for plugging in custom layout algorithms, it is not easy to extend WiGis for custom interactive functionality and for custom node and edge views.
ChiWeb Architecture
ChiWeb is designed as an ActionScript [1] component and it is built on Flare library (Section 2.3). Taking advantage of Flare’s data management and visual-ization support, ChiWeb provides a framework which enables easy customvisual-ization of graph components and interaction handling mechanism. The rest of this chap-ter gives detailed information on the main components of ChiWeb architecture.
4.1
ChiWeb Model
ChiWeb’s model structure (Figure 4.2) is based on Flare’s data model. Main components of the ChiWeb model are: a graph, nodes, edges, and visual styles.
The Graph class represents the graph model with its Data. The graph data contains data groups for nodes, edges, compound nodes, bend points, regular edges, selected edges, and selected nodes. These groups help to manage the graph data for specific conditions. For example, when it is desired to perform an operation on all selected nodes, the corresponding data group allows a fast access to the selected nodes.
The Node class, which extends Flare’s NodeSprite, represents simple (regular) nodes, compound nodes and bend nodes (bend points). A simple (regular) node
CHAPTER 4. CHIWEB ARCHITECTURE 28
is the basic node with no nested structure. A compound node has its child nodes, bounds, and padding values. A compound node can contain another node (either a simple node or a compound node) as its child. A bend node, on the other hand, is a special kind of node that is used to create bend points for edges. Padding values represent the distance between the minimum rectangular bounds enclosing the children of a compound and the border of that compound. Bounds of a node represent bounds enclosing the children of a compound node plus compound’s padding values.
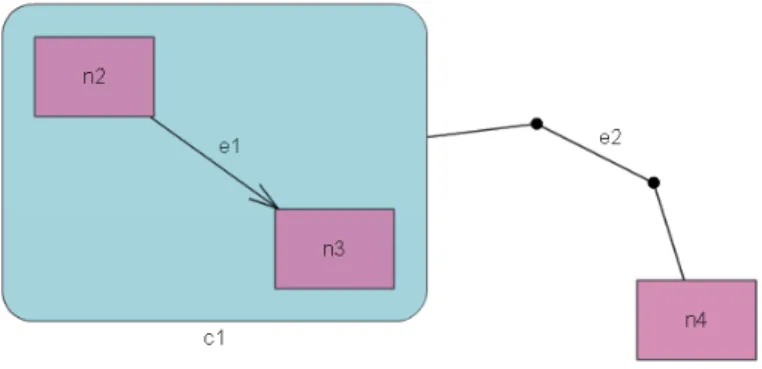
Figure 4.1: An example graph with 3 simple nodes (n2, n3, n4), one compound node (c1), one regular edge (e1) with a simple target arrow, and one edge (e2) with 2 bend points and 3 segments
The Edge class, which extends Flare’s EdgeSprite, represents both regular edges and segment edges. A regular edge is an edge between two nodes each of which is either a regular node or a compound node. A regular edge can contain bend nodes (bend points) and edge segments. On the other hand, a segment edge, which is a child of a regular edge, is an edge between two bend nodes or between one bend node and one actual node where this actual node is either the source or the target node of the parent regular edge.
Both Node and Edge classes implement the interface IStyleAttachable. This interface is designed to help management of visual styles for nodes and edges. Both a node and an edge have a StyleManager to keep track of the styles attached to them. Each node and each edge has a default style, and can have an arbitrary number of group styles. It is also possible to attach a style specific to a certain node or edge.
CHAPTER 4. CHIWEB ARCHITECTURE 30
The Style class represents a style with visual property and value pairs. It is possible to define an arbitrary number of visual properties within a style. A style is applied on an object with the help of the apply method. More details about visual styles and style management mechanism are given in Section 4.4. Section 5.1, on the other hand, demonstrates how to define custom styles for nodes and edges by providing sample implementations.
In a graph, a unique id is assigned to a node or an edge while adding it to the graph data. Since both Node and Edge classes inherit from DataSprite, this id value is stored as a data attribute within the data field of the sprite. In addition to the graph data, a graph also contains two maps, which are keyed on the id attribute, one for nodes and the other for edges. These maps allow fast access to nodes and edges by using their ids.
4.2
Renderers and UIs
ChiWeb defines its own renderers for simple nodes, compound nodes, and edges (Figure 4.3). NodeRenderer, which extends Flare’s ShapeRender, is to render simple nodes, and CompoundNodeRender, which extends NodeRenderer, is to render compound nodes. EdgeRenderer, on the other hand, extends Flare’s EdgeRenderer and it is to render edges. All renderers in ChiWeb are single-ton classes. Therefore, a single instance of NodeRenderer renders all nodes, and so on.
In contrast to Flare’s ShapeRenderer, NodeRenderer does not rely on pre-defined shapes. In fact, it does not perform the actual drawing of a simple node. Instead, the graphical component of a node is drawn by an INodeUI in-stance specific to that node’s shape property. ChiWeb provides three default node UIs implementing the INodeUI interface (Figure 4.3). Any INodeUI in-stance can be registered to the system with a unique UI name by the help of the registerUI function of NodeUIManager. Then, NodeRenderer accesses to a registered INodeUI instance by the getUI function, and it calls the draw method
CHAPTER 4. CHIWEB ARCHITECTURE 32
of the node UI to render the node. Defining additional classes implementing the INodeUI interface enables customization of node UIs. In order to associate a node with a certain node UI, it is enough to set the shape property of the node to the registered name of the node UI.
Compound node rendering is similar to simple node rendering. In order to render a compound node, CompoundNodeRenderer uses CompoundUIManager to access to a registered INodeUI instance, and calls its draw method. ChiWeb pro-vides two default compound node UIs (Figure 4.3). The main difference between a simple node and a compound node is node bounds. A fixed size or bounds can be defined for a simple node. However, the bounds of a compound node depend on the size and the position of its children. An INodeUI instance should al-ways take the bounds enclosing the compound node’s children into account when drawing the compound node. For the example graph in Figure 4.1, bounds of the compound node (c1 ) depend on the position and size of its children (n2 and n3 ) and also depend on the padding values. For this specific example, left padding value is the distance between the left border of the node n2 and the left border of the compound c1.
Similar to INodeUI, ChiWeb provides the interface IEdgeUI for edge UI cus-tomization. In addition to IEdgeUI, another interface called IArrowUI is provided to enable customization of edge arrows for directed graphs. There is one IEdgeUI and one IArrowUI implementation by default (Figure 4.3). In order to associate an edge with a certain edge UI, it is required to set the shape property of the edge to the registered name of the edge UI. Similarly, to associate an edge with an arrow UI it is enough to set the property sourceArrowType or targetArrowType to the registered name of the arrow UI. Figure 4.1 illustrates a default edge (e1 ) with a default target arrow.
ChiWeb’s default edge UI (LinearEdgeUI) draws an edge as a line from its source node to its target node. However, by defining a custom edge UI and implementing the draw method accordingly, it is possible to render an edge in any desired form. It is possible to achieve an arbitrary drawing, such as a custom shape in the middle of an edge, with the custom implementation of the draw
method.
Flare’s default EdgeRenderer draws an edge from the center of the source node to the center of the target node. However, for a more aesthetically pleas-ing view, edge renderpleas-ing should start from a point on the bounds of the source node and should end on a point on the bounds of a target node. Those points are called clipping points. In order to provide clipping point support for edge rendering, it is required to calculate clipping points for both the source and the target. Since a node can have an arbitrary shape, a function calculating the clip-ping point is defined as a part of the INodeUI interface instead of the IEdgeUI interface. EdgeRenderer gets the corresponding node UIs and calls the method intersection for both the source and the target nodes to find two clipping points. After calculating clipping points, an edge is rendered by calling the draw method of the corresponding edge UI.
Default node and edge UIs render sprites by using their graphical properties encoded directly as field values of sprites, which are inherited from DataSprite, such as fillColor, fillAlpha, lineColor, lineWidth, and size. Apart from these default properties, an edge UI or a node UI may also use custom properties attached as fields to the props object of the associated sprite.
4.3
Visualization
and
Management
of
the
Graph
GraphManager (Figure 4.4) is designed to manage both the topology and the view of the graph. It contains sophisticated methods to add a node, to add an edge, to add a bend point for an edge, to remove an existing element, etc. These methods enable modification of the graph topology and use the basic functionality provided by Graph to perform advanced tasks on the graph. After modifying the topology, topology related methods also update the view to keep consistency between the view and the topology of the graph.
CHAPTER 4. CHIWEB ARCHITECTURE 34
GraphManager contains methods to select and deselect a graph element, to hide and show an element, to pan and zoom the graph view, etc. These meth-ods enable modification of the graph view and use the functionality provided by GraphView (Figure 4.4) to perform required tasks. Functionality provided by GraphManager is mainly used by EventControl classes (Section 4.5) within ChiWeb.
GraphManager also contains listener methods to reflect the changes in the visual styles to the graph elements. Visual style management is described in Section 4.4 in detail.
GraphView is the main class providing functionality to highlight a graph el-ement when it is selected, to update visibility of elel-ements for filtering purposes, to update labels, to pan or zoom, to center the view, etc. GraphView also handles the visualization of the graph by using the functionality provided by GraphVisualization (Figure 4.4).
GraphVisualization extends Flare’s Visualization by adding extra func-tionality for the hit area of the canvas, compound bounds, bounds of the visible elements, and the labels. Functionality provided by GraphVisualization is cru-cial to keep the graph elements consistent with each other. It is critical to update the bounds of a compound node, after a drag event for instance, to keep it con-sistent with its children. It is also critical to update edge and node labels, after a layout operation for instance, to keep them consistent with their owners.
4.4
Visual Style Management
As described in Section 4.2, renderers and default UIs render data sprites (nodes or edges) by using both the default graphical properties and the additional at-tributes attached to the props object. In order to change the appearance of the sprite, it is required to modify the values of these properties.
CHAPTER 4. CHIWEB ARCHITECTURE 36
a node or an edge. When these visual styles are applied on the sprite, graphical properties of the sprite are updated with the values obtained from the visual styles.
GraphStyleManager is to define visual styles for the data groups. GraphStyleManager defines 4 default styles (Figure 4.4) for the default data groups. It is possible to add custom styles for both the default and the custom data groups by using the addGroupStyle method. GraphManager attaches the corresponding default style to the data sprite after creation of a node, a com-pound node, an edge or a bend point. This ensures that a data sprite has at least one style, which is the default style.
Adding a style for a specific data group allows defining a style for each member in that group. In other words, a group style is shared among all sprites in that data group, and a change in a group style is reflected to all sprites in that specific data group. It is also possible to define a specific style per node or per edge. This allows attaching a unique style for a certain data sprite.
Attaching a visual style to a data sprite does not change its graphical proper-ties immediately. In order to reflect the style to the sprite, it should be applied on the sprite by invoking the apply method. ChiWeb provides a utility class Styles (Figure 4.18) to perform necessary updates when it is required to re-apply styles to the sprites. The function reApplyStyles always applies the default style first and element-specific style last. Group styles are applied after the default style, and before the specific style. This order gives priority to the element-specific style over group styles, and priority to group styles over the default style. This mechanism prevents general styles to overwrite more specific styles.
In order to preserve synchronization between the visualization of the sprite and the styles attached to it, ChiWeb takes advantage of the event dispatching facility of Flash. DataChangeEvent and StyleChangeEvent (Figure 4.17) are specifically designed to help visual style synchronization.
When a new sprite added to a data group, a DataChangeEvent specific to this action is dispatched by Graph, and the associated listener in GraphManager
Figure 4.5: Adding a node into a data group of selected nodes
performs the tasks required to update the visualization. Figure 4.5 illustrates the sequence of operations related to data groups for selection of a node. This sequence diagram does not show the sources calling the methods addNode and addToGroup for the sake of simplicity. Details of node creation via user interaction are given in Figure 4.10.
Figure 4.6: Removing an existing group from graph data
Similarly, specific events are dispatched by Graph when a sprite is removed from a data group, and when an existing group is removed from the graph data (Figure 4.6).
CHAPTER 4. CHIWEB ARCHITECTURE 38
Figure 4.7: Adding a style specific to the data group of compound nodes GraphStyleManager dispatches a DataChangeEvent when a new style is added for a data group (Figure 4.7), and dispatches another DataChangeEvent when a group specific style is removed.
Figure 4.8: Changing a visual style specified for edges by adding a new property On the other hand, each data sprite (a node or an edge) listens to all styles attached to it for a property change. When a style property changes, or a new property is added to a style, a StyleChangeEvent is dispatched by that style. Then, the associated listener of the sprite performs required updates (Figure 4.8).
4.5
Controls
ChiWeb provides a control mechanism for various interactive actions such as node and edge selection, node dragging, panning and zooming, clicking on the canvas or on a graph element, and pressing a keyboard key.
EventControl, which extends Flare’s Control, is designed as a base class for the other control classes in ChiWeb. There are 7 default controls provided by ChiWeb (Figure 4.5). Each control class listens to specific events and performs required tasks on the event target or on the whole graph via the methods provided by GraphManager.
Apart from the default controls, it is possible to define custom listener functions for specific events and activate them via the addCustomListener method of ControlCenter. For an advanced control mechanism, it is also al-lowed to add or remove controls using the addControl and the removeControl methods of ControlCenter. A predefined default control cannot be removed from ControlCenter. However, it is possible to disable a default control with the method disableDefaultControl for an advanced customization. A default control can be enabled again at any time by invoking the method enableDefaultControl.
Every control class has access to a single StateManager instance to check or set flags for specific states. StateManager is specifically designed for event con-trol mechanism. A state manager can be considered as a shared communication platform among all control classes. A state manager contains 11 predefined flags by default (Figure 4.5). Apart from these default flags, it is also possible to attach custom state flags to a state manager. These custom flags, then, can be used by the custom controls.
Some of the default control classes dispatch a ControlEvent (Figure 4.17) when a specific task starts or ends. For example, PanControl dispatches events when panning starts and ends. A ControlEvent is dispatched on the in-teractive object to which the control is attached, and this inin-teractive object
CHAPTER 4. CHIWEB ARCHITECTURE 40
is the GraphVisualization instance for the default controls. Dispatching a ControlEvent lets a function, which listens to this GraphVisualization in-stance, perform additional tasks after a specific event.
Examples of control customization are given in Section 5.2 with sample im-plementations. The rest of this section explains each default control class in detail.
4.5.1
ClickControl
ClickControl is designed to handle single click events on the graph canvas or on node and edge sprites. Upon a click event, ClickControl performs a task according to active states of StateManager.
Figure 4.10: Adding a new node into the graph canvas
When the SELECT state is active, a single click on a sprite (a node or an edge) results in selection of that sprite. If the SELECT_KEY_DOWN state is activated by holding down the selection key (which is the CTRL key by default), then previously selected sprites remain selected. On the other hand, if the selection key is inactive, a click on a sprite or on the canvas resets all previous selections.
CHAPTER 4. CHIWEB ARCHITECTURE 42
the graph (Figure 4.10), and a click on another node adds a new node as a child into the target node. The node is added to the location of the click event by invoking the addNode method of GraphManager. GraphManager adds the node to the graph, initializes its default style, and updates the graph view. ClickControl dispatches a specific ControlEvent (ADDED_NODE) after node creation.
Figure 4.11: Adding an edge between two existing nodes
When the ADD_EDGE state is active, successive clicks on two different nodes add a new edge between those nodes (Figure 4.11). First clicked node becomes the source of the added edge, and second clicked node becomes the target of the edge. ClickControl dispatches a specific ControlEvent (ADDED_EDGE) after adding the edge. It also dispatches another ControlEvent (ADDING_EDGE) after the first click of the edge adding process.
When the ADD_BENDPOINT state is active, a click on an edge creates a new bend point on the edge (Figure 4.12). The bend point is created at the location of the click event. A specific ControlEvent (ADDED_BEND) is dispatched after a bend point is added.
Figure 4.12: Adding a bend point for a regular edge
4.5.2
SelectControl
While selection by single click is controlled by ClickControl, selection of multiple graph elements is controlled by SelectControl. It allows selection of multiple elements by dragging mouse while mouse key is down (Figure 4.13).
When the SELECT state is active, holding the mouse down on the graph canvas activates the selection rectangle. The selection rectangle, which is temporarily added to the canvas during selection, is a Shape instance, and its bounds are updated upon each mouse movement as long as the mouse button is kept down. Graph elements enclosed by the selection rectangle are selected as soon as the mouse button is released.
Similar to selection by single click, if the SELECT_KEY_DOWN state is active, then previously selected sprites remain selected. If it is inactive, SelectControl resets previous selections.
SelectControl dispatches two control events specific to selection. One is the SELECT_START event which is dispatched when selection starts with a MOUSE_DOWN
CHAPTER 4. CHIWEB ARCHITECTURE 44
event, and the other is the SELECT_END event which is dispatched when selection ends with a MOUSE_UP event.
Multiple element selection is initiated only if the target of the MOUSE_DOWN event is the graph canvas. Holding the mouse down on a sprite (a node or an edge) is considered as a drag event and handled by MultiDragControl (Section 4.5.3).
4.5.3
MultiDragControl
MultiDragControl is to drag multiple nodes with a single drag event. MultiDragControl captures a MOUSE_DOWN event where the event target is a node sprite, and activates the DRAGGING state of StateManager (Figure 4.14). If a MOUSE_MOVE event is dispatched while the DRAGGING state is active, target node is dragged to the new location of the mouse.
If the target node is a compound, its children are also dragged together with the compound. If the target node is selected and there are also other selected nodes, MultiDragControl drags all the selected nodes as well as the target node. In the case when a node inside a compound node is dragged, but the compound itself is not dragged, it is required to update the bounds of the compound node to keep its bounds consistent with respect to its children. If the compound node is a child of another compound node, its parent should also be updated. There-fore, MultiDragControl updates bounds by calling the updateCompoundBounds method of GraphView for all the parent compound nodes up to the root parent.
Dragging ends with a MOUSE_UP event. MultiDragControl performs a final update on the graph view, and deactivates the DRAGGING state.
MultiDragControl dispatches two control events specific to dragging oper-ations. One is the DRAG_START event which is dispatched when dragging starts with a MOUSE_DOWN event, and the other is the DRAG_END event which is dispatched when dragging ends with a MOUSE_UP event.
CHAPTER 4. CHIWEB ARCHITECTURE 46
4.5.4
KeyControl
KeyControl is specifically designed to control KEY_DOWN and KEY_UP events for the selection key (the key used for multiple element selection). When a KEY_DOWN event is dispatched, KeyControl activates the SELECT_KEY_DOWN state of StateManager if the select key is down. Similarly, when a KEY_UP event is dispatched, it deactivates the SELECT_KEY_DOWN state.
The selection key is the CTRL key by default, but it is possible to specify a custom key via global configuration (Figure 4.4).
4.5.5
ResizeControl
ResizeControl is designed to control the RESIZE event dispatched by the graph canvas. Whenever the graph canvas is resized, ResizeControl updates the hit area of the graph canvas to ensure that visible area of the canvas is always inter-active.
4.5.6
PanControl
PanControl is designed to enable panning of the graph canvas by clicking on and dragging it. Like MultiDragControl, it listens to MOUSE_DOWN events. If the event target is the graph canvas, PanControl activates the PANNING state of StateManager. If a MOUSE_MOVE event is dispatched while the PANNING state is active, graph canvas is panned by the amount of the mouse movement.
Panning ends with a MOUSE_UP event. When panning ends, PanControl up-dates the hit area of the graph canvas, and deactivates the PANNING state.
In order to enable panning it is required to activate the PAN state of StateManager. This is the main difference of PanControl from MultiDragControl, since dragging is enabled in any case by default, unless MultiDragControl is explicitly disabled using the disableDefaultControl
CHAPTER 4. CHIWEB ARCHITECTURE 48
method of ControlCenter. PanControl, on the other hand, can be deactivated by toggling the PAN state of StateManager.
Similar to MultiDragControl, PanControl dispatches a PAN_START event when panning starts with a MOUSE_DOWN event, and dispatches a PAN_END event when panning ends with a MOUSE_UP event.
4.5.7
ZoomControl
ZoomControl is designed to enable zoom operations on the graph view. By de-fault, ZoomControl listens to MOUSE_WHEEL events, and zooms in or zooms out according to the direction of the wheel movement. ZoomControl is always active by default, but it can be disabled using the disableDefaultControl method of ControlCenter.
It is possible to customize the event type and the event listener function by changing corresponding attributes of this control. When it is customized, ZoomControl listens to a custom event instead of a MOUSE_WHEEL event, and invokes the provided listener function instead of its default listener.
4.6
Operators
In addition to Flare’s default operators, ChiWeb provides operators for node and edge labels (Figure 4.15). NodeLabeler extends Flare’s Labeler to provide additional functionality for simple and compound node labels. EdgeLabeler, which extends NodeLabeler, helps to position and display edge labels in a desired way.
ChiWeb also provides another operator named LayoutOperator, which is de-signed as a base class for layouts to be implemented by the applications using Chi-Web as a library. LayoutOperator extends Flare’s Layout class (Figure 4.15).
CHAPTER 4. CHIWEB ARCHITECTURE 50
4.7
Persistency
ChiWeb defines an interface IGraphPorter (Figure 4.16) to provide a basic tem-plate to import/export graph information from/into various formats. By default, ChiWeb includes an implementation of this interface for GraphML format [21] to import and export graphs as GraphML files.
Figure 4.16: Persistency support of ChiWeb
Although it is possible to save and load the graph in standard GraphML format, ChiWeb extends this format to store visual style and global configuration information in a proper way. ChiWeb introduces style and config elements in addition to GraphML’s default elements. While a config element can only be a child of the graphml, a style element can be added as a child to a graph, to a node, and to an edge.
GraphML contents given below partially illustrate the representation of the graph in Figure 5.1 in the extended GraphML format defined by ChiWeb. In addition to default GraphML elements, this example contains a config element to store global configuration parameters, and style elements to store group style properties.
<key id="x" for="node" attr.name="x" attr.type="double"/> <key id="y" for="node" attr.name="y" attr.type="double"/>
<key id="bendpoints" for="edge" attr.name="bendpoints" attr.type="string"/> <key id="groups" for="all" attr.name="groups" attr.type="string"/>
<key id="shape" for="all" attr.name="shape" attr.type="string"/> ... <config id="globalConfig"> <data key="enclosingLineWidth">1</data> <data key="zoomScale">0.8</data> <data key="marqueeFillColor">16299396</data> <data key="enclosingFillAlpha">0.2</data> <data key="enclosingLineColor">8947967</data> <data key="backgroundColor">4294572537</data> <data key="marqueeLineColor">16435878</data> <data key="enclosingFillColor">8947967</data> <data key="marqueeLineWidth">2</data> <data key="selectionKey">ctrlKey</data> <data key="panAmount">20</data> <data key="enclosingLineAlpha">0.4</data> </config> <graph> <node id="n1"> <data key="x">-201</data> <data key="y">-1.85</data> <data key="label">n1</data> <data key="groups">compoundNodes</data> <graph> <node id="n3"> <data key="x">-256.35</data> <data key="y">-29.3</data> <data key="label">n3</data> <data key="groups">circularNode</data> </node> <node id="n4"> <data key="x">-145.7</data> <data key="y">25.5</data> <data key="label">n4</data> <data key="groups">circularNode</data> </node>
<edge id="e1" source="n3" target="n4"> <data key="label">e1</data> <data key="groups">regularEdges</data> </edge> </graph> </node> ...
<edge id="e2" source="n2" target="n5"> <data key="label">e2</data>
<data key="groups">dashedEdge;regularEdges</data> </edge>
CHAPTER 4. CHIWEB ARCHITECTURE 52 ... <style id="gradientRect"> <data key="shape">gradientRect</data> <data key="alpha">0.7</data> <data key="gradientAngle">autoAngle</data> <data key="gradientType">linear</data> <data key="w">80</data> <data key="fillColor">4282279664</data> <data key="spreadMethod">reflect</data> <data key="lineWidth">2</data> <data key="interpolationMethod">rgb</data> <data key="h">60</data> <data key="labelFontWeight">bold</data> <data key="labelFontStyle">italic</data> </style> <style id="dashedEdge"> <data key="shape">dashedEdge</data> <data key="alpha">0.8</data> <data key="onLengthCoeff">1</data> <data key="offLengthCoeff">2</data> <data key="lineColor">4284926994</data> <data key="targetArrowType">simpleArrow</data> <data key="lineAlpha">0.5</data> <data key="lineWidth">3</data> </style> ... </graph> </graphml>
4.8
Events
ChiWeb provides event classes (Figure 4.17) to enable further customization of the application behavior. ChiWebEvent, which extends Event class of Flash, is a base class for all other events in ChiWeb. It introduces a new info field to attach additional information to an event object before dispatching it.
DataChangeEvent and StyleChangeEvent are designed to keep consistency of visual styles (Section 4.4) whereas ControlEvent is designed to be dispatched within the EventControl classes (Section 4.5) and allows performing additional tasks after a specific event.
Figure 4.17: Event classes introduced by ChiWeb
4.9
Utility Classes
ChiWebprovides utility classes (Figure 4.18) for some specific tasks. Utility func-tions provided by these classes are used within various components of ChiWeb. Edges, Nodes and Styles contain utilities related to the ChiWeb model (Sec-tion 4.1) and mostly used by model and manager classes. GeometryUtils contains functions for geometric calculations and used for rendering purposes. Groups is mostly composed of group name constants used for data group management. ImageUtils is to load and process graphical images. GeneralUtils provides functions related to general display and calculation tasks.
CHAPTER 4. CHIWEB ARCHITECTURE 54
![Figure 1.2: Visualization of a biological pathway (PKA-mediated phosphorylation of CREB) with a simple graph structure in Cytoscape [12]](https://thumb-eu.123doks.com/thumbv2/9libnet/5629463.111688/18.918.246.712.673.1007/figure-visualization-biological-pathway-mediated-phosphorylation-structure-cytoscape.webp)