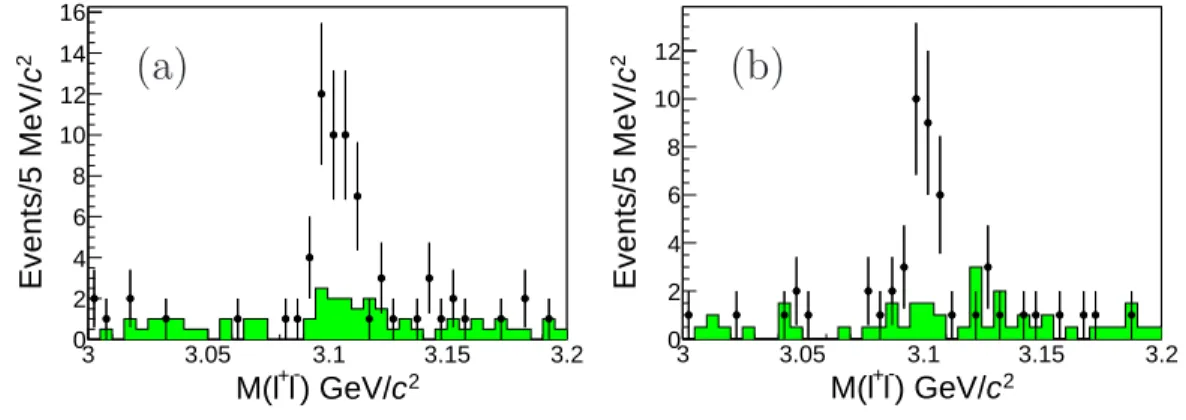
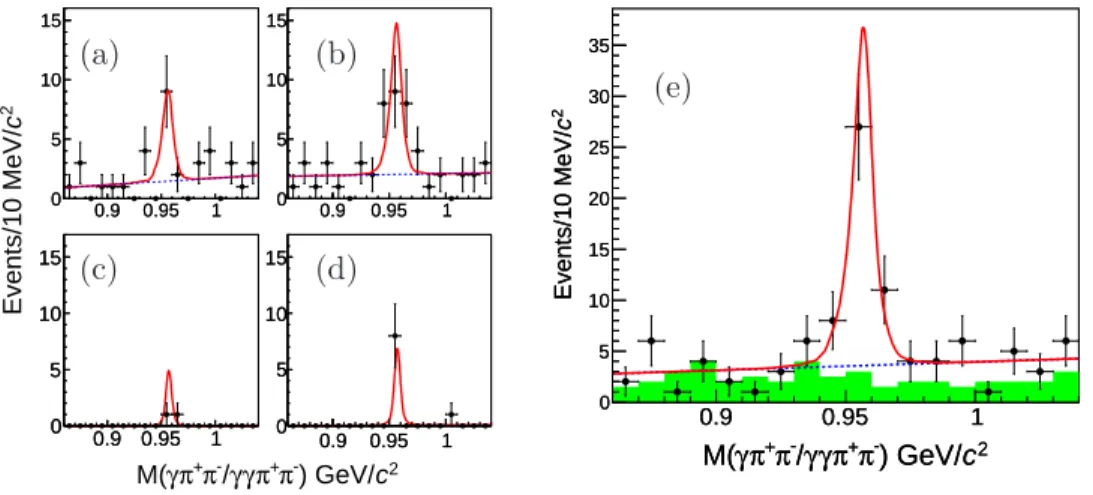
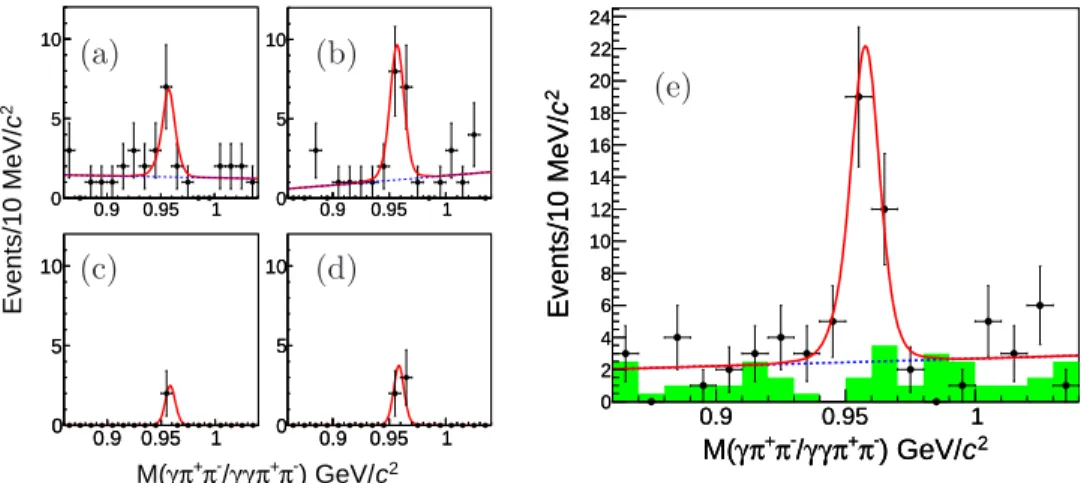
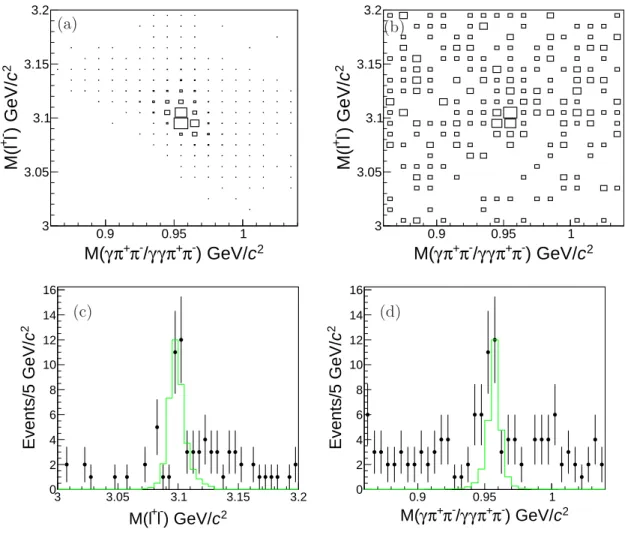
Observation of e(+)e(-) -> eta ' J/psi center-of-mass energies between 4.189 and 4.600 GeV
Tam metin
Şekil
Benzer Belgeler
Bu çalıĢmada habercilikde yapılan yönlendirme, dezenformasyon ve propaganda Azerbaycan ve Ermenistan devletlerinin Dağlık Karabağ problemi ile ilgili yapılan
Bu çalışmanın amacı mobil uygulama tercihinde tüketicilerin kişilik özelliklerinin mobil uygulama kullanımı ile ilişkisini belirlemek, kullanıcıların mobil
Hemiplejik hastalarda gövde kontrolü zayıf olan hastalarda gövde kontrolü kuvvetli olan hastalara göre üst ekstremite fonksiyonları ve yaşam kalitesi daha
Electricity generation from this waste heat using TPV does not only improve the process energy efficiency, but also act as an independent power supply, since many
Halka açık şirket sayısı ve piyasa değerinin ülke potansiyelini yansıtır büyüklüğe ulaştığı, ulusal ve ulusla- rarası yatırımcıların en üst seviyede
İş Hayatında Uygulanan Mobbing’in Çalışanlar Üzerindeki Etkileri: Bir Uygulama Çalışması Türk Bilişim Sektörü The Effects of Mobbing on Employees: A Case Study on
Finally, when the traditional houses of Tabriz are considered as spatial organization, riwaq, always located in the middle of hayat, is used in rectangular form along the facade in
Hastanelerde bu uygulamalar Enfeksiyon Kontrol Komitesince (EKK) gerçekleştirilsede, hastane İSGB’de görevlendirilen iş güvenliği uzmanı, işyeri hekimi ve diğer
