R E S E A R C H A R T I C L E
Open Access
The VDR gene FokI polymorphism is
associated with gestational diabetes
mellitus in Turkish women
Mahmut Apayd
ın
1, Selvihan Beysel
1,2*, Nilnur Eyerci
3, Ferda Alparslan Pinarli
3, Mustafa Ulubay
4,
Muhammed Kizilgul
1, Ozhan Ozdemir
5, Mustafa Caliskan
1and Erman Cakal
1Abstract
Background: The association between the vitamin D receptor (VDR) gene and gestational diabetes mellitus (GDM) has not been investigated in Turkish pregnant women. We aimed to investigate associations between VDR gene BsmI (rs15444410), ApaI (rs7975232), FokI (rs19735810), and TaqI (rs731236) single nucleotide polymorphisms (SNPs) and GDM.
Material-methods: This case-control study comprised 100 women with GDM and 135 pregnant women without GDM. TheVDR polymorphism was evaluated using Sanger-based DNA sequencing.
Result:VDR gene ApaI, BsmI, and TaqI SNPs did not differ between women with and without GDM (each, p > 0.05). ApaI, BsmI, and TaqI were not associated with GDM risk. The VDR gene FokI CT/TT genotype was associated with an increased GDM risk (CT vs. CC, OR = 1.84, 95% CI: [1.05–3.23], p = 0.031; TT vs. CC, OR = 3.95, 95% CI: [1.56–9.96], p = 0.002; CT/TT vs. CC, OR = 2.29, 95% CI: [1.35–3.89], p = 0.002; and CT/CC vs. TT, OR = 3.02, 95% CI: [1.23–7.38], p = 0.012). The FokI-TT genotype was more associated with younger age and higher glucose, HbA1c, and HOMA-IR than the CC and CT genotype.FokI-T was positively correlated with log-HOMA-IR (r = 0.326, p = 0.004). FokI SNPs were independently associated with GDM after adjusting for BMI and age (β = 1.63, 95% CI: [1. 2-4.2], p = 0.012). There were no associations between theFokI, ApaI, BsmI and TaqI haplotypes and GDM.
Conclusion:VDR gene FokI SNPs were independently associated with having GDM in Turkish women. VDR gene FokI SNPs might contribute to insulin resistance of developing GDM.
Keywords: VDR gene, FokI, Gestational diabetes Background
Gestational diabetes mellitus (GDM) is defined as glucose intolerance diagnosed during pregnancy [1]. The preva-lence of GDM shows differences among ethnic popula-tions and ranges from 1 to 14% [2]. GDM is characterized by increased insulin resistance, hyperglycemia, and obesity [1, 3–5]. Genetic and environmental factors play an
im-portant role in the etiology of GDM [3]. Women with a
family history of diabetes mellitus (DM) are at risk of GDM. Women with a history of GDM are at risk of type 2
DM (T2DM) in the future [1–5]. Genetic variations re-lated to ß-cell dysfunction and insulin resistance have been shown to contribute to the development of GDM [1,
3,5,6]. The vitamin D receptor (VDR) gene is actively in-volved in the insulin metabolic pathway. Vitamin D shows its cellular activity by binding to VDR. Vitamin D plays a role in insulin secretion [7]. Vitamin D deficiency was as-sociated with pre-eclampsia, insulin resistance, and GDM [8]. Active vitamin D shows efficacy by binding to VDR and it has a wide range of genetic variations [9]. The com-plex of vitamin D and its receptor is a transcription factor that plays a role in the regulation of insulin secretion from pancreatic beta cells [10]. VDR acts as a ligand-dependent transcription factor and it is a member of the nuclear
hor-mone receptor family. The VDR gene is localized on
© The Author(s). 2019 Open Access This article is distributed under the terms of the Creative Commons Attribution 4.0 International License (http://creativecommons.org/licenses/by/4.0/), which permits unrestricted use, distribution, and reproduction in any medium, provided you give appropriate credit to the original author(s) and the source, provide a link to the Creative Commons license, and indicate if changes were made. The Creative Commons Public Domain Dedication waiver (http://creativecommons.org/publicdomain/zero/1.0/) applies to the data made available in this article, unless otherwise stated. * Correspondence:[email protected]
1Department of Endocrinology and Metabolism, Diskapi Yildirim Beyazit
Teaching and Research Hospital, Ankara, Turkey
2Department of Medical Biology, Baskent University, Ankara, Turkey
chromosome 12q13.1, which consists of 11 exons [11–13]. This complex affects immune system regulation [11]. It has an effect on the proliferation, differentiation, and acti-vation of immune cells and cytokine production, and
ac-cordingly, DM development [10–12]. Vitamin D
deficiency leads to defects in insulin synthesis and secre-tion [10,11,13].
VDR polymorphisms have been associated with type 1
DM (T1DM) [11] and T2DM [13–15]. BsmI (A > G,
rs1544410), ApaI (A > C, rs7975232), TaqI (T > C,
rs731236), and FokI (C > T, rs2228570) are human VDR
single-nucleotide polymorphisms (SNPs). VDR gene
Bsml, ApaI, and TaqI SNPs are found in 3 prime un-translated regions where gene expression is regulated. FokI leads to T > C substitution at exon 2, thus the first translation initiation region is removed, and conse-quently transcriptional activity of VDR is changed [13,
16]. Both insulin resistance and impaired insulin secre-tion play a role in the pathogenesis of GDM and T2DM [1, 3, 6]. The association between VDR gene SNPs and GDM has been investigated in a few studies [12,16–19]. VDR gene SNPs and GDM have not been investigated in Turkish pregnant women. The present study aimed to investigate associations between VDR gene SNPs (Taq, BsmI, FokI and ApaI) and GDM in Turkish pregnant women.
Methods Study population
Pregnant women who were referred to the Obstetrics and Gynecology Clinic of our tertiary hospital in Ankara from 2014 to 2015 were included in this case-control study. Women with GDM (n = 100) and non-diabetic pregnant controls (n = 135) were included. The pregnant women were aged 22-38 years and the pregnancy age was 24–28 weeks. Gestational age was assessed from the date of the last menstrual period and clinical assessment. A 2-hour, 75 g oral glucose tolerance test (OGTT) at 24 to 28 weeks’ ges-tation was performed for all pregnant women, irrespective of family history of DM or any other risk factors for GDM. Glucose concentrations after fasting, and 1 and 2 h after glucose administration < 92 mg/dL, < 180 mg/dL, and < 153 mg/dL, respectively, were considered normal. If a pa-tient’s glucose concentration was higher than these values,
the patient was diagnosed as having GDM [2]. Women
with GDM, who were diagnosed with these criteria, aged 22-38 years, and with pregnancy age 24–48 weeks were in-cluded the study. Women with GDM women with chronic disease such as hypertension, thyroid disorders, cardiac, and hepatic or renal dysfunction were excluded. Women without GDM aged 22-38 years and with a pregnancy age of 24–28 weeks who had no diabetes, hypertension, thyroid disorders, cardiac, and hepatic or renal dysfunction were in-cluded in the study as controls. Weight, height, and systolic
and diastolic blood pressure (BP) were measured in all par-ticipants. Serum glucose, insulin, and glycated hemoglobin (HbA1c) concentrations were measured. Insulin resistance
was calculated using the homeostasis model assessment-in-sulin resistance (HOMA-IR): [fasting plasma inassessment-in-sulin (μIU/
mL) X fasting plasma glucose (mg/dL)] / 405 [20]. The
study was approved by the Diskapi Yildirim Beyazit Teach-ing and Research Hospital Ethics Board (Number: 26.02.2015–12/21) and written consent was obtained from all participants.
Genotyping
Genetic analyses for VDR gene SNPs FokI (rs2228570),
BsmI (rs1544410), ApaI (rs7975232), and TaqI (rs731236) were performed using Sanger-based DNA sequencing. Gen-omic DNA was isolated from collected peripheral blood samples of the subjects using a DNA Isolation Kit (Roche Diagnostics, Indianapolis, IN, USA). Genotyping of each HNF1A gene polymorphism was independently performed using a prevalidated fluorescence-based allele-specific poly-merase chain reaction (PCR) assay, KASPar (KBiosciences, Hoddesdon, UK), which was performed on a Rotor-Gene Q real-time cycler (Qiagen, Hilden, Germany) according to the manufacturer’s instructions. Allele discrimination was made usingRotor-Gene Q software v.2.3.1 (Qiagen, Hilden, Germany). The genotype identification was performed blind without information on clinical phenotypes.
Statistical analysis
Statistical analysis was performed using SPSS 18.0 (SPSS, Inc) software. Variables are presented as mean ± standard deviation (SD) or median (min-max), percentages (%), odds ratios (OR), 95% confidence intervals (CI). Normality was
tested using the Kolmogorov-Smirnov and Shapiro-WilkW
test. SNPs are expressed as allelic frequency (q) or preva-lence of genotypes (%). Categorical variables were analyzed using the Chi-square test or Fisher’s exact test, where ap-propriate. Student’s t-test was used for comparisons of nor-mally distributed continuous variables or log-transformed variables between the two groups. The Hardy-Weinberg equilibrium (HWE) at individual loci was assessed using the Chi-square test. Multiple logistic regression analysis and Fisher’s exact test were tested using the following models: dominant (major allele homozygotes vs. het-erozygotes + minor allele homozygotes), recessive (major allele homozygotes + heterozygotes vs. minor allele homozygotes) and codominant (major allele ho-mozygotes vs. heterozygote and minor allele homozy-gotes vs. major allele homozyhomozy-gotes). Pair-wise linkage
disequilibrium (LD) and correlation coefficients (r2)
were analyzed using the HAPLOVIEW program. We made a variable reflecting all possible combinations of BsmI-ApaI-TaqI genotypes for each SNP. Statistical significance was defined as a p < 0.05.
Results
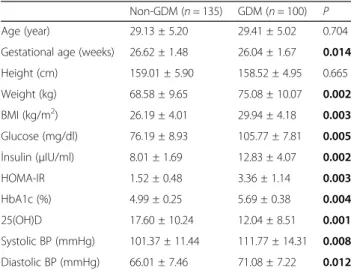
Obesity (46.2 vs. 18.0%,p = 0.001) and insulin resistance (72.4 vs. 7.2%, p = 0.001) were higher in women with GDM than in the non-GDM controls. Serum glucose, insulin, HOMA-IR, HbA1c, BMI, and BPs were higher in the GDM group than in the control group (p < 0.05). 25(OH)D was lower in women with GDM than in the controls (p < 0.05). The characteristics of the pregnant
women are shown in Table1. The four SNPs in the
con-trol group were within the HWE. Minor allele frequency
and the HWE are shown in Table2.
The distributions of theVDR gene SNPs are shown in
Table 3. The frequency of VDR gene ApaI rs7975232,
TaqI rs731236 and BsmI rs1544410 did not differ be-tween women with and without GDM in a codominant model and dominant model and recessive model (p >
0.05, each). VDR gene ApaI, TaqI, and BsmI SNPs were
not associated with GDM. The frequency of VDR gene
FokI rs2228570 differed between women with and with-out GDM (p < 0.05). Compared with the controls, FokI CT genotype (CT vs. CC, OR = 1.84, 95% CI: [1.05–3.23], p = 0.031) and TT (TT vs. CC, OR = 3.95, 95% CI: [1.56–
9.96], p = 0.002) genotype were associated with an
in-creased GDM risk in a codominant model, and CT/TT carriers had increased 2.2 odds of having GDM (CT/TT vs. CC, OR = 2.29, 95% CI: [1.35–3.89], p = 0.002) in a dominant model. Compared with the controls, TT geno-type carriers had increased 3.02 odds of having GDM
(CT/CC vs. TT, OR = 3.02, 95% CI: [1.23–7.38], p =
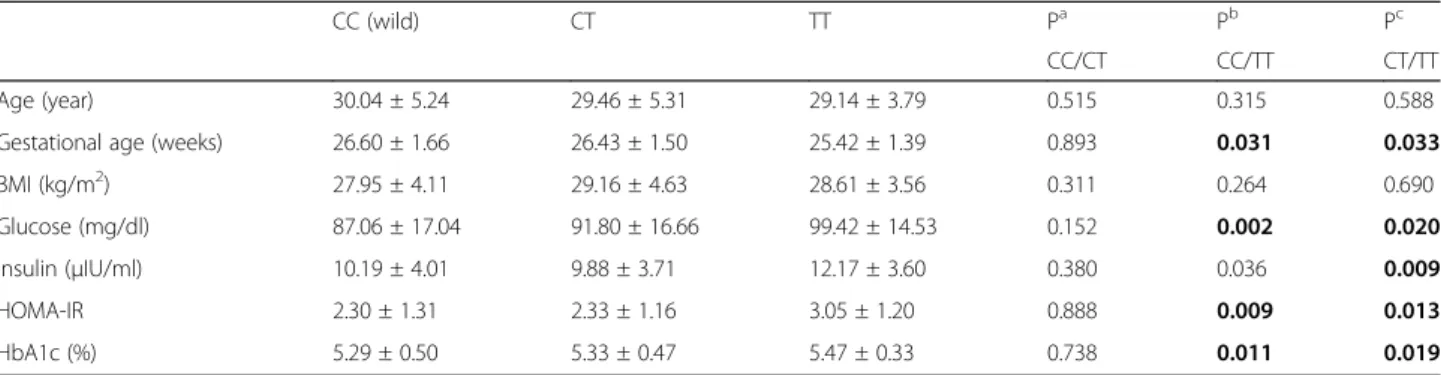
0.012) in a recessive model. Gestational age was lower in FokI-TT genotype compared with CC and CT genotype
(p < 0.05). Glucose, HbA1c, and HOMA-IR were higher
in the FokI-TT genotype compared with the CC and CT
genotypes (p < 0.05) (Table 4). FokI-T (risk allele) was
positively correlated with log-HOMA-IR (r = 0.326, p =
0.004). In the logistic regression analysis, FokI SNPs
were independently associated with GDM after adjustig for BMI and age (β = 1.63, 95% CI: [1. 2-4.2], p = 0.012). Discussion
This case-control study showed that VDR gene FokI
SNPs were independently associated with having GDM
in Turkish women. The frequency of theVDR gene FokI
TT and CT genotype was increased in women with GDM compared with the non-GDM controls. The
fre-quency ofVDR gene ApaI, BsmI, and TaqI SNPs did not
differ between women with and without GDM with no
association. VDR FokI SNPs might contribute to insulin
resistance in the development of GDM.
Our results showed that 25(OH)D concentrations were lower in the GDM group than in the control group. Vitamin D deficiency was associated with insulin
resist-ance and GDM [8]. The VDR gene has a role in the
metabolic pathway of insulin [9]. VDR gene variations
have beenshown to be correlated in the development,
progression, and complications of T2DM [13–15]. The
present study showed thatVDR gene FokI SNPs were
in-dependently associated with an increased risk of GDM in Turkish women (β = 1.63, 95% CI: [1. 2-4.2], p =
0.012). Our study suggested that VDR gene FokI SNPs
might be associated with having GDM. We found that
the frequency ofVDR gene ApaI, TaqI, and BsmI did not
differ between women with and without GDM. VDR
gene ApaI, TaqI, and BsmI SNPs were not associated
with GDM. TheVDR gene FokI SNP showed significant
differences between women with and without GDM. VDR gene FokI (variant or heterozygotes) compared to wild-type (CC) SNP revealed a significant association. VDR gene FokI rs2228570 TT (TT vs. CC, OR = 3.95,
95% CI: [1.56–9.96], p = 0.002) and CT heterozygotes
(CT vs. CC, OR = 1.84, 95% CI: [1.05–3.239, p = 0.031)
were associated with having GDM, compared with the
controls. VDR gene FokI SNPs might contribute to
de-veloping GDM in the Turkish population.
Similar to our results,FokI homozygous SNPs were
re-ported as prevalent in patients with DM and GDM [12,
13]. Aslani et al. reported that VDR gene FokI SNPs
were associated with GDM in an Iranian population
[12]. Another study reported that ApaI and Taq SNPs
were associated with GDM in an Iranian population [16]. These results are incompatible with our study, thus
we showed that ApaI, Taq, and BsmI SNPs were not
as-sociated with GDM.BsmI and FokI SNPs were not
asso-ciated with GDM in a Saudi Arabian population [17].
Vural and Maltas et al. showed thatTaqI SNPs were not
associated with T2DM in a Turkish population [15].
Table 1 Characteristics of subjects
Non-GDM (n = 135) GDM (n = 100) P Age (year) 29.13 ± 5.20 29.41 ± 5.02 0.704 Gestational age (weeks) 26.62 ± 1.48 26.04 ± 1.67 0.014 Height (cm) 159.01 ± 5.90 158.52 ± 4.95 0.665 Weight (kg) 68.58 ± 9.65 75.08 ± 10.07 0.002 BMI (kg/m2) 26.19 ± 4.01 29.94 ± 4.18 0.003 Glucose (mg/dl) 76.19 ± 8.93 105.77 ± 7.81 0.005 İnsulin (μIU/ml) 8.01 ± 1.69 12.83 ± 4.07 0.002 HOMA-IR 1.52 ± 0.48 3.36 ± 1.14 0.003 HbA1c (%) 4.99 ± 0.25 5.69 ± 0.38 0.004 25(OH)D 17.60 ± 10.24 12.04 ± 8.51 0.001 Systolic BP (mmHg) 101.37 ± 11.44 111.77 ± 14.31 0.008 Diastolic BP (mmHg) 66.01 ± 7.46 71.08 ± 7.22 0.012
BMI body mass index, HOMA-IR homeostasis model assessment-insulin resistance, HbA1c hemoglobin A1c, BP blood pressure, GDM gestational diabetes mellitus
Student’s t test was used for normally distributed continuous variables or log-transformed variables between two groups
Dilmec et al. reported that TaqI SNPs were associated
with T2DM, but ApaI and FokI SNPs were not
associ-ated with T2DM in a Turkish population [14]. Previous
studies investigating the VDR gene in Turkish patients
with T2DM were compatible with our study. Hence, we
supposed that Taq and ApaI were not associated with
having T2DM in the Turkish population.
VDR gene Taq, BsmI or ApaI SNPs were not associ-ated with diabetic microvascular complications but only FokI SNPs were associated with diabetic neuropathy in a Caucasian population [13]. Meta-analysis reported that
only FokI SNPs were found as a risk factor for T2DM.
Taq, BsmI or ApaI SNPs were not associated with DM [21]. These reports were similar to the present study; we Table 2 Minor allele frequency and Hardy-Weinberg Equilibrium of VDR gene SNPs
Risk allele MAF for study sample p for HWE in control
Apa I rs7975232 C 0.54 0.23
TaqI rs731236 C 0.35 0.78
BsmI rs15444410 G 0.38 0.15
FokI rs2228570 T 0.29 0.20
MAF minor allele frequency, HWE Hardy-Weinberg Equilibrium
The Hardy-Weinberg equilibrium (HWE) at individual loci was assessed by Chi-Square test
Table 3 Genotype analysis of VDR gene SNPs
Non-GDM (n = 134) GDM (n = 100) OR (95% CI) P ApaI rs7975232 (%)
Co-dominant Wild type AA 19.4 17.0
Heterozygous AC 56.7 52.0 1.04 (0.51–2.12) 0.985
Homozygous CC 23.9 31.0 1.48 (0.67–3.25) 0.326
Dominant (AA/AC + CC) 1.17 (0.59–2.30) 0.639
Recessive (AA+AC/CC) 1.43 (0.80–2.56) 0.225
TaqI rs731236 (%)
Co-dominant Wild type TT 40.0 44.0
Heterozygous CT 49.6 42.0 0.76 (0.44–1.33) 0.353
Homozygous CC 10.4 14.0 1.22 (0.52–2.84) 0.633
Dominant (TT/CT + CC) 0.84 (0.50–1.43) 0.539
Recessive (TT + CT/CC) 1.40 (0.63–3.10) 0.396
BsmI rs1544410 (%)
Co-dominant Wild type AA 31.9 42.0
Heterozygous AG 57.0 44.0 0.58 (0.33–1.02) 0.062
Homozygous GG 11.1 14.0 0.95 (0.41–2.22) 0.916
Dominant (AA/AG + GG) 0.64 (0.37–1.10) 0.109
Recessive (AA+AG/GG) 1.30 (0.59–2.83) 0.506
FokI rs2228570 (%)
Co-dominant Wild type CC 60.0 41.0
Heterozygous CT 34.1 43.0 1.84 (1.05–3.23) 0.031
Homozygous TT 5.9 16.0 3.95 (1.56–9.96) 0.002
Dominant (CC/CT + TT) 2.29 (1.35–3.89) 0.002
Recessive (CC + CT/TT) 3.02 (1.23–7.38) 0.012
GDM gestational diabetes mellitus
SNPs were expressed as allelic frequency (q) or prevalence of genotypes (%)
Categorical variables were analyzed with Chi-square test or Fisher’s exact test, where appropriate
Multiple logistic regression analysis and Fisher’s exact test were tested using models: dominant (major allele homozygotes vs heterozygotes + minor allele homozygotes), recessive (major allele homozygotes + heterozygotes vs minor allele homozygotes) and codominant (major allele homozygotes vs heterozygote and minor allele homozygotes vs major allele homozygotes)
showed that onlyFokI SNPs were associated with having GDM. A meta-analysis showed that only BsmI SNPs were associated with autoimmune T1DM in an Asian
population [11]. We supposed that autoimmunity might
contribute to the association between BsmI SNPS and
having T1DM. The inconsistency between studies might result from ethnic diversity and environmental factors onVDR variations in different populations [12].
The present study showed that the FokI-T (risk allele) was positively correlated with log-HOMA-IR. Assessment of allele frequency distribution showed a significant asso-ciation of the FokI variant allele (T) on susceptibility
to-ward to GDM. We supposed that the FokI variant might
contribute to impaired insulin resistance and metabolic
disorder in developing GDM. Hence, FokI SNPs might
have a role in the pathogenesis of GDM.
BsmI, ApaI, and TaqI polymorphisms of the VDR gene are found in the three-primer untranslated region
(3′-UTR) and have been shown to be in strong linkage
disequilibrium (LD) [21]. The FokI polymorphism was
reported as an independent marker of theVDR gene
be-cause it has not been shown to be in linkage
disequilib-rium with any of other VDR polymorphisms [12]. Our
study reported thatVDR gene FokI, ApaI, BsmI and TaqI
haplotypes were not associated with GDM, and ApaI,
BsmI and TaqI polymorphisms were not shown in LD. ApaI and BsmI polymorphisms of the VDR gene, both in intron 8, are considered as silent SNPs. These polymor-phisms do not change the amino acid sequence of the encoded protein, but they might affect gene expression
by modulating stability of mRNA [21]. The TaqI
poly-morphism is located at codon 352 in exon 9 of theVDR
gene. TheTaqI TT genotype (absence of restriction site) is related to lower active vitamin D3 [21]. The only locus
with impact on the structure of VDR protein is the FokI
polymorphism, which is located on the 5′ end region of
the VDR gene. The VDR gene FokI polymorphism is
functional because it is found in a coding sequence. The
FokI polymorphism is located in the first ATG starting
code of VDR protein. FokI is involved in thymine to
cytosine (T/C) substitution at exon 2, the first transla-tion initiatransla-tion region is removed, and transcriptransla-tional ac-tivity of VDR is changed [12, 13, 16, 22]. It alters the ACG codon, which is found ten base pairs upstream from the translation starting codon and leads to the gen-eration of an additional starting codon. Two different VDR isoforms occur with transition of allele T to C in ATG. When initiating translation starts from this alter-native site in the thymine variant, it generates a longer VDR protein comprised of 427 amino acids. The gene is transcribed in normal length if there is a restriction site. Thus, the C/C allele codes a 424-amino acid protein and the T/T allele codes a 42 7-amino acid protein. The lon-ger VDR protein has low activity in transcription, ac-cordingly activation is decreased in target cells [12, 13].
The FokI T/T genotype, FokI C/C, showed 1.7-fold
greater function in vitamin D-dependent transcriptional activation of a reporter through the regulation of a
vita-min D response element [22]. TheFokI rs2228570
poly-morphism is the onlyVDR gene polymorphism involved
in the generation of altered protein expression [12].
Apart from obesity and insulin resistance, complex gen-etic (ethnicity) and non-gengen-etic (epigengen-etic) mechanisms may have a role in the etiology of GDM [9].
The cross-sectional design, small sample size, and ab-sence of postpartum follow-up are the limitations of this study.
Conclusion
This study showed thatVDR gene FokI SNPs were
inde-pendently associated with an increased risk of GDM in
Turkish pregnant women.VDR gene FokI SNPs may be
considered as a risk factor for metabolic disorders in
GDM.VDR FokI SNPs may have a role in the etiology of
GDM. Further studies in different populations are needed to confirm these results.
Table 4 Association between the VDR gene FokI SNPs and clinical features of GDM women
CC (wild) CT TT Pa Pb Pc
CC/CT CC/TT CT/TT Age (year) 30.04 ± 5.24 29.46 ± 5.31 29.14 ± 3.79 0.515 0.315 0.588 Gestational age (weeks) 26.60 ± 1.66 26.43 ± 1.50 25.42 ± 1.39 0.893 0.031 0.033 BMI (kg/m2) 27.95 ± 4.11 29.16 ± 4.63 28.61 ± 3.56 0.311 0.264 0.690 Glucose (mg/dl) 87.06 ± 17.04 91.80 ± 16.66 99.42 ± 14.53 0.152 0.002 0.020 İnsulin (μIU/ml) 10.19 ± 4.01 9.88 ± 3.71 12.17 ± 3.60 0.380 0.036 0.009 HOMA-IR 2.30 ± 1.31 2.33 ± 1.16 3.05 ± 1.20 0.888 0.009 0.013 HbA1c (%) 5.29 ± 0.50 5.33 ± 0.47 5.47 ± 0.33 0.738 0.011 0.019 a CC genotype vs CT genotypeb CC genotype vs TT genotype c CT genotype vs TT genotype
BMI body mass index, HOMA-IR homeostasis model assessment-insulin resistance, HbA1c hemoglobin A1c
Student’s t test was used for normally distributed continuous variables or log-transformed variables between two groups Bold represents significant p-values
Abbreviations
25(OH) vitamin D3:25-hydroxyvitamin D3; BMI: body mass index; BP: blood
pressure; GDM: gestational diabetes mellitus; HbA1c: hemoglobin A1c; HOMA-IR: homeostasis model assessment-insulin resistance index; LD: Pair-wise linkage disequilibrium
Acknowledgements Not applicable.
Funding
No funding sources for research.
Availability of data and materials
The datasets used and/or analysed during the current study available from the corresponding author on reasonable request.
Authors’ contributions
MA and SB, contributions to conception and design, or acquisition of data, or analysis and interpretation of data, involved in drafting the manuscript and approved the final manuscript, FAP, NE, MU, MK, OO and MC contributions to conception and design, or acquisition of data, or analysis and interpretation of data and approved the final manuscript; EC, revising it critically for important intellectual content; and have given final approval of the version to be published.
Ethics approval and consent to participate
This retrospective study was approved by Diskapi Yildirim Beyazit Teaching and Research Hospital Ethics Board (Number.26.02.2015–12/21) and written consent was obtained from the patients.
Consent for publication Not applicable.
Competing interests
The authors declare that they have no competing interests.
Publisher’s Note
Springer Nature remains neutral with regard to jurisdictional claims in published maps and institutional affiliations.
Author details
1Department of Endocrinology and Metabolism, Diskapi Yildirim Beyazit
Teaching and Research Hospital, Ankara, Turkey.2Department of Medical
Biology, Baskent University, Ankara, Turkey.3Department of Genetic Research, Diskapi Yildirim Beyazit Teaching and Research Hospital, Ankara, Turkey.
4Department of Obstetrics and Gynecology, Gulhane School of Medicine,
Ankara, Turkey.5Department of Obstetrics and Gynecology, Ankara Numune
Teaching and Research Hospital, Ankara, Turkey.
Received: 26 September 2018 Accepted: 7 May 2019
References
1. Zhang C, Bao W, Rong Y, Yang H, Bowers K, Yeung E, Kiely M. Genetic variants and the risk of gestational diabetes mellitus: a systematic review. Hum Reprod Update. 2013;19:376–90.
2. International Association of Diabetes & Pregnancy Study Groups (IADPSG) Consensus Panel Writing Group and the Hyperglycemia & Adverse Pregnancy Outcome (HAPO) Study Steering Committee, Metzger BE, Gabbe SG, Persson B, Buchanan TA, Catalano PM, Damm P, Dyer AR, Hod M, Kitzmiller JL, et al. The diagnosis of gestational diabetes mellitus: new paradigms or status quo? J Matern-Fetal Neonatal Med Off J Eur Assoc Perinat Med Fed Asia Ocean Perinat Soc Int Soc Perinat Obstet. 2012;25:2564–9. 3. Mao H, Li Q, Gao S. Meta-analysis of the relationship between common
type 2 diabetes risk gene variants with gestational diabetes mellitus. PLoS One. 2012;7:e45882.
4. Huopio H, Cederberg H, Vangipurapu J, Hakkarainen H, Pääkkönen M, Kuulasmaa T, Heinonen S, Laakso M. Association of risk variants for type 2 diabetes and hyperglycemia with gestational diabetes. Eur J Endocrinol Eur Fed Endocr Soc. 2013;169:291–7.
5. Lauenborg J, Grarup N, Damm P, Borch-Johnsen K, Jørgensen T, Pedersen O, Hansen T. Common type 2 diabetes risk gene variants associate with gestational diabetes. J Clin Endocrinol Metab. 2009;94:145–50. 6. Kwak SH, Kim S-H, Cho YM, Go MJ, Cho YS, Choi SH, Moon MK, Jung HS,
Shin HD, Kang HM, et al. A genome-wide association study of gestational diabetes mellitus in Korean women. Diabetes. 2012;61:531–41. 7. Sintov AC, Yarmolinsky L, Dahan A, Ben-Shabat S. Pharmacological
effects of vitamin D and its analogs: recent developments. Drug Discov Today. 2014;19:1769–74.
8. Aghajafari F, Nagulesapillai T, Ronksley PE, Tough SC, O’Beirne M, Rabi DM. Association between maternal serum 25-hydroxyvitamin D level and pregnancy and neonatal outcomes: systematic review and meta-analysis of observational studies. BMJ. 2013;346:f1169.
9. Tuoresmäki P, Väisänen S, Neme A, Heikkinen S, Carlberg C. Patterns of genome-wide VDR locations. PLoS One. 2014;9:e96105.
10. Bid HK, Konwar R, Aggarwal CG, Gautam S, Saxena M, Nayak VL, Banerjee M. Vitamin D receptor (FokI, BsmI and TaqI) gene polymorphisms and type 2 diabetes mellitus: a north Indian study. Indian J Med Sci. 2009;63:187–94. 11. Zhang J, Li W, Liu J, Wu W, Ouyang H, Zhang Q, Wang Y, Liu L, Yang R, Liu X,
et al. Polymorphisms in the vitamin D receptor gene and type 1 diabetes mellitus risk: an update by meta-analysis. Mol Cell Endocrinol. 2012;355:135–42. 12. Aslani S, Hossein-Nezhad A, Mirzaei K, Maghbooli Z, Afshar AN, Karimi F.
VDR FokI polymorphism and its potential role in the pathogenesis of gestational diabetes mellitus and its complications. Gynecol Endocrinol Off J Int Soc Gynecol Endocrinol. 2011;27:1055–60.
13. Liu, Z., Liu, L., Chen, X., He, W., and Yu, X. (2014). Associations study of vitamin D receptor gene polymorphisms with diabetic microvascular complications: a meta-analysis. Gene 2014, 546(1), 6–10.
14. Dilmec F, Uzer E, Akkafa F, Kose E, van Kuilenburg ABP. Detection of VDR gene ApaI and TaqI polymorphisms in patients with type 2 diabetes mellitus using PCR-RFLP method in a Turkish population. J Diabetes Complicat. 2010;24:186–91.
15. Vural HC, Maltas E. RT-qPCR assay on the vitamin D receptor gene in type 2 diabetes and hypertension patients in Turkey. Genet Mol Res GMR. 2012;11:582–90. 16. Rahmannezhad G, Mashayekhi FJ, Goodarzi MT, Rezvanfar MR, Sadeghi A.
Association between vitamin D receptor ApaI and TaqI gene polymorphisms and gestational diabetes mellitus in an Iranian pregnant women population. Gene. 2016;581:43–7.
17. El-Beshbishy HA, Tawfeek MA, Taha IM, FadulElahi T, Shaheen AY, Bardi FA, Sultan II. Association of vitamin D receptor gene BsmI (a>G) and FokI (C>T) polymorphism in gestational diabetes among Saudi women. Pak J Med Sci. 2015;31:1328–33.
18. Tawfeek M. Vitamin D receptor BsmI gene polymorphisms and gestational diabetes mellitus: a Saudi study. Br J Med Med Res. 2011;1:459–68. 19. Wang Y, Wang O, Li W, Ma L, Ping F, Chen L, Nie M. Variants in vitamin D
binding protein gene are associated with gestational diabetes mellitus. Medicine (Baltimore). 2015;94:e1693.
20. Mather KJ, Hunt AE, Steinberg HO, Paradisi G, Hook G, Katz A, Quon MJ, Baron AD. Repeatability characteristics of simple indices of insulin resistance: implications for research applications. J Clin Endocrinol Metab. 2001;86:5457–64. 21. Li L, Wu B, Liu J-Y, Yang L-B. Vitamin D receptor gene polymorphisms and
type 2 diabetes: a meta-analysis. Arch Med Res. 2013;44:235–41.
22. Gross C, Krishnan AV, Malloy PJ, Eccleshall TR, Zhao XY, Feldman D. The vitamin D receptor gene start codon polymorphism: a functional analysis of FokI variants. J Bone Miner Res Off J Am Soc Bone Miner Res. 1998;13:1691–9.